1. Introduction
In this last part of the tutorial we are going to talk about the topic where all the observability pillars come together: monitoring and alerting. For many, this subject belongs strictly to operations and the only way you know it is somehow working is when you are on-call and get pulled in.
Table Of Contents
The goal of our discussion is to demystify at least some aspects of the monitoring, learn about alerts, and understand how metrics, distributed traces and sometimes even logs are being used to continuously observe the state of the system and notify about upcoming issues, anomalies, potential outages or misbehavior.
2. Monitoring and Alerting Philosophy
There are tons of different metrics which could (and should) be collected while operating a more or less realistic software system, particularity designed after microservice architecture principles. In this context, the process for collecting and storing such state data is usually referred as monitoring.
So what exactly should you monitor? To be fair, it is not easy to come up upfront with all the possible aspects of the system which have to be monitored and, as such, to decide which metrics (and other signals) you need to collect and which ones you do not, but the golden rule “more data is better than no data” certainly applies here. The ultimate goal is when things go wrong the monitoring subsystem should let you know right away. This is what alerting is all about.
Alert messaging (or alert notification) is machine-to-person communication that is important or time sensitive.
Obviously, you could alert on anything but there are certain rules you are advised to follow while defining your own alerts. The best summary regarding the alerting philosophy is laid out in these excellent articles, Alerting Philosophy by Netflix and My Philosophy on Alerting by Rob Ewaschuk. Please try to find the time to go over these resources, the insights presented in there are priceless.
To summarize some best practices, when an alert triggers, it should be easy to understand why, so keeping the alerts rules as simple as possible is a good idea. Once the alert sets off someone should be notified and look into it. As such, the alerts should indicate the real cause, be actionable and meaningful, the noisy ones should be avoided at all cost (and they will be ignored anyway).
Last but not least, no matter how many metrics you collect, how many dashboards and alerts you have had configured, there would be always something missed. Please consider this process to be a continuous improvement, reevaluate periodically your monitoring, logging, distributed tracing, metrics collection and alerting decisions.
3. Infrastructure Monitoring
The monitoring of the infrastructure components and layers is somewhat a solved problem. From the open-source perspective the well-established names like Nagios, Zabbix, Riemann, OpenNMS and Icinga are ruling there and it is very likely that your operations team is already betting on one of those.
4. Application Monitoring
The infrastructure certainly falls into the “must be monitored” category but the application side of monitoring is arguably much more interesting and closer to the subject. So let us direct the conversation towards that.
4.1 Prometheus and Alertmanager
We have talked about Prometheus already, primarily as a metrics storage, but the fact is that it also includes the alerting component called AlertManager makes it come back.
The AlertManager handles alerts sent by client applications such as the Prometheus server. It takes care of deduplicating, grouping, and routing them to the correct receiver integrations such as email, PagerDuty, or OpsGenie. It also takes care of silencing and inhibition of alerts. – https://prometheus.io/docs/alerting/alertmanager/
Actually, AlertManager is a standalone binary process which handles alerts sent by Prometheus server instance. Since the JCG Car Rentals platform has chosen Prometheus as the metrics and monitoring platform, it becomes a logical choice to manage the alerts as well.
Basically, there are a few steps to follow. The procedure consists of configuring and running the instance of AlertManager, configuring Prometheus to talk to this AlertManager instance and finally defining the alert rules in the Prometheus. Taking one step at a time, let us start off with AlertManager configuration first.
global:
  resolve_timeout: 5m
  smtp_smarthost: 'localhost:25'
  smtp_from: 'alertmanager@jcg.org'
route:
  receiver: 'jcg-ops'
  group_wait: 30s
  group_interval: 5m
  repeat_interval: 1h
  group_by: [cluster, alertname]
  routes:
  - receiver: 'jcg-db-ops'
    group_wait: 10s
    match_re:
      service: postgresql|cassandra|mongodb
receivers:
- name: 'jcg-ops'
  email_configs:
  - to: 'ops-alerts@jcg.org'
- name: 'jcg-db-ops'
  email_configs:
  - to: 'db-alerts@jcg.org'
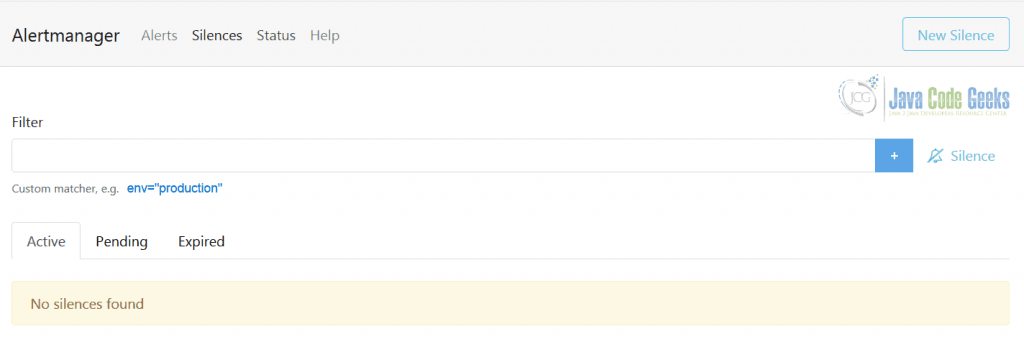
If we supply this configuration snippet to the AlertManager process (usually by storing it in the alertmanager.yml), it should start successfully, exposing its web frontend at port 9093.
Excellent, now we have to tell Prometheus where to look for AlertManager instance. As usual, it is done through configuration file.
rule_files:
  - alert.rules.yml

alerting:
  alertmanagers:
  - static_configs:
    - targets:
      - 'alertmanager:9093'
The snippet above also includes the most interesting part, the alert rules, and this is what we are going to loot at next. So what would be a good, simple and useful example of meaningful alert in the context of JCG Car Rentals platform? Since most of the JCG Car Rentals services are run on JVM, the one which comes to mind first is heap usage: getting too close to the limit is a good indication of a trouble and possible memory leak.
groups:
- name: jvm
  rules:
  - alert: JvmHeapIsFillingUp
    expr: jvm_memory_used_bytes{area="heap"} / jvm_memory_max_bytes{area="heap"} > 0.8
    for: 5m
    labels:
      severity: warning
    annotations:
      description: 'JVM heap usage for {{ $labels.instance }} of job {{ $labels.job }} is close to 80% for last 5 minutes.'
      summary: 'JVM heap for {{ $labels.instance }} is filling up'
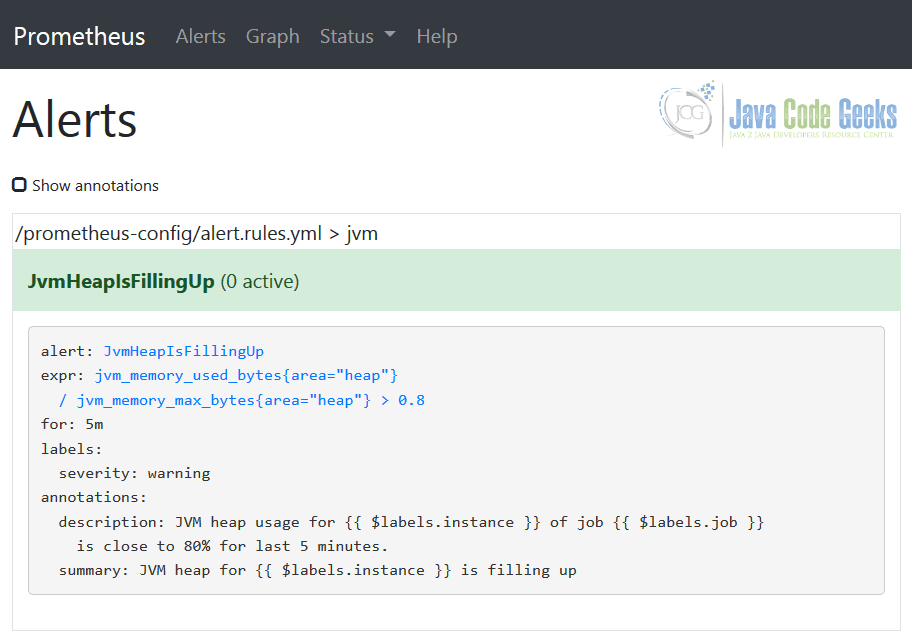
The same alert rules could be seen in Prometheus using the Alerts view, confirming that the configuration has been picked up properly.
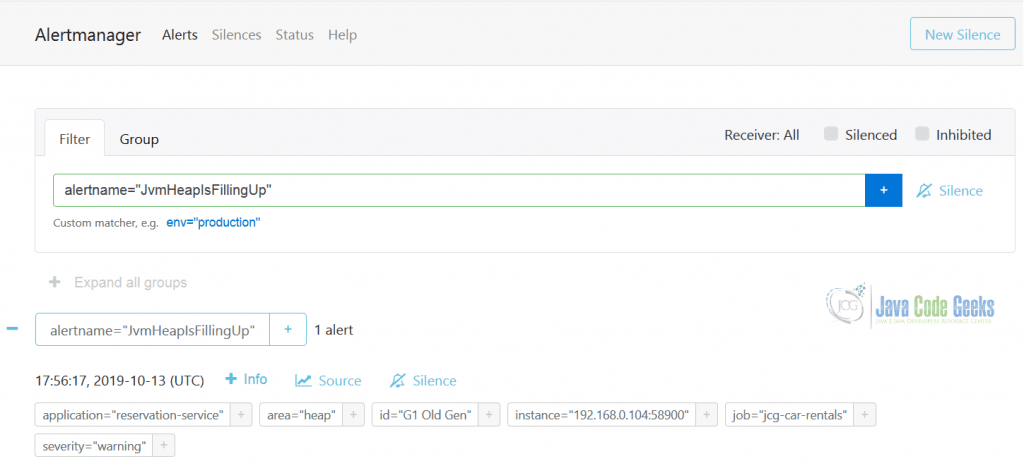
Once the alert triggers, is it going to appear in the AlertManager immediately, at the same time notifying all affected recipients (the receivers). On the picture below you could see the example of the triggered JvmHeapIsFillingUp alert.
As you may agree at this point, Prometheus is indeed a full-fledged monitoring platform, covering you not only from the metrics collection perspective, but the alerting as well.
4.2 TICK Stack: Chronograf
If the TICK stack sounds familiar to you that is because it popped up on our radar in the previous part of the tutorial. One of the components of the TICK stack (which corresponds to letter C in the abbreviation) is Chronograf.
Chronograf provides a user interface for Kapacitor – a native data processing engine that can process both stream and batch data from InfluxDB. You can create alerts with a simple step-by-step UI and see your alert history in Chronograf.
The InfluxDB 2.0 (still in alpha), the future of the InfluxDB and TICK stack in general, will incorporate Chronograf into its time series platform.
4.3 Netfix Atlas
Netflix Atlas, the last one from the old comers we have talked about before, also has support for alerting built-in into the platform.
4.4 Hawkular
Starting from the Hawkular, one of the Red Hat community projects, we are switching off the gears to the dedicated all-in-one open-source monitoring solutions.
Hawkular is a set of Open Source (Apache License v2) projects designed to be a generic solution for common monitoring problems. The Hawkular projects provide REST services that can be used for all kinds of monitoring needs.
The list of the Hawkular components includes support for alerting, metrics collection and distributed tracing (based on Jaeger).

4.5 Stagemonitor
Stagemonitor is an example of the monitoring solution dedicated specifically to Java-based server applications.
Stagemonitor is a Java monitoring agent that tightly integrates with time series databases like Elasticsearch, Graphite and InfluxDB to analyze graphed metrics and Kibana to analyze requests and call stacks. It includes preconfigured Grafana and Kibana dashboards that can be customized.
Similarly to Hawkular, it comes with distributed tracing, metrics and alerting support out of the box. Plus, since it targets only Java applications, a lot of the Java-specific insights are being backed into the platform as well.
4.6 Grafana
It may sound least expected but Grafana is not only an awesome visualization tool but starting from version 4.0 it comes with own alert engine and alert rules. Alerting in Grafana is available on per-dashboard panel level (only graphs at this moment) and upon save, alerting rules are going to be extracted into separate storage and be scheduled for evaluation. To be honest, there are certain restrictions which make Grafana’s alerting of limited use.
4.7 Adaptive Alerting
So far we have talked about more or less traditional approaches to alerting, based on metrics, rules, criteria or/and expressions. However, more advanced techniques like anomaly detection are slowly making its way into monitoring systems. One of the pioneers in this space is Adaptive Alerting by Expedia.
The main goal for Adaptive Alerting is to help drive down the Mean Time To Detect (MTTD). It does this by listening to streaming metric data, identifying candidate anomalies, validating them to avoid false positives and finally passing them along to downstream enrichment and response systems. – https://github.com/ExpediaDotCom/adaptive-alerting/wiki/Architectural-Overview
The Adaptive Alerting is behind the anomaly detection subsystem in the Haystack, a resilient, scalable tracing and analysis system we have talked about in the previous part of the tutorial.
5. Orchestration
The container orchestrators ruled by the service meshes is probably the most widespread microservices deployment model nowadays. In fact, the service mesh plays the role of the “shadow cardinal” who is in charge and knows everything. By pulling all this knowledge from the service mesh, the complete picture of your microservice architecture is going to emerge. One of the first projects that decided to pursue this simple but powerful idea was Kiali.
Kiali is an observability console for Istio with service mesh configuration capabilities. It helps you to understand the structure of your service mesh by inferring the topology, and also provides the health of your mesh. Kiali provides detailed metrics, and a basic Grafana integration is available for advanced queries. Distributed tracing is provided by integrating Jaeger.
Kiali consolidates most of the observability pillars in one place, combining it with the real-time topology view of your microservices fleet. If you are not using Istio, than Kiali may not help you much, but other service meshes are catching up, for example Linkerd comes with telemetry and monitoring features as well.
So what about alerting? It seems like the alerting capabilities are left out at the moment, and you may need to hook into Prometheus or / and Grafana yourself in order to configure the alert rules.
6. Cloud
The cloud story for alerting is a logical continuation of the discussion we have started while talking about metrics. The same offerings which take care of the collecting the operational data are the ones to manage alerts.
In case of AWS, the Amazon CloudWatch enables setting the alarms (the AWS notion of alerts) and automated actions based on either predefined thresholds or on machine learning algorithms (like anomaly detection for example).
The Azure Monitor, which backs metrics and logs collection in Microsoft Azure, allows to configure different kind of alerts based on logs, metrics or activities.
In the same vein, Google Cloud bundles alerting into Stackdriver Monitoring, which provides the way to define the alerting policy: the circumstances to be alerted on and how to be notified.
7. Serverless
The alerts are as equally important in the world of serverless as everywhere else. But as we already realized, the alerts related to hosts for example are certainly not on your horizon. So what is happening in the serverless universe with regards to alerting?
It is actually not an easy question to answer. Obviously, if you are using the serverless offering from the cloud providers, you should be pretty much covered (or limited?) by their tooling. On the other end of the spectrum we have standalone frameworks making own choices.
For example, OpenFaas uses Prometheus and AlertManager so you are pretty much free to define whatever alerts you may need. Similarly, Apache OpenWhisk exposes a number of metrics which could be published to Prometheus and further decorated by alert rules. The Serverless Framework comes with a set of preconfigured alerts but there are restrictions associated with their free tier.
8. Alerts Are Not Only About Metrics
In most cases, metrics are the only input fed into alert rules. By and large, it makes sense, but there are other signals you may want to exploit. Let us consider logs for example. What if you want to get an alert if some specific kind of exception appears in the logs?
Unfortunately, nor Prometheus nor Grafana, Netfix Atlas, Chronograf or Stagemonitor would help you here. On a positive note, we have Hawkular which is able to examine logs stored in Elasticsearch and trigger the alerts using pattern matching. Also, Grafana Loki is making a good progress towards supporting alerts based of logs. As the last resort, you may need to roll your own solution.
9. Microservices: Monitoring and Alerting – Conclusions
In this last part of the tutorial we have talked about alerting, the culmination of the observability discussions. As we have seen, it is very easy to create alerts, but it is very difficult to come up with the good and actionable ones. If you get paged at night, there should be a real reason for that. You should not spend hours trying to understand what this alert means, why it was triggered and what to do about it.
10. At the End
Admittedly, it was a long journey! Along the way we went over so many different topics that you may feel scared of microservice architecture. Fear no more, there are tremendous benefits it brings on the table however it also requires you to think about the systems you are building in a different way. Hopefully the end of this tutorial is just a beginning of your journey into the exciting world of the microservice architecture.
But keep your ears open. Yes, microservice architecture is not a silver bullet. Please do not buy it as a sales pitch or fall into the hype trap. It solves the real problems but you should actually run into them before choosing microservices as the solution. Please do not invert this simple formula.
Best of luck and with that, happy microservicing!
