1. Introduction
In this part of the tutorial we are going to continue our journey into observability land and tackle its next foundational pillar, metrics. While logs are descriptive, metrics take the inspiration from measurements.
If you can’t measure it, you can’t improve it.– Peter Drucker
Metrics are serving multi-fold purposes. First of all, they give you quick insights into the current state of your service or application. Secondly, metrics could help to correlate the behavior of different applications, services and/or infrastructure components under heavy load or outages. As a consequence, they could lead to faster problems identification and bottlenecks detection. And last but not least, metrics could help to proactively and efficiently mitigate the potential issues, minimizing the risk of them to grow into serious problems or widespread outages.
Yet there are more. One of the most valuable properties of the metrics is the ability to capture the overall system performance characteristics, as such establishing the baseline to compare and to trend over. Backed by continuous integration and delivery practices, they assist in detection of any undesirable regressions early enough, before ones sneak into production.
It sounds really useful, but what kind of metrics our systems need? How could we instrument our applications and services? And what exactly should we measure? Those are the hard questions we will be trying to attack in this part of the tutorial.
Table Of Contents
2. Instrument, Collect, Visualize (and Alert)
Metrics do not show up from nowhere, the applications and/or services should be instrumented in order to expose the relevant insights. Luckily, JVM ecosystem is flourishing here, there are a few excellent instrumentation libraries (notably Micrometer and Dropwizard Metrics) and most of the widely used frameworks have out-of-the box integrations with at least one of them.
Once exposed, metrics need to be collected (pushed or scraped) and persisted somewhere in order to provide the historical trends over time and aggregations. Typically, this is fulfilled by using one of the time series databases.
A time series database is built specifically for handling metrics and events or measurements that are time-stamped. A TSDB is optimized for measuring change over time. Properties that make time series data very different than other data workloads are data lifecycle management, summarization, and large range scans of many records. – https://www.influxdata.com/time-series-database/
The final phase of the metrics lifecycle is visualization, usually through pre-built dashboards, using charts / graphs, tables, heatmaps, etc. From the operational perspective, this is certainly useful but the true value of metrics is to serve as the foundation for real-time alerts: the ability to oversee the trends and proactively notify about anomalies or emerging issues. It is so critical and important for real-world production systems that we are going to devote a whole part of the tutorial to talk about alerting.
3. Operational vs Application vs Business
There is enormous amount of metrics which could be collected and acted upon. Roughly, they could be split into three classes: operational metrics, application metrics and business metrics.
To put things into perspective, let us focus on JCG Car Rentals platform which constitutes of multiple HTTP-based microservices, data storages and message brokers. These components are probably running on some kind of virtual or physical host, very likely inside the container. At minimum, at every layer we would be interested to collect metrics for CPU, memory, disk I/O and network utilization.
In the case of HTTP-based microservices, what we want to be aware of, at minimum, are the following things:
- Requests Per Second (RPS). This is a core metric which indicates how many requests are travelling through the application or service.
- Response time. Yet another core metric which shows off how much time it takes to the application or service to respond to the requests.
- Errors. This metric indicates the rate of erroneous application or service responses. In case of HTTP protocol, we are mostly interested in
5xxerrors (the server-side ones), however practically4xxerrors should not be neglected either.
Those are typical examples of the operational metrics, and to be fair, there are hundreds and hundreds of them. Some are straightforward, others are not. For example, what could be a good, indicative metrics for the message brokers taking into the account the differences in their architectures? Luckily, in majority of cases the vendors and maintainers already took care of exposing and documenting the relevant metrics, and even further, publishing the dashboards and templates to ease up the operations.
So what about the application metrics? As you may guess, those are really dependent on the implementation context and vary. For example, the applications built on top of actor model should expose a number of metrics related to actor system and actors. In the same vein, the Tomcat-based applications may need to expose the metrics related to server thread pools and queues.
The business metrics are essentially intrinsic to each system’s domain and vary significantly. For example, for JCG Car Rentals platform the important business metric may include the number of reservations over time interval.
4. JVM Peculiarities
In the Java world, there is one thing in between operating system and the application: the JVM. It is terrific but equally complex piece of technology which has to be watched out: CPU, heap consumption, garbage collection, metaspace, classloading, off-heap buffers, … and so on. To our luck, JVM exposes tons of metrics out of the box so it becomes the matter of using them properly.
To generalize this point, always learn the runtime your applications and services are running under and make sure that you have the right metrics in place to understand what is going on.
5. Pull or Push?
Depending on the monitoring backend you are using, there two basic strategies how metrics are being gathered from the applications or services: either they are periodically pushed or pulled (scraped). Each of these strategies has own pros and cons (for example, well-known weakness of pull-based strategy is ephemeral and batch jobs which may not exist long enough to be scraped) so please spend some time to understand which one fits the best to your context.
6. Storage
As we have touched upon before, storing and querying metrics efficiently requires the use of the dedicated time series database. There are quite a few good choices out there we are going to talk about.
6.1. RRDTool
If you are looking for something really basic, the RRDtool (or the longer version, Round Robin Database tool) is probably the one you need.
RRDtool is the OpenSource industry standard, high performance data logging and graphing system for time series data. RRDtool can be easily integrated in shell scripts, perl, python, ruby, lua or tcl applications. – https://oss.oetiker.ch/rrdtool/
The idea behind round robin databases is quite simple and exploits the circular buffers, thus keeping the system storage footprint constant over time.
6.2. Ganglia
Once quite popular, Ganglia is probably the oldest open source monitoring systems out there. Although you may find mentions about Ganglia in the wild, unfortunately it is not actively developed anymore.
Ganglia is a scalable distributed monitoring system for high-performance computing systems such as clusters and Grids. – http://ganglia.info/
6.3. Graphite
Graphite is one of the first open source projects emerged as the full-fledged monitoring tool. It was created back in 2006 but is still being actively maintained.
Graphite is an enterprise-ready monitoring tool that runs equally well on cheap hardware or Cloud infrastructure. Teams use Graphite to track the performance of their websites, applications, business services, and networked servers. It marked the start of a new generation of monitoring tools, making it easier than ever to store, retrieve, share, and visualize time-series data. – https://graphiteapp.org/#overview
Interestingly, the Graphite’s storage engine is very similar in design and purpose to round robin databases, such as RRDTool.
6.4. OpenTSDB
Some of the time series databases are built on top of more traditional (relation or non-relational) data storage, like for example OpenTSDB, which relies on Apache HBase.
OpenTSDB is a distributed, scalable Time Series Database (TSDB) written on top of HBase. OpenTSDB was written to address a common need: store, index and serve metrics collected from computer systems (network gear, operating systems, applications) at a large scale, and make this data easily accessible and graphable. – https://github.com/OpenTSDB/opentsdb
6.5. TimescaleDB
TimescaleDB is yet another example of the open-source time series database built on top of the proven data store, in this case PostgreSQL.
TimescaleDB is an open-source time-series database optimized for fast ingest and complex queries. It speaks “full SQL” and is correspondingly easy to use like a traditional relational database, yet scales in ways previously reserved for NoSQL databases. – https://docs.timescale.com/latest/introduction
From the development perspective, TimescaleDB is implemented as an extension on PostgreSQL so it basically means running inside the PostgreSQL instance.
6.6. KairosDB
KairosDB was originally forked from OpenTSDB but with the time it evolved into independent, promising open-source time series database.
KairosDB is a fast distributed scalable time series database written on top of Cassandra. – https://github.com/kairosdb/kairosdb

6.7. InfluxDB (and TICK Stack)
InfluxDB is an open source time series database which is developed and maintained by InfluxData.
InfluxDB is a time series database designed to handle high write and query load – https://www.influxdata.com/products/influxdb-overview/
InfluxDB is rarely used alone but as the part of more comprehensive platform called the TICK stack, which includes Telegraf, Chronograf and Kapacitor. The next generation of the InfluxDB, currently in alpha, intends to unify this time series platform in a single redistributable binary.
6.8. Prometheus
These days Prometheus is the number one choice as the metrics, monitoring and alerting platform. Besides its simplicity and ease of deployment, it natively integrates with container orchestrators like Kubernetes for example.
Prometheus is an open-source systems monitoring and alerting toolkit originally built at SoundCloud. – https://prometheus.io/docs/introduction/overview/
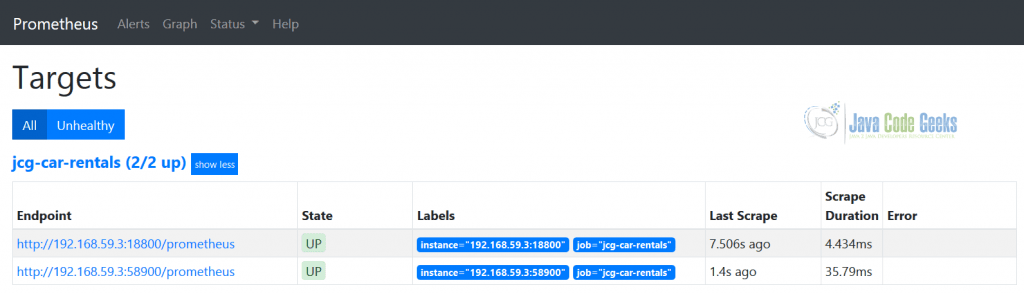
In 2016, Prometheus joined the Cloud Native Computing Foundation (CNCF). For the JCG Car Rentals platform, Prometheus is going be an obvious pick to collect, store and query metrics. In case of simple static Prometheus configuration (with static IP addresses), here is how the subset of the JCG Car Rentals platform services is shown up on the Targets web page.
6.9. Netflix Atlas
Atlas was born (and open-sourced later) at Netflix, driven by the need to cope with increased number of metrics which has to be collected by its streaming platform.
Atlas was developed by Netflix to manage dimensional time series data for near real-time operational insight. Atlas features in-memory data storage, allowing it to gather and report very large numbers of metrics, very quickly. – https://github.com/Netflix/atlas/wiki
It is a great system but please keep in mind that the choice to use in-memory data storage is one of Atlas‘s sore points and may incur additional costs.
7. Instrumentation
The choice of framework plays an important role in order to facilitate the instrumentation of the applications and services. For example, since Reservation Service is using Spring Boot, there is out of the box support for standard set of metrics for web servers and web clients, baked by Micrometer.
management:
  endpoint:
    prometheus:
      enabled: true
    metrics:
      enabled: true
  metrics:
    distribution:
      percentiles-histogram:
        http.server.requests: true
    export:
      prometheus:
        enabled: true
    web:
      client:
        max-uri-tags: 150
        requests-metric-name: http.client.requests
      server:
        auto-time-requests: true
        requests-metric-name: http.server.requests
And even more, Spring Boot comes with the handy customizers to enrich the metrics with additional configuration and metadata (labels or/and tags).
@Configuration
public class MetricsConfiguration {
    @Bean
    MeterRegistryCustomizer<MeterRegistry> metricsCommonTags(@Value("${spring.application.name}") String application) {
        return registry -> registry.config().commonTags("application", application);
    }
}
The integration with Prometheus, the monitoring choice of the JCG Car Rentals platform, is also seamless and is bundled with Micrometer.
<dependency>
    <groupId>io.micrometer</groupId>
    <artifactId>micrometer-registry-prometheus</artifactId>
</dependency>
From the other side, the Customer Service uses Dropwizard Metrics and needs a bit of customization to collect and expose the desired metrics in accordance to Prometheus protocol.
@ApplicationScoped
public class PrometheusServletProvider implements ServletContextAttributeProvider{
    @Inject private MetricsConfig metricsConfig;

    @PostConstruct
    public void init() {
        CollectorRegistry.defaultRegistry.register(new DropwizardExports(metricsConfig.getMetricRegistry()));
        DefaultExports.initialize();
    }

    @Produces
    public ServletDescriptor prometheusServlet() {
        String[] uris = new String[]{"/prometheus"};
        WebInitParam[] params = null;
        return new ServletDescriptor("Prometheus", uris, uris, 1, params, false, MetricsServlet.class);
    }

    @Override
    public Map<String, Object> getAttributes() {
        return Collections.emptyMap();
    }
}
7.1. Statsd
Outside of pure JVM-specific options, statsd would be the one worth mentioning. Essentially, it is a front-end proxy for different metric backends.
A network daemon that runs on the Node.js platform and listens for statistics, like counters and timers, sent over UDP or TCP and sends aggregates to one or more pluggable backend services (e.g., Graphite). – https://github.com/statsd/statsd
There is a large number of client implementations available, thereafter positioning statsd as a very appealing choice for polyglot microservice architectures.
7.2. OpenTelemetry
As we have seen so far, there are quite a lot of opinions on how the metrics instrumentation and collection should be done. Recently, the new industry-wide initiative has been announced under OpenTelemetry umbrella.
OpenTelemetry is made up of an integrated set of APIs and libraries as well as a collection mechanism via an agent and collector. These components are used to generate, collect, and describe telemetry about distributed systems. This data includes basic context propagation, distributed traces, metrics, and other signals in the future. OpenTelemetry is designed to make it easy to get critical telemetry data out of your services and into your backend(s) of choice. For each supported language it offers a single set of APIs, libraries, and data specifications, and developers can take advantage of whichever components they see fit. – https://opentelemetry.io/
The goals of OpenTelemetry go way beyond metrics, and we are going to talk about some of them more in the upcoming parts of the tutorial. As of now, the OpenTelemetry is available as specification draft only. But if you would like to give it a try, it is based on well-known OpenSensus project, which also includes metrics instrumentation.
7.3. JMX
For JVM applications, there is yet another way to expose real-time metrics, using Java Management Extensions (JMX). To be fair, JMX is quite old technology and you may find it awkward to use, however it is probably the simplest and fastest way to get insights about your JVM-based applications and services.
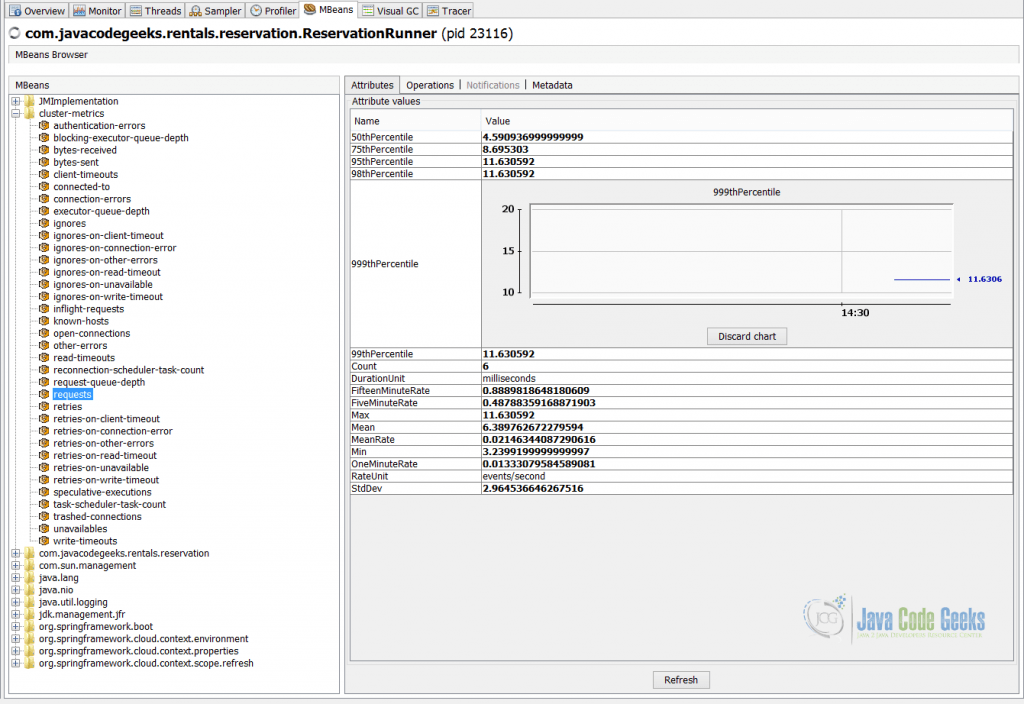
The standard way to connect to the JVM applications over JMX is to use JConsole, JVisualVM or the newest way, using JDK Mission Control (JMC). For example, the screenshot below illustrates JVisualVM in action, which visualizes the Apache Cassandra’s requests metric exposed by Reservation Service over JMX.
The metrics exposed through JMX are ephemeral and available only during the time when applications and services are up and running (to be precise, persistence is optional, non portable and is rarely used). Also, please keep in mind that the scope of JMX is not limited to metrics but management in general.
8. Visualization
As we already understood, the typical JVM application or service exposes a lot of metrics. Some of them are rarely useful whereas others are critical indicators of the application or service health. What means do we have to make this distinction obvious and, more importantly, meaningful and useful? One of the answers is visualization and construction of the real-time operational or/and business dashboards.
The monitoring and metrics management platforms like Graphite, Prometheus and InfluxDB do support quite sophisticated query languages and graphs so you may not even dig further. But in case you are looking for building state of the art dashboards or consolidating over multiple metric sources, you would need to search around.
8.1. Grafana
Undoubtedly, as of today Grafana is a one stop shop for metrics visualization and creating truly beautiful dashboards (with a large number of pre-built ones already available).
Grafana is the leading open source project for visualizing metrics. Supporting rich integration for every popular database like Graphite, Prometheus and InfluxDB. – https://grafana.com/ For JCG
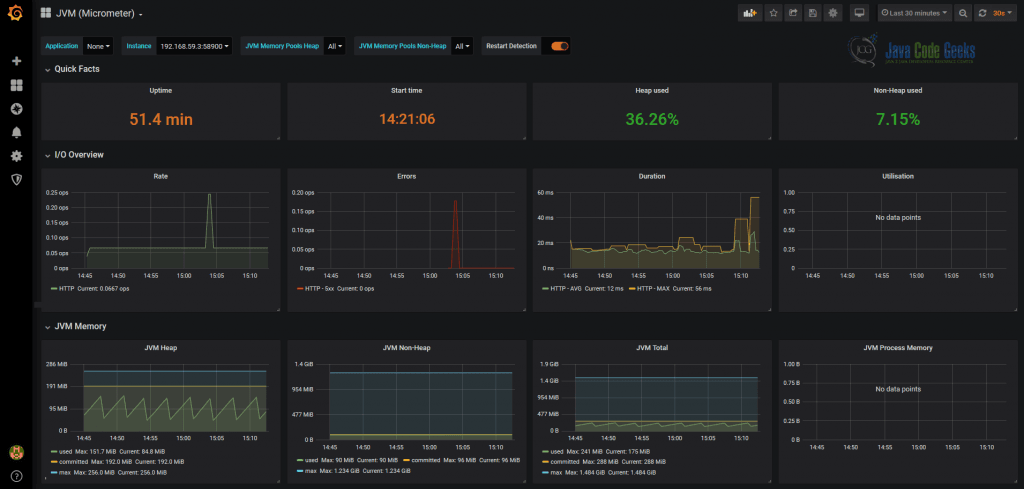
For JCG Car Rentals platform, Grafana fits exceptionally well since it has outstanding integration with Prometheus. In case of Reservation Service, which is using Micrometer library, there are a few community built dashboards to get you started quickly, one to them is shown below.
It is worth to emphasize that Grafana is highly customizable and extensible, so if you make a choice to use it as your metrics visualization platform, it is unlikely this decision is going to be regretted in the future.
9. Cloud
For the applications and services deployed in the cloud, the importance of the metrics (and alerting, more on that in the upcoming part of the tutorial) is paramount. The pattern you will discover quickly is that the metrics management comes along with the same offerings we have talked about in the previous part of the tutorial, so let us quickly glance over them.
If you are running applications, services, API gateways or functions on AWS, the Amazon CloudWatch automatically collects and tracks a large amount of metrics (as well as other operational data) on your behalf without any additional configuration (including the infrastructure). In addition, if you are looking just for a storage part, it is certainly worth exploring Amazon Timestream, a fast, scalable, fully managed time series database offering.
The Microsoft Azure’s offering for metrics collection and monitoring is a part of the Azure Monitor data platform.
Similarly to others, Google Cloud does not have standalone offering just for metrics management but bundles it along with Stackdriver Monitoring, part of a Stackdriver offering.
10. Serverless
The most significant mindset shift for serverless workloads is that the metrics related to the host systems are not your concern anymore. From the other side, you need to understand what kinds of metrics are relevant in serverless world and collect those. So what are they?
- Invocation Duration. The distribution of the function execution times (since this is what you primarily pay for).
- Invocations Count. How many times the function was invoked.
- Erroneous Invocations Count. How many times the function did not complete successfully.
Those are a good starting point however the most important metrics will be the business or application ones, intrinsic to what each function should be doing.
Most of the cloud providers collect and visualize metrics for their serverless offerings and the good news are that the popular open source serverless platforms like jazz, Apache OpenWhisk, OpenFaas, Serverless Framework come with at least basic instrumentation and expose a number of metrics out of the box as well.
11. What is the Cost?
Up to now, we have been focused on the importance of the metrics to gather the insights, oversee trends and patterns. However, we have not talked about the cost of doing that, both from storage and computational perspectives.
It is difficult to come up with the universal cost model, but there are a number of factors and trade-offs to consider. The most important ones are:
- The total number of metrics.
- The number of distinct time series which exists per particular metric.
- The backend storage (for example, keeping all data in memory is expensive, disk is much cheaper option).
- Collecting raw metrics versus pre-aggregated ones.
Another risk you might face is related to running queries and aggregations over large amount of time series. In most cases, this is very expensive operation, and it is better to plan the capacity ahead of time if you really need to support that.
As you may guess, when left adrift, things may get quite expensive.
12. Conclusions
In this part of the tutorial we have talked about metrics, another pillar of the observability. Metrics and logs constitute the absolutely required foundation for every distributed system built after microservice architecture. We have learned how applications and services are instrumented, how metrics are collected and stored, and last but not least, how they could be represented in a human-friendly way using dashboards (the alerting piece will come after).
To finish up, it would be fair to say that our focus was primarily pointed towards metrics management platforms and not analytics ones, like Apache Druid or ClickHouse, or monitoring ones, like Nagios or Hawkular (although there are some intersections here). Nonetheless please stay tuned, we are going to get back to broader monitoring and alerting subject in the last part of the tutorial.
13. What’s next
In the next part of the tutorial we are going to talk about distributed tracing.
