1. Introduction
This part of the tutorial is going to conclude the observability discussions by dissecting its last pillar, distributed tracing.
Distributed tracing, also called distributed request tracing, is a method used to profile and monitor applications, especially those built using a microservices architecture. Distributed tracing helps pinpoint where failures occur and what causes poor performance. – https://opentracing.io/docs/overview/what-is-tracing/
In distributed systems, like a typical microservice architecture, the request could travel through dozens or even hundreds of services before the response is assembled and sent back. But how are you supposed to know that? At some extent, logs are able to provide these insights, but they are inherently flat: it becomes difficult to understand the causality between calls or events, extract latencies, and reconstruct the complete path the request has taken through the system. This is exactly the case where distributed tracing comes to the rescue.
The story of the distributed tracing (as we know it these days) started in 2010, when Google published the famous paper Dapper, a Large-Scale Distributed Systems Tracing Infrastructure. Although Dapper was never open-sourced, the paper has served as an inspirational blueprint for a number of the open source and commercial projects designed after it. So let us take a closer look at distributed tracing.
Table Of Contents
2. Instrumentation + Infrastructure =
Visualization
Before we dig into the details, it is important to understand that even though distributed tracing is terrific technology, it is not magical. Essentially, it consists of three key ingredients:
- Instrumentation:
language-specific libraries which help to enrich the applications and services
with tracing capabilities. - Infrastructure:
a tracing middleware (collectors, servers, …) along with the store engine(s)
where traces are being sent, collected, persisted and become available for
querying later on. - Visualization:
the frontends for exploring, visualizing and analyzing collected traces.
What it practically means is that rolling out distributed tracing support across a microservices fleet requires not only development work but also introduces operational overhead. Essentially, it becomes yet another piece of infrastructure to manage and monitor. The good news is, it is out of the critical path, most of the instrumentation libraries are designed to be resilient against tracing middleware outages. At the end, the production flows should not be impacted anyhow, although some traces might be lost.
For many real-world applications, recording and persisting the traces for every single request could be prohibitively expensive. For example, it may introduce non-negligible overhead in the systems highly optimized for performance, or put a lot of pressure on the storage in the case of systems with very high volume of requests. To mitigate the impact and still get useful insights, different sampling techniques are widely used.
3. TCP, HTTP, gRPC, Messaging, …
One of the challenges which modern distributed tracing implementations face is the wide range of communication means employed by microservice architectures (and distributed systems in general). The context propagation strategies are quite different not only because of protocols, but communication styles as well. For example, adding tracing instrumentation for the services which use request / response communication over HTTP protocol is much more straightforward than instrumenting Apache Kafka producers and consumers or gRPC services.
The distributed tracing as a platform works across programming languages and runtime boundaries. The only language-specific pieces are the instrumentation libraries which bridge applications, services and distributed tracing platforms together. Most luckily, as it stands today, the tracing instrumentation you are looking for is already available, either from community, vendors or maintainers. However, in rare circumstances, especially when using the cutting edge technologies, you may need to roll your own.
4. OpenZipkin
Zipkin is one of the first open source projects implemented after Dapper paper by Twitter engineers. It quickly got a lot of traction and soon after changed home to OpenZipkin.
Zipkin is a distributed tracing system. It helps gather timing data needed to troubleshoot latency problems in service architectures. Features include both the collection and lookup of this data. – https://github.com/openzipkin/zipkin
By all means, Zipkin is the leading distributed tracing platform these days, with a large number of integrations available for many different languages. The JCG Car Rentals platform is going to use Zipkin to collect and query the traces across all its microservices.
Let us have a sneak-peak on typical integration flow. For example, in case of the Payment Service, which we have decided to implement in Go, we could use zipkin-go instrumentation.
reporter := httpreporter.NewReporter("http://localhost:9411/api/v2/spans"))
defer reporter.Close()

// create our local service endpoint
endpoint, err := zipkin.NewEndpoint("payment-service", "localhost:29080")
if err != nil {
    log.Fatalf("unable to create local endpoint: %+v\n", err)
}

tracer, err := zipkin.NewTracer(reporter, zipkin.WithLocalEndpoint(localEndpoint))
if err != nil {
    log.Fatalf("unable to create tracer: %+v\n", err)
}
Not only zipkin-go provides the necessary primitives, it also has outstanding instrumentation capabilities for gRPC-based services, as Payment Service is.
func Run(ctx context.Context, tracer *zipkin.Tracer) *grpc.Server {
    s := grpc.NewServer(grpc.StatsHandler(zipkingrpc.NewServerHandler(tracer)))
    payment.RegisterPaymentServiceServer(s, newPaymentServer())
    reflection.Register(s)
    return s
}
5. OpenTracing
Zipkin was among the first but the number of different distributed tracing platform inspired by its success started to grow quickly, with each one promoting own APIs. OpenTracing initiative has emerged early on as an attempt to establish the common ground among all these implementations.
OpenTracing is comprised of an API specification, frameworks and libraries that have implemented the specification, and documentation for the project. OpenTracing allows developers to add instrumentation to their application code using APIs that do not lock them into any one particular product or vendor. – https://opentracing.io/docs/overview/what-is-tracing/
Luckily, the benefits of such the effort were generally understood and as of today the list of distributed tracers which support OpenTracing includes mostly every major player.
6. Brave
Brave is one of the most widely employed tracing instrumentation library for JVM-based applications which is typically used along with OpenZipkin tracing platform.
Brave is a distributed tracing instrumentation library. Brave typically intercepts production requests to gather timing data, correlate and propagate trace contexts. – https://github.com/openzipkin/brave
The amount of instrumentations provided by Brave out of the box is very impressive. Although it could be integrated directly, many libraries and frameworks introduce the convenient abstractions on top of Brave to simplify the idiomatic instrumentation. Let us take a look what that means for different JCG Car Rentals services.
Since Reservation Service is built on top of Spring Boot, it could benefit from outstanding integration with Brave provided by Spring Cloud Sleuth.
<dependency>
    <groupId>org.springframework.cloud</groupId>
    <artifactId>spring-cloud-starter-sleuth</artifactId>
</dependency>

<dependency>
    <groupId>org.springframework.cloud</groupId>
    <artifactId>spring-cloud-starter-zipkin</artifactId>
</dependency>
Most of the integration settings could be tuned through configuration properties.
spring:
  sleuth:
    enabled: true
    sampler:
      probability: 1.0
  zipkin:
    sender:
      type: WEB
    baseUrl: http://localhost:9411
    enabled: true
From the other side, the Customer Service uses native Brave instrumentation, following Project Hammock conventions. Below is a code snippet to illustrate how it could be configured.
@ApplicationScoped
public class TracingConfig {
    @Inject
    @ConfigProperty(name = "zipkin.uri", defaultValue = "http://localhost:9411/api/v1/spans")
    private String uri;

    @Produces
    public Brave brave() {
        return new Brave.Builder("customer-service")
            .reporter(AsyncReporter.create(OkHttpSender.create(uri)))
            .traceSampler(Sampler.ALWAYS_SAMPLE)
            .build();
    }

    @Produces
    public SpanNameProvider spanNameProvider() {
        return new DefaultSpanNameProvider();
    }
}
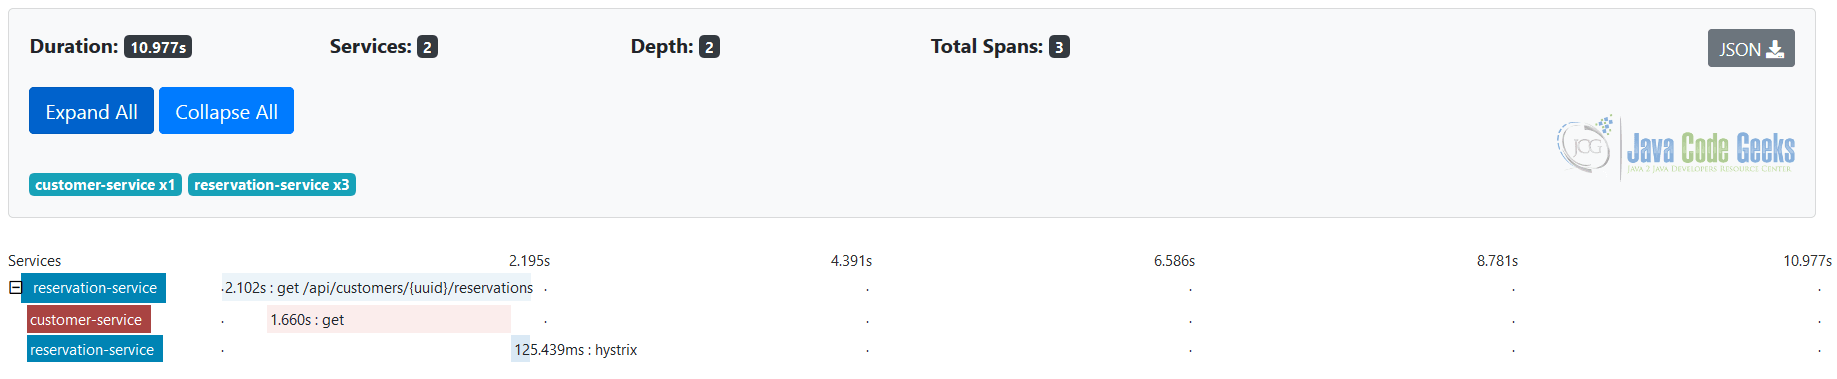
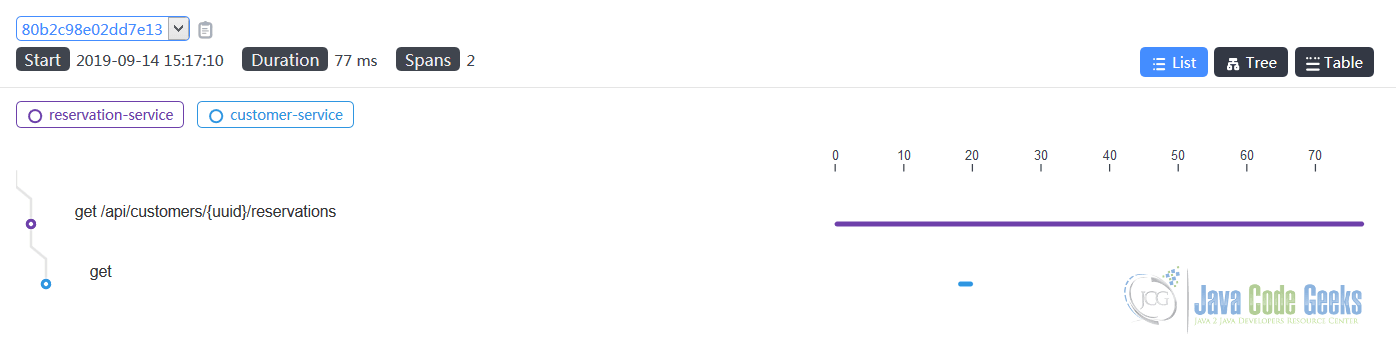
The web frontends which come as part of Zipkin server distribution allow to visualize individual traces across all participating microservices.
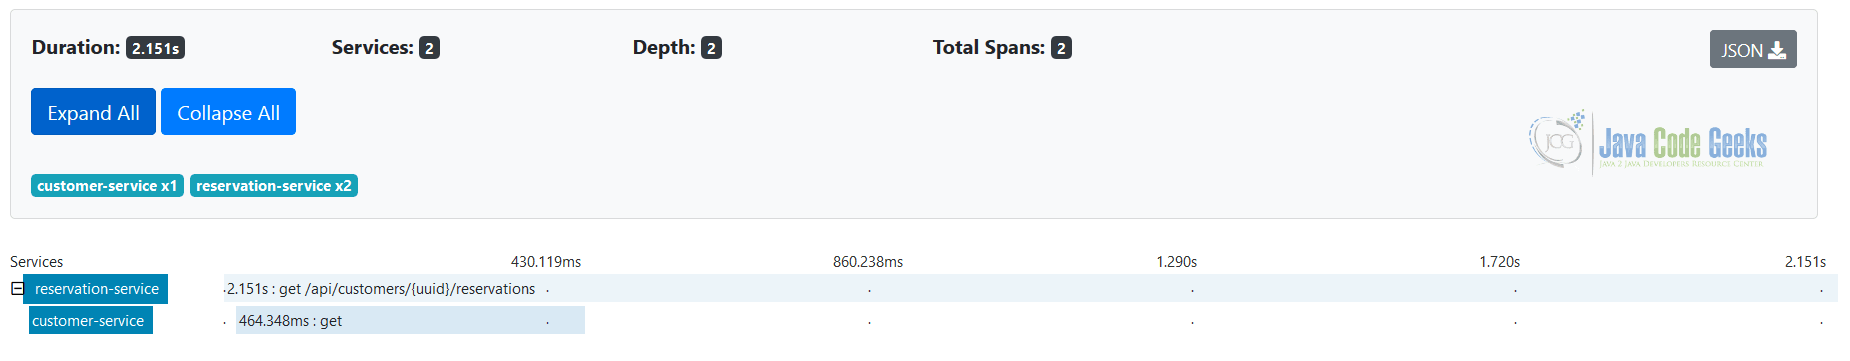
Obviously, the most useful application of distributed tracing platforms is to speed up troubleshooting and problems detection. The right visualization plays a very important role here.
Last but not least, like many other distributed tracing platforms Zipkin continues to evolve and innovate. One of the recent additions to its tooling is a new alternative web frontend called Zipkin Lens, shown on the picture below.

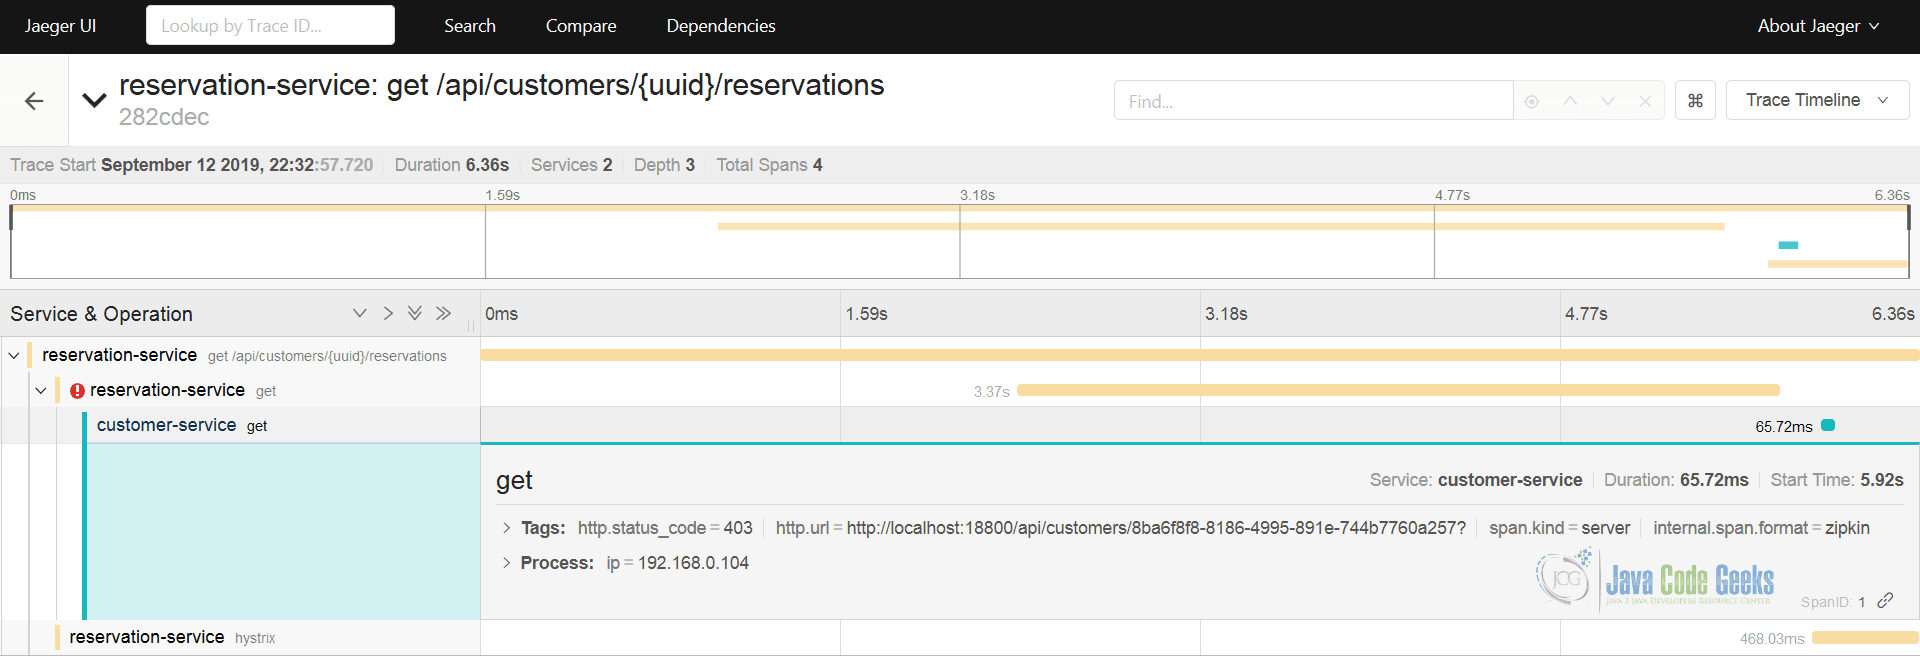
7. Jaeger
Jaeger is yet another popular distributed tracing platform which was developed at Uber and open sourced later on.
Jaeger, inspired by Dapper and OpenZipkin, is a distributed tracing system released as open source by Uber Technologies. It can be used for monitoring microservices-based distributed systems – https://github.com/jaegertracing/jaeger
Besides being hosted under the Cloud Native Computing Foundation (CNCF) umbrella, Jaeger natively supports OpenTracing specification and also provides backwards compatibility with Zipkin. What it practically means is that the instrumentation we have done for JCG Car Rentals services would seamlessly work with Jaeger tracing platform.
8. OpenSensus
OpenCensus originates from Google where it was used to automatically capture traces and metrics from the massive amount of services.
OpenCensus is a set of libraries for various languages that allow you to collect application metrics and distributed traces, then transfer the data to a backend of your choice in real time. – https://opencensus.io/
By and large, OpenCensus is an instrumentation layer only which is compatible (among many others) with Jaeger and Zipkin tracing backends.
9. OpenTelemetry
We have talked about the OpenTelemetry initiative in the previous part of the tutorial, just touching the metrics subject only. But truth to be told, OpenTelemetry is result of combining the efforts of two well-established projects, Jaeger and OpenSensus, under one umbrella, delivering a full-fledged, robust, and portable telemetry platform.
The leadership of OpenTracing and OpenCensus have come together to create OpenTelemetry, and it will supersede both projects. – https://opentelemetry.io/
As of the moment of this writing, the work around first official release of OpenTelemetry is still in progress but the early bits are on the plan to be available very soon.
10. Haystack
Haystack, born at Expedia, is an example of the distributed tracing platform which goes beyond just collecting and visualizing traces. It focuses on the analysis of the operation trends, service graphs and anomaly detection.
Haystack is an Expedia-backed open source distributed tracing project to facilitate detection and remediation of problems in microservices and websites. It combines an OpenTracing-compliant trace engine with a componentized back-end architecture designed for high resiliency and high scalability. Haystack also includes analysis tools for visualizing trace data, tracking trends in trace data, and setting alarms when trace data trends exceed limits you set. – https://expediadotcom.github.io/haystack/docs/about/introduction.html
Haystack is a modular platform, which could be used in parts or as a whole. One of the exceptionally useful and powerful components of it is Haystack UI. Even if you don’t use Haystack yet, you could use Haystack UI along with Zipkin as a drop-in replacement of its own frontend.
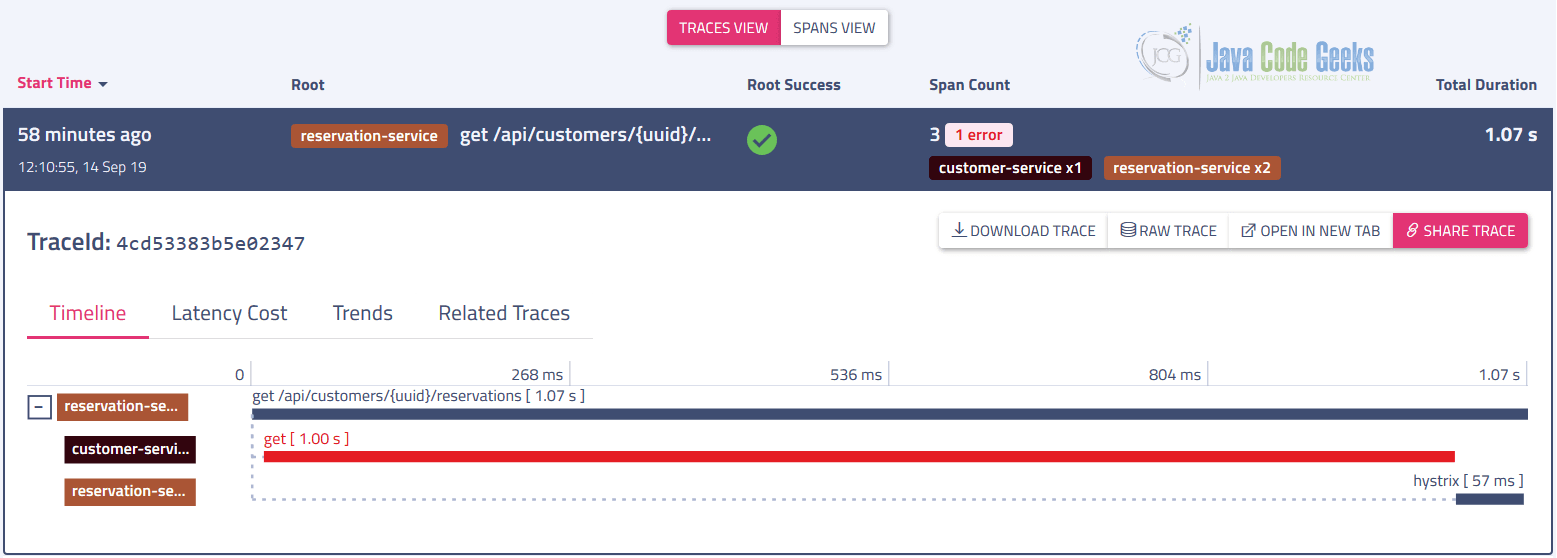
When used with Zipkin only, not all components are accessible but even in that case a lot of analytics is made available out of the box.
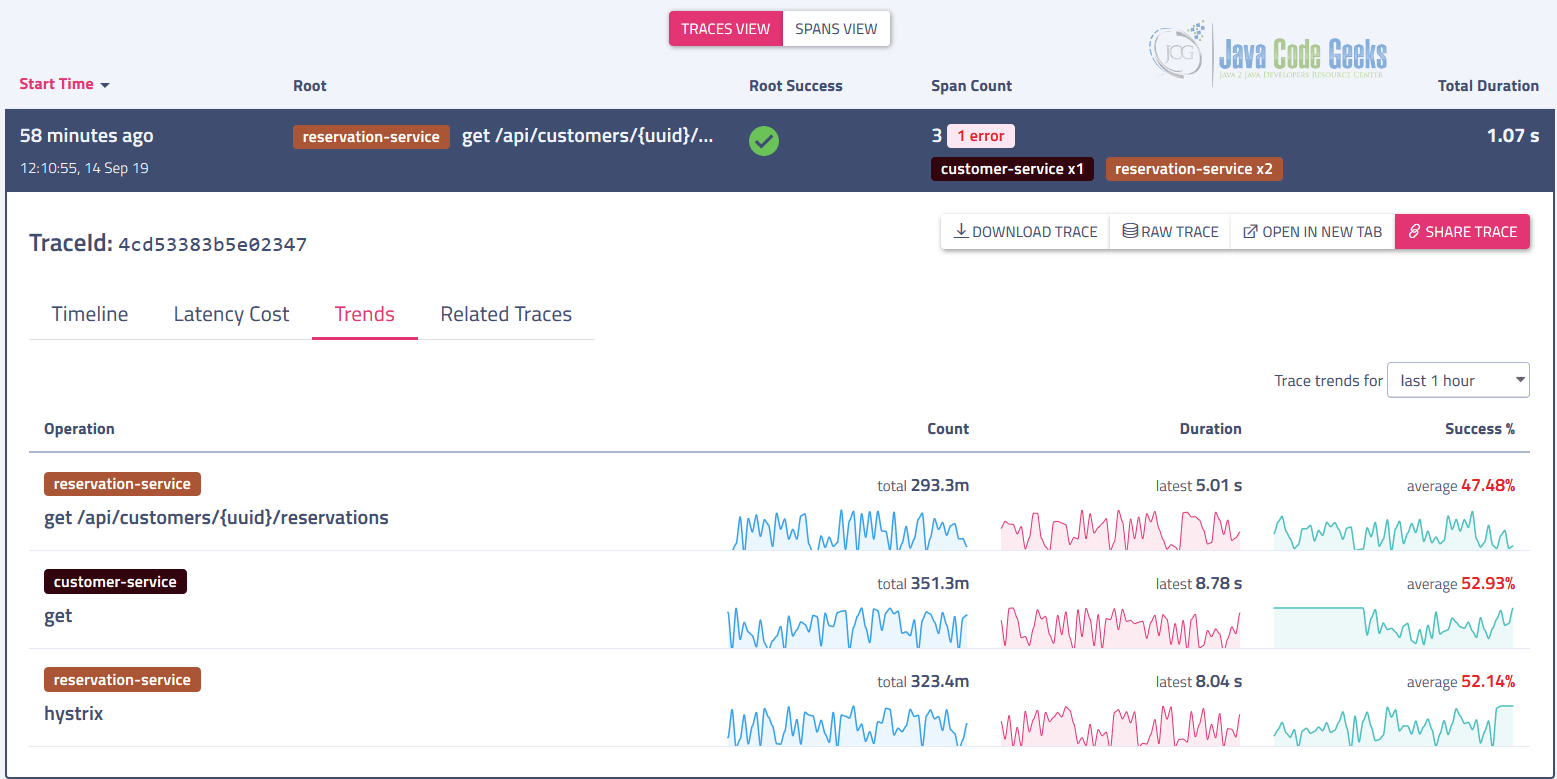
Haystack is probably the most advanced open-source distributed tracing platforms at the moment. We have seen just a small subset of what is possible yet another its feature, adaptive alerting, is going to come back in the next part of the tutorial.
11. Apache SkyWalking
Apache SkyWalking is yet another great example of the mature open-source observability platform, where distributed tracing plays a key role.
SkyWalking: an open source observability platform to collect, analyze, aggregate and visualize data from services and cloud native infrastructures. –https://github.com/apache/skywalking/blob/master/docs/en/concepts-and-designs/overview.md
It is worth noting that Apache SkyWalking instrumentation APIs are fully compliant with the OpenTracing specification. On backend level, Apache SkyWalking also supports integration with Zipkin and Jaeger, although some limitations apply.
In the case of JCG Car Rentals platform, replacing Zipkin with Apache SkyWalking is seamless and all existing instrumentations continue to functional as expected.

12. Orchestration
As we have discussed awhile back, the orchestrators and service meshes are deeply penetrating into the deployment of modern microservice architectures. Being invisible and just do the job is the mojo behind service meshes. But when things go wrong, it is critical to know if the service mesh or the orchestrator is the culprit.
Luckily, every major service mesh is built and designed with observability in mind, incorporating all three pillars: logs, metrics and distributed tracing. Istio is a true leader here and comes with Jaeger or/and Zipkin support, whereas Linkerd provides only some of the features that are often associated with distributed tracing. From the other side, Consul with Connect purely relies on Envoy’s distributed tracing capabilities and does not go beyond that.
The context propagation from the service mesh up to the individual services enables to see the complete picture of how the request travels through the system, from the moment one has entered it to the moment last byte of the response has been sent.
13. The First Mile
As you might have noticed, the distributed tracing is often narrowed to the context of backend services or server-side applications; frontends are almost entirely ignored. Such negligence certainly removes some important pieces from the puzzle since in most cases the frontends are exactly the place where most server-side interactions are being initiated. There is even a W3C specification draft called Trace Context to address this gap so why is that?
The instrumentation of the JavaScript application is provided by many distributed tracing platform, for example, OpenSensus has one, so does OpenZipkin and OpenTracing. But any of those require some pieces of distributed tracing infrastructure to be publicly available to actually collect the traces sent from the browser. Although such practices are widely accepted for analytics data for example, it still poses security and privacy concerns since quite often traces indeed may contain sensitive information.
14. Cloud
The integration of the distributed tracing in cloud-based deployments used to be a challenge but these days most of the cloud providers have dedicated offerings.
We are going to start with AWS X-Ray which provides an end-to-end view of requests as they travel through the system and shows a map of the underlying components. In general, the applications and services should use X-Ray SDKs for distributed tracing instrumentation but some platforms, like OpenZipkin or OpenSensus to name a few, have the extensions to integrate with AWS X-Ray.
In the Google Cloud, distributed tracing is fulfilled by Stackdriver Trace, the member of the Stackdriver observability suite. The language-specific SDKs provide low-level interfaces for interacting directly with the Stackdriver Trace but you have the option to make use of OpenSensus or Zipkin instead.
The distributed tracing in Microsoft Azure is backed by Application Insights, part of a larger Azure Monitor offering. It also provides the dedicated Application Insights SDKs which applications and services should integrate with to unleash distributed tracing capabilities. What comes as a surprise is that Application Insights also supports distributed tracing through OpenSensus.
As you may see, every cloud provider have an own opinion regarding distributed tracing and in most cases you have no choice as to use their SDKs. Thankfully, the leading open source distributed tracing platforms take this burden off from you by maintaining such integrations.
15. Serverless
More and more organizations are looking towards serverless computing, either to cut the costs or to accelerate the rollout of the new features or offerings. The truth is that serverless systems scream for observability, otherwise troubleshooting the issues become more like searching for a needle in the haystack. It can be quite difficult to figure out where, in a highly distributed serverless system, things went wrong, particularly in the case of cascading failures.
This is the niche where distributed tracing truly shines and is tremendously helpful. The cloud-based serverless offerings are backed by provider-specific distributed tracing instrumentations, however the open source serverless platforms are trying to catch up here. Notably, Apache OpenWhisk comes with OpenTracing integration whereas Knative is using Zipkin. For others, like OpenFaas or Serverless, you may need to instrument your functions manually at the moment.
16. Conclusions
In this part of the tutorial we have talked about the third observability pillar, distributed tracing. We have covered only the necessary minimum however there are tons of materials to read and to watch on the subject, if you are interested to learn it further.
These days, there are a lot of innovations happening in the space of the distributed tracing. The new interesting tools and integrations are in work (traces comparison, latency analysis, JFR tracing, …) and hopefully we are going to be able to use them in production very soon.
17. What’s next
In the next, the final part of the tutorial, we are going to talk about monitoring and alerting.
