1. Introduction
With this part of the tutorial we are entering the land of the observability. Sounds like another fancy buzzword, so what is that exactly?
In a distributed system, which is inherently implied by microservice architecture, there are too many moving pieces that interact and could fail in unpredictable ways.
Observability is the activities that involve measuring, collecting, and analyzing various diagnostics signals from a system. These signals may include metrics, traces, logs, events, profiles and more. – https://medium.com/observability/microservices-observability-26a8b7056bb4
As quickly as possible spot the problems, pin-point the exact place (or places) in the system where they emerged, and figure out the precise cause, these are the ultimate goals of the observability in the context relevant to the microservices. It is indeed a very difficult target to achieve and requires a compound approach.
The first pillar of the observability we are going to talk about is logging. When logs are done well, they can contain valuable (and often, invaluable) details about the state your applications or/and services are in. Logs are the primary source to tap you directly into application or/and service errors stream. Beyond that, on the infrastructure level, logs are exceptionally helpful in identifying security issues and incidents.
Unsurprisingly, we are going to focus on application and service logs. The art of logging is probably the skill we, developers, are perfecting throughout the lifetime. We know that the logs should be useful, easy to understand (more often than not it will be us or our teammates running over them) and contain enough meaningful data to reconstruct the flow and troubleshoot the issue. Logs bloat or logs shortage, both lead to waste of precious time or/and resources, finding the right balance is difficult. Moreover, the incidents related to leaking the personal data through careless logging practices are not that rare but the consequences of that are far-reaching.
The distributed nature of the microservices assumes the presence of many services, managed by different teams, very likely implemented using different frameworks, and running on different runtimes and platforms. It leads to proliferation of log formats and practices but despite that, you have to be able to consolidate all logs in a central searchable place and be able to correlate the events and flows across the microservice and infrastructure boundaries. It sounds like impossible task, isn’t it? Although it is certainly impossible to cover every single logging framework or library out there, there is a core set of principles to start with.
Table Of Contents
2. Structured or Unstructured?
It is unrealistic to come up and enforce the universally applicable format for logs since every single application or service is just doing different things. The general debate however unfolds around structured versus unstructured logging.
To understand what the debate is about, let us take a look at how the typical Spring Boot application does logging, using Reservation Service, part of the JCG Car Rentals platform, as an example.
...
2019-07-27 14:13:34.080  INFO 15052 --- [           main] o.c.cassandra.migration.MigrationTask    : Keyspace rentals is already up to date at version 1
2019-07-27 14:13:34.927  INFO 15052 --- [           main] d.s.w.p.DocumentationPluginsBootstrapper : Documentation plugins bootstrapped
2019-07-27 14:13:34.932  INFO 15052 --- [           main] d.s.w.p.DocumentationPluginsBootstrapper : Found 1 custom documentation plugin(s)
2019-07-27 14:13:34.971  INFO 15052 --- [           main] s.d.s.w.s.ApiListingReferenceScanner     : Scanning for api listing references
2019-07-27 14:13:35.184  INFO 15052 --- [           main] o.s.b.web.embedded.netty.NettyWebServer  : Netty started on port(s): 18900
...
As you may notice, the logging output follows some pattern, but in general, it is just a just a freestyle text which becomes much more interesting when exceptions come to the picture.
2019-07-27 14:30:08.809  WARN 12824 --- [nfoReplicator-0] com.netflix.discovery.DiscoveryClient    : DiscoveryClient_RESERVATION-SERVICE/********:reservation-service:18900 - registration failed Cannot execute request on any known server

com.netflix.discovery.shared.transport.TransportException: Cannot execute request on any known server
	at com.netflix.discovery.shared.transport.decorator.RetryableEurekaHttpClient.execute(RetryableEurekaHttpClient.java:112) ~[eureka-client-1.9.12.jar:1.9.12]
	at com.netflix.discovery.shared.transport.decorator.EurekaHttpClientDecorator.register(EurekaHttpClientDecorator.java:56) ~[eureka-client-1.9.12.jar:1.9.12]
	at com.netflix.discovery.shared.transport.decorator.EurekaHttpClientDecorator$1.execute(EurekaHttpClientDecorator.java:59) ~[eureka-client-1.9.12.jar:1.9.12]
...
Extracting meaningful data out of such logs is not fun. Essentially, you have to parse and pattern-match every single log statement, determine if it is single or multiline, extract timestamps, log levels, thread names, key/value pairs, as so on. It is feasible in general but also time-consuming, computationally heavy, fragile and difficult to maintain. Let us compare that with the structured logging where the format is more or less standard (let say, JSON) but the set of fields may (and in reality will) differ.
{"@timestamp":"2019-07-27T22:12:19.762-04:00","@version":"1","message":"Keyspace rentals is already up to date at version 1","logger_name":"org.cognitor.cassandra.migration.MigrationTask","thread_name":"main","level":"INFO","level_value":20000}
{"@timestamp":"2019-07-27T22:12:20.545-04:00","@version":"1","message":"Documentation plugins bootstrapped","logger_name":"springfox.documentation.spring.web.plugins.DocumentationPluginsBootstrapper","thread_name":"main","level":"INFO","level_value":20000}
{"@timestamp":"2019-07-27T22:12:20.550-04:00","@version":"1","message":"Found 1 custom documentation plugin(s)","logger_name":"springfox.documentation.spring.web.plugins.DocumentationPluginsBootstrapper","thread_name":"main","level":"INFO","level_value":20000}
{"@timestamp":"2019-07-27T22:12:20.588-04:00","@version":"1","message":"Scanning for api listing references","logger_name":"springfox.documentation.spring.web.scanners.ApiListingReferenceScanner","thread_name":"main","level":"INFO","level_value":20000}
{"@timestamp":"2019-07-27T22:12:20.800-04:00","@version":"1","message":"Netty started on port(s): 18900","logger_name":"org.springframework.boot.web.embedded.netty.NettyWebServer","thread_name":"main","level":"INFO","level_value":20000}
Those are the same logs represented in a structural way. From the indexing and analysis perspective, dealing with such structured data is significantly easier and more convenient. Please consider to favor the structuring logging by your microservices fleet, it will certainly pay off.
3. Logging in Containers
The next question after settling on logs format is where these logs should be written to. To find the right answer, we may turn back to The Twelve-Factor App principles.
A twelve-factor app never concerns itself with routing or storage of its output stream. It should not attempt to write to or manage logfiles. Instead, each running process writes its event stream, unbuffered, to
stdout. During local development, the developer will view this stream in the foreground of their terminal to observe the app’s behavior. – https://12factor.net/logs
Since all of JCG Car Rentals microservices are running within the containers, they should not be concerned with how to write or store the logs but rather stream them to stdout/stderr. The execution/runtime environment is to make a call on how to capture and route the logs. Needless to say that such model is well supported by all container orchestrators (f.e. docker logs, kubectl logs, …). On the side note, dealing with multiline log statements is going to be a challenge.
It worth to mention that in certain cases you may encounter the application or service which writes its logs to a log file rather than stdout/stderr. Please keep in mind that since the container filesystem is ephemeral, you will have to either configure a persistent volume or forward logs to a remote endpoint using data shippers, to prevent the logs being lost forever.
4. Centralized Log Management
So far we have talked about the easy parts. The next one, probably the most important out of all, is logs management and consolidation.
4.1 Elastic Stack (formerly ELK)
The first option we are going to talk about is what is used to be known as ELK. It is an acronym which stands for three open source projects: Elasticsearch, Logstash, and Kibana.
Elasticsearch is a distributed, RESTful search and analytics engine capable of addressing a growing number of use cases. As the heart of the Elastic Stack, it centrally stores your data so you can discover the expected and uncover the unexpected. – https://www.elastic.co/products/elasticsearch
Logstash is an open source, server-side data processing pipeline that ingests data from a multitude of sources simultaneously, transforms it, and then sends it to your favorite “stash.” – https://www.elastic.co/products/logstash
Kibana lets you visualize your Elasticsearch data and navigate the Elastic Stack so you can do anything from tracking query load to understanding the way requests flow through your apps. – https://www.elastic.co/products/kibana
ELK has gained immense popularity in the community since it provided a complete end-to-end pipeline for logs management and aggregation. The Elastic Stack is the next evolution of the ELK which also includes another open source project, Beats.
Beats is the platform for single-purpose data shippers. They send data from hundreds or thousands of machines and systems to Logstash or Elasticsearch. – https://www.elastic.co/products/beats
The Elastic Stack (or its predecessor ELK) is the number one choice if you are considering to own your logs management infrastructure. But be aware that from the operational perspective, keeping your Elasticsearch clusters up and running might be challenging.
The JCG Car Rentals platform uses Elastic Stack to consolidate logs across all services. Luckily, it is very easy to ship structured logs to Logstash using, for example, Logback and Logstash Logback Encoder. The logback.xml configuration snippet is shown below.
<configuration>
    <include resource="org/springframework/boot/logging/logback/base.xml"/>

    <appender name="logstash" class="net.logstash.logback.appender.LogstashTcpSocketAppender">
        <destination>logstash:4560</destination>
        <encoder class="net.logstash.logback.encoder.LogstashEncoder" />
    </appender>

    <root level="INFO">
        <appender-ref ref="CONSOLE" />
        <appender-ref ref="logstash" />
    </root>
</configuration>
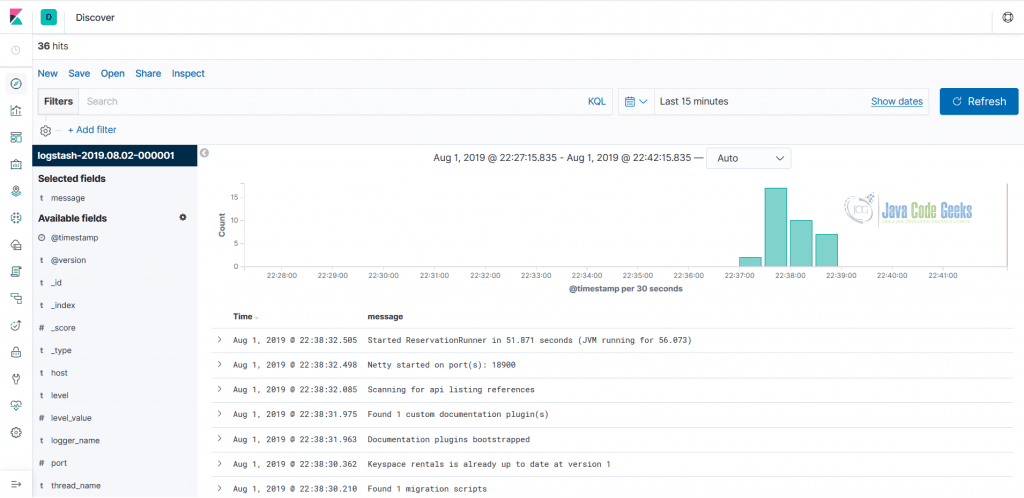
The logs become immediately available for searching and Kibana is a literally one-stop shop to do quite complex analysis or querying over them.
Alternatively, you may just write logs to stdout/stderr using Logstash Logback Encoder and just tail the output to the Logstash.
4.2 Graylog
Graylog is yet another centralized open source log management solution which is built on top of the Elasticsearch and MongoDB.
Graylog is a leading centralized log management solution built to open standards for capturing, storing, and enabling real-time analysis of terabytes of machine data. We deliver a better user experience by making analysis ridiculously fast, efficient, cost-effective, and flexible. – https://www.graylog.org/
One of the key differences compared to Elastic Stack is that Graylog can receive structured logs (in GELF format) directly from an application or service over the network (mostly every logging framework or library is supported).
4.3 GoAccess
GoAccess is an open source solution which is tailored for analyzing the logs from the web servers in the real-time.
GoAccess is an open source real-time web log analyzer and interactive viewer that runs in a terminal in *nix systems or through your browser. – https://goaccess.io/
It is not a full-fledged log management offering but it has really unique set of capabilities which might be well aligned with your operational needs.
4.4 Grafana Loki
Loki by Grafana Labs is certainly a newcomer to the space of open source log management, with announcement being made at the end of 2018, less than a year ago.
Loki is a horizontally-scalable, highly-available, multi-tenant log aggregation system inspired by Prometheus. It is designed to be very cost effective and easy to operate. It does not index the contents of the logs, but rather a set of labels for each log stream. – https://github.com/grafana/loki
Loki has a goal to stay as lightweight as possible, thus the indexing and crunching of logs is deliberately left out of scope. It comes with the first class Kubernetes support but please make a note that Loki is currently in alpha stage and is not recommended to be used in production just yet.
5. Log Shipping
Let us switch gears a bit from the complete off the shelf log management solutions to log data collectors and shippers. Their role is to detach the source log streams from the underlying backend systems by sitting in between. Logstash and Beats, part of the Elastic Stack, are great example of those.

5.1. Fluentd
Fluentd is widely used open source data collector which is now a member of the Cloud Native Computing Foundation (CNCF).
Fluentdis an open source data collector, which lets you unify the data collection and consumption for a better use and understanding of data. – https://www.fluentd.org/
One of the benefits of being CNCF member is the opportunity to closely integrate with Kubernetes and Fluentd undoubtedly shines there. It is often used as the log shipper in Kubernetes deployments.
5.2. Apache Flume
Apache Flume is probably one of oldest open source log data collectors and aggregators.
Flume is a distributed, reliable, and available system for efficiently collecting, aggregating and moving large amounts of log data from many different sources to a centralized data store. – https://flume.apache.org/index.html
5.3 rsyslog
rsyslog is a powerful, modular, secure and high-performance log processing system. It accepts data from variety of sources (system or application), optionally transforms it and outputs to diverse destinations. The great thing about rsyslog is that it comes preinstalled on most Linux distributions so basically you get it for free in mostly any container.
6. Cloud
The leading cloud providers have quite different approaches with respect to centralized logging. As we are going to see, some do have dedicated offerings whereas others include log management as part of the larger ones.
6.1 Google Cloud
Google Cloud has probably one of the best real-time log management and analysis tooling out there, called Stackdriver Logging, part of the Stackdriver offering.
Stackdriver Logging allows you to store, search, analyze, monitor, and alert on log data and events from Google Cloud Platform and Amazon Web Services (AWS). Our API also allows ingestion of any custom log data from any source. Stackdriver Logging is a fully managed service that performs at scale and can ingest application and system log data from thousands of VMs. Even better, you can analyze all that log data in real time. – https://cloud.google.com/logging/
The AWS integration comes as a pleasant surprise but it is actually powered by the customized distribution of the Fluentd.
6.2 AWS
In the center of the AWS logs management offering is CloudWatch Logs.
CloudWatch Logs enables you to centralize the logs from all of your systems, applications, and AWS services that you use, in a single, highly scalable service. You can then easily view them, search them for specific error codes or patterns, filter them based on specific fields, or archive them securely for future analysis. – https://docs.aws.amazon.com/AmazonCloudWatch/latest/logs/WhatIsCloudWatchLogs.html
Besides CloudWatch Logs, AWS also brings a use case of the centralized logging solution implementation, backed by Amazon Elasticsearch Service.
AWS offers a centralized logging solution for collecting, analyzing, and displaying logs on AWS across multiple accounts and AWS Regions. The solution uses Amazon Elasticsearch Service (Amazon ES), a managed service that simplifies the deployment, operation, and scaling of Elasticsearch clusters in the AWS Cloud, as well as Kibana, an analytics and visualization platform that is integrated with Amazon ES. In combination with other AWS managed services, this solution offers customers a customizable, multi-account environment to begin logging and analyzing their AWS environment and applications. – https://aws.amazon.com/solutions/centralized-logging/
6.3 Microsoft Azure
The Microsoft Azure’s dedicated offering for managing logs went through a couple of incarnations and as of today is a part of Azure Monitor.
Azure Monitor logs is the central analytics platform for monitoring, management, security, application, and all other log types in Azure. – https://azure.microsoft.com/en-ca/blog/azure-monitor-is-providing-a-unified-logs-experience/
7. Serverless
It is interesting to think about subtleties of logging in the context of the serverless. At first, it is not much different, right? The evil is in details: careless logging instrumentation may considerably impact the execution time, as such directly influencing the cost. Please keep it in mind.
8. Microservices: Log Management – Conclusions
In this section of the tutorial we have started to talk about observability pillars, taking off from logs. The times when tailing a single log file was enough are long gone. Instead, the microservice architecture brings the challenge of logs centralization and consolidation from many different origins. Arguably, logs are still the primary source of the information to troubleshoot problems and issues in the software systems, but there are other powerful means to complement them.
The friendly reminder that along the whole tutorial we are focusing on free and open-source offerings but the market of the commercial log management solutions is just huge. Many organizations prefer to offload log management to SaaS vendors and just pay for it.
9. What’s next
In the next section of the tutorial we are going to continue our discussion about observability, this time focusing on metrics.
