A self-sufficient system is a system capable of healing and adaptation. Healing means that the cluster will always be in the designed state. As an example, if a replica of a service goes down, the system needs to bring it back up again. Adaptation, on the other hand, is about modifications of the desired state so that the system can deal with changed conditions. A simple example would be increased traffic. When it happens, services need to be scaled up. When healing and adaptation are automated, we get self-healing and self-adaptation. Together, they both a self-sufficient system that can operate without human intervention.
How does a self-sufficient system look? What are its principal parts? Who are the actors?
We’ll limit the scope of the discussion to services and ignore the fact that hardware is equally important. With such a limitation in mind, we’ll paint a high-level picture that describes a (mostly) autonomous system from the services point of view. We’ll elevate ourselves from the details and have a birds-view of the system.
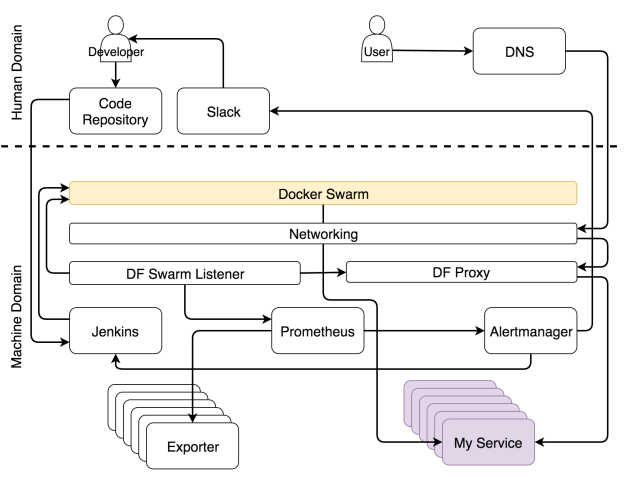
In case you are know-it-all type of person and want to see everything at once, the system is summarized in the figure 10-1.
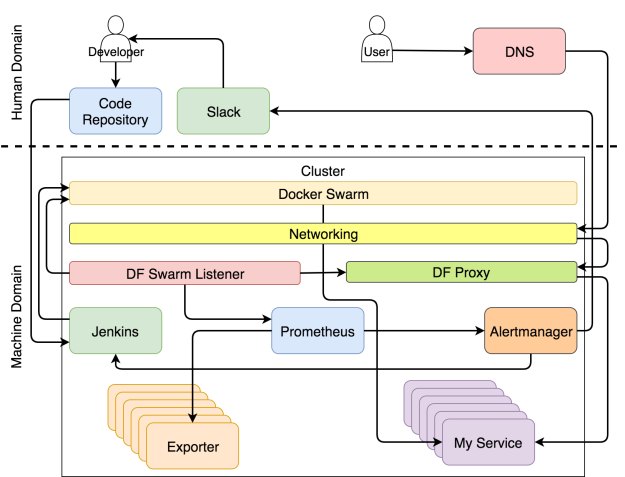
A diagram like that one is probably too much to process at once. Throwing it into your face might make you think that empathy is not one of my strengths. If that’s the case, you’re not alone. My wife shares that impression even without any diagrams. This time I’ll do my best to change your opinion and start over with a blank slate.
We can separate the system into two major domains; human and machine. Think of them as Matrix. If you haven’t seen the movie, stop reading the book right away, make some popcorn, and watch it.
In Matrix, the world is overtaken by machines. Humans don’t do much except the few that realized what’s going on. Most are living in a dream that reflects past events of human history. They are physically in the present, but their minds are in the past. The same situation can be observed with modern clusters. Most people still operate them as if it’s 1999. Almost everything is manual, the processes are cumbersome, and the system is surviving due to a brute force and wasted energy. Some understood that the year is 2017 (at least at the time of this writing) and that a well-designed system is a system that does most of the work autonomously. Almost everything is run by machines, not human operators.
That does not mean that there is no place for us (humans). There is, but it is more related to creative and non-repetitive tasks. Therefore, if we focus only on cluster operations, the human domain is shrinking and being taken over by the machine domain.
The system can be divided into different roles. As you will see, a tool or a person can be very specialized and perform only a single role, or it can be in charge of multiple aspects of the operations.
Developer’s Role In The System
The human domain consists of processes and tools that are operated manually. We are trying to move away from that domain all the actions that are repeatable. That does not mean that the goal is for that domain to disappear. Quite the contrary. By pushing repetitive tasks away from it, we are freeing ourselves from mundane tasks and increasing the time we spend with those that bring real value. The less we do the tasks that can be delegated to machines, the more time we can spend with those that require creativity. This philosophy is in line with strengths and weaknesses or each actor in this drama. Machines are good at crunching numbers. They know how to execute predefined operations very fast. They are much better and more reliable at that than us. Unlike machines, we are capable of critical thinking. We can be creative. We can program those machines. We can tell them what to do and when.
I designated a developer as the leading actor of a human domain. I intentionally avoided using the word coder. A developer is everyone working on a software development project. It does not matter whether you’re a coder, a tester, an operations guru, or a scrum master. I’m putting you all in the group labeled as developer. The result of your work is to push something to a code repository. Until it gets there, it’s as if it does not exist. It does not matter whether it sits on your laptop, in a notebook, on your desk, or on a tiny piece of paper attached to a pigeon messenger. From the point of view of the system, it does not exist until it gets into a code repository. That repository is hopefully Git but, for the sake of argument, it can be any other place where you can store and version something.
That code repository is also part of the human domain. Even though it is a piece of software, it belongs to us. We operate it. We are pushing commits, pulling code, merging, and, sometimes, staring at it out of despair produced by too many merge conflicts. That does not mean that it does not have automated operations, nor that some parts of the machine domain are not operating it without any human involvement. Still, as long as something is mostly hands-on, we’ll consider it being part of the human domain. Code repository definitely qualifies as a piece of the system that requires a lot of human intervention.
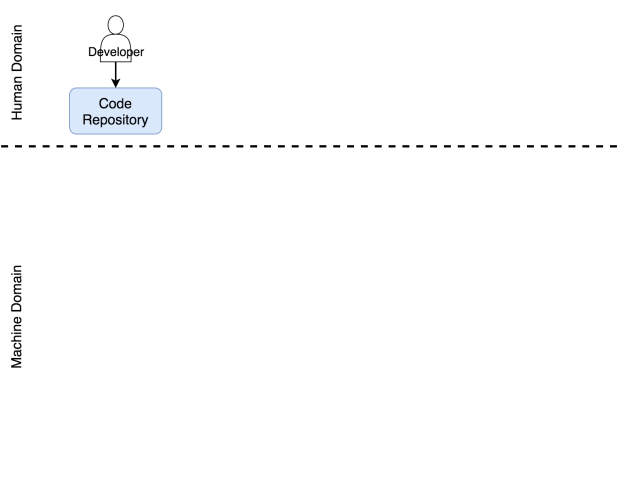
Let’s see what happens when a commit is pushed to a code repository.
Continuous Deployment Role In The System
The continuous deployment process is fully automated. No exceptions. If your pipeline is not automated, it is not continuous deployment. You might require a manual action to deploy to production. If that action consists of pressing a single button that says, in bold letters, deploy, your process is continuous delivery. I can accept that. There might be business reasons for having such a button. Still, the level of automation is the same as with continuous deployment. You are only a decision maker. If there are any other manual operations, you are either doing continuous integration or, more likely, something that should not have a word continuous in its name.
No matter whether it is continuous deployment or delivery, the process is fully automated. You are excused from having manual parts of the process only if your system is a legacy system that your organization choose not to touch (typically a Cobol application). It just sits on top of a server and does something. I’m very fond of “nobody knows what it does, do not touch it” type of rules. It is a way to show utmost respect while still keeping the safe distance. However, I will assume that’s not your case. You want to touch it. The desire is burning within you. If that’s not the case and you are unfortunate enough to work on one of those stay-away-from-it types of systems, you are reading the wrong book, and I’m surprised you did not realize that yourself.
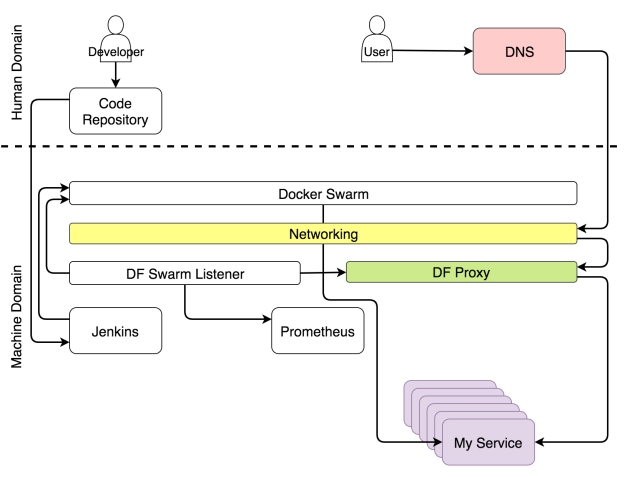
Once a code repository receives a commit or a pull request, it triggers a Web hook that sends a request to a CD tool which initiates the continuous deployment process. In our case, that tool is Jenkins. The request starts a build of the pipeline that performs all sorts of continuous deployment tasks. It checks out the code and runs unit tests. It builds an image and pushes it to a registry. It runs functional, integration, performance, and other types of tests that require a live service. The very end of the process (excluding production tests) is a request to a scheduler to deploy or update the service in the production cluster. Our choice for a scheduler is Docker Swarm.
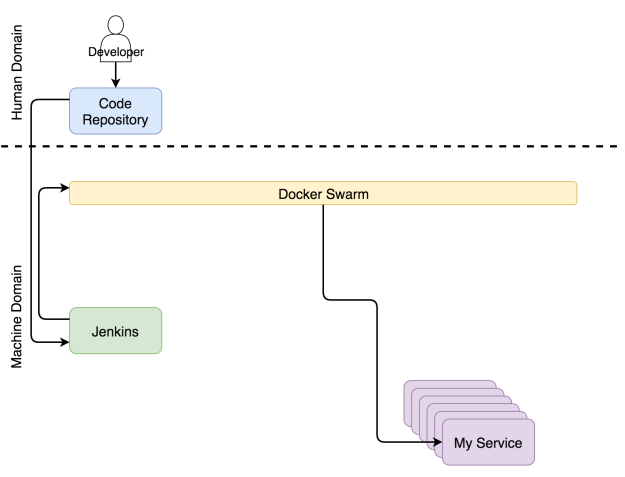
In parallel with continuous deployment, another set of processes is running and trying to keep the configurations of the system up-to-date.
Service Configuration Role In The System
Parts of the system needs to be reconfigured whenever any aspect of the cluster changes. A proxy might need an update of its configuration, metrics collector might require new targets, logs parser might need an update its rules.
No matter which parts of the system require changes, those changes need to be applied automatically. Hardly anyone disputes that. The bigger question is where to find those pieces of information that should be incorporated into the system. The most optimum place is in the service itself. Since almost all schedulers use Docker, the most logical place for the information about a service is inside it, in the form of labels. Setting the information anywhere else would prevent us from having a single source of truth and would make auto-discovery a hard thing to accomplish.
Having information about a service inside it does not mean that the same information should not reside in other places inside the cluster. It should. However, the service is where master information must be and, from there on, it should be propagated towards other services. Docker makes that very easy. It already has an API that anyone can hook into and discover any information about any service.
The choice of a tool that discovers service information and propagates it to the rest of the system is Docker Flow Swarm Listener (DFSL). You might choose something else or build your own solution. The goal of such a tool, and Docker Flow Swarm Listener in particular, is to listen to Docker Swarm events. If a service contains a specific set of labels, the listener will fetch the information as soon as a service is deployed or updated and pass it to all interested parties. In this case, that is Docker Flow Proxy (DFP) (with HAProxy inside) and Docker Flow Monitor (DFM) (with Prometheus inside). As a result, both are having configurations that are always up-to-date. The proxy has the routes of all the publicly available services while Prometheus has the information about the exporters, alerts, the address of Alertmanager, and quite a few other things.
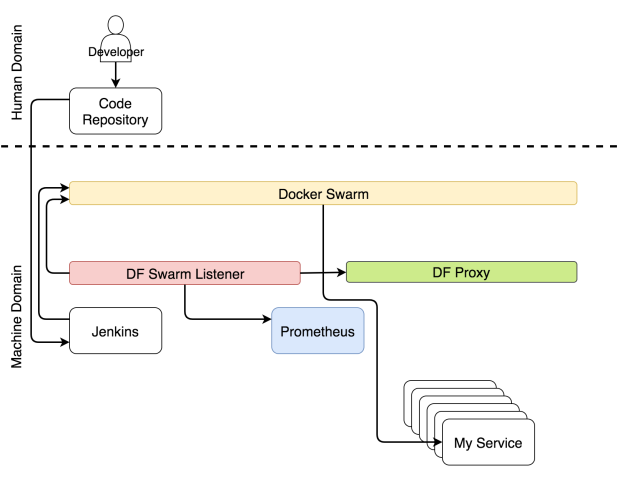
While deployments and reconfigurations are going on, users must be able to access our services without downtime.
Proxy Role In The System
Every cluster needs a proxy that will receive requests coming to a single port and forward them to destination services. The only exception is when we have only one public-facing service. In that case, it is questionable not only whether we need a proxy but whether we need a cluster at all.
When a request comes to the proxy, it is evaluated and, depending on its path, domain, or a few other headers, forwarded to one of the services.
Docker made quite a few aspects of proxies obsolete. There is no reason for load balancing. Docker’s Overlay network does for us. There’s no need to maintain IPs of the nodes where services are hosted. Service discovery does that for us. Evaluation of headers and forwarding is pretty much everything that a proxy should do.
Since Docker Swarm utilizes rolling updates whenever an aspect of a service is changed, the continuous deployment (CD) process should not produce any downtime. For that statement to be true, a few requirements need to be fulfilled. Among others, a service needs to run at least two replicas, preferably more. Otherwise, any update of a service with a single replica will, unavoidably, create downtime. It does not matter whether that is a minute, a second, or a millisecond.
Downtime is not always disastrous. It all depends on the type of a service. If Prometheus is updated to a newer release, there will be downtime since it cannot scale. But, it is not a public facing service unless you count a few operators. A few seconds of downtime is not a big deal.
A public facing service like an online retail store where thousands or even millions of users are shopping can quickly lose good reputation if it goes down. We are so spoiled as consumers that a single glitch can change our mind and make us go to the competition. If that “glitch” is repeated over and over, loss of business is almost guaranteed. Continuous deployment has many advantages but, since it is executed fairly often, it also amplifies potential deployment problems, downtime being one of them. One second downtime produced many times a day is, indeed, not acceptable.
The good news is that rolling updates combined with multiple replicas will allow us to avoid downtime, as long as the proxy is always up-to-date.
The combination of rolling updates with a proxy that dynamically reconfigures itself results in a situation where a user can send a request to a service at any time without being affected by continuous deployment, failures, and other changes to the state of the cluster.
When a user sends a request to a domain, that request enters a cluster through any of the healthy nodes and is taken over by Docker’s Ingress network. The network, in turn, detects that a request uses a port published by the proxy and forwards it. The proxy, on the other hand, evaluates the path, domain, or some other aspect of the request and forwards it to the destination service.
We’re using Docker Flow Proxy (DFP) that adds the required level of dynamism on top of HAProxy.
The next role we’ll discuss is about collecting metrics.
Metrics Role In The System
The crucial part of any cluster, especially those that are aiming towards self-adaptation, is data. Hardly anyone will dispute the need to have the past and present metrics. Without them, we’d run like a headless chicken when things go wrong. The central question is not whether they are required but what we do with them. Traditionally, operators would spend endless hours watching dashboards. That is far from efficient. Watch Netflix instead. It is, at least, more entertaining. The system should use metrics. The system generates them, it collects them, and it should decide what actions to perform when they reach some thresholds. Only then, the system can be self-adaptive. Only when it acts without human intervention can it be self-sufficient.
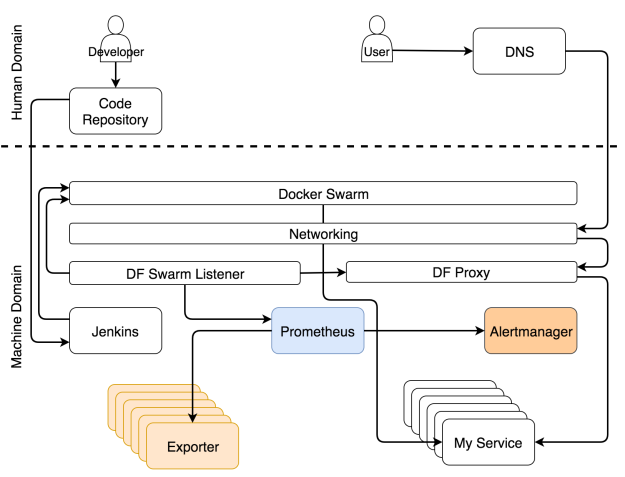
A system that implements self-adaptation needs to collect data, store them, and act upon them. I will skip the discussion of pros and cons between pushing and scraping data. Since we chose to use Prometheus as a place where data is stored and evaluated and as the service that generates and fires alerts, the choice is to scrape data. That data is available in the form of exporters. They can be generic (e.g. Node Exporter, cAdvisor, and so on), or specific to a service. In the latter case, services must expose metrics in a simple format Prometheus expects.
Independently of the flows we described earlier, exporters are exposing different types of metrics. Prometheus periodically scrapes them and stores them in its database. In parallel with scraping, Prometheus is continuously evaluating the thresholds set by alerts and, if any of them is reached, it is propagated to Alertmanager. Under most circumstances, those limits are reached as a result of changed conditions (e.g. increased load on the system).
Alert receivers are what makes the difference.
Alerting Role In The System
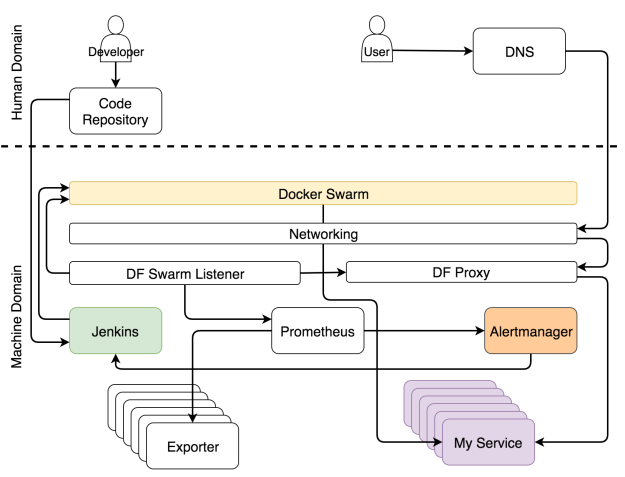
The alerts are split into two general groups depending on alert receivers. It can be forwarded to the system or to humans. When an alert qualifies as the type that should be sent to the system, a request is usually forwarded to a service that is capable of evaluating the situation and executing tasks that will adapt the system. In our case, that service is Jenkins which executes one of the predefined jobs.
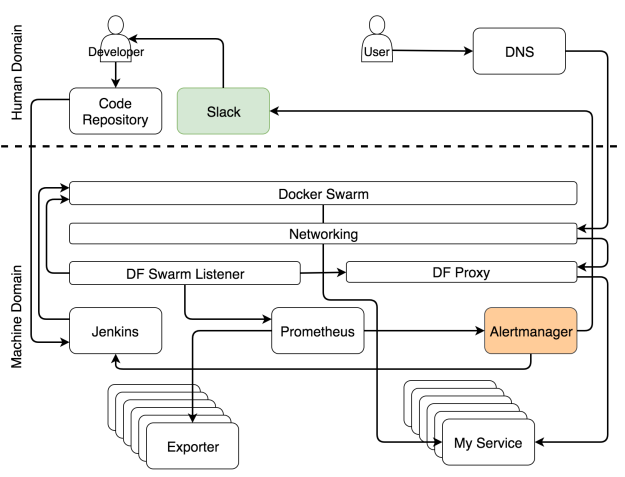
The most common set of tasks Jenkins performs is to scale (or de-scale) a service. However, before it attempts to scale, it needs to discover the current number of replicas and compare it with the upper and lower limits we set through service labels. If scaling would result in a number of replicas that is outside those boundaries, it sends a notification to Slack so that a human can decide what should be the correct set of actions to will remedy the problem. On the other hand, when scaling would keep the number of replicas within the limits, Jenkins sends a request to one of Swarm managers which, in turn, increases (or decreases) the number of replicas of a service. We’re calling the process self-adaptation because the system is adapting to changed conditions without human intervention.
Even though the goal is to make the system fully autonomous, it is almost sure that in some cases human intervention is needed. The cases are, in their essence, those that could not be predicted. When something expected happens, let the system fix it. On the other hand, call humans when unexpected occurs. In those cases, Alertmanager sends a message to the human domain. In our case, that is a Slack message, but it could be any other communication service.
When you start designing a self-healing system, most of the alerts will fall into the “unexpected” category. You cannot predict all the situations that can happen to the system. What you can do is make sure that each of those cases is unexpected only once. When you receive an alert, your first set of tasks should be to adapt the system manually. The second, and equally important, group of actions would be to improve the rules in Alertmanager and Jenkins so that the next time the same thing happens, the system can handle it automatically.
Setting up a self-adapting system is hard, and it is something that never truly ends. It will need continuous improvements. How about self-healing? Is that equally hard to accomplish?
Scheduler Role In The System
Unlike self-adaptation, self-healing is relatively easy to accomplish. As long as there are available resources, a scheduler will make sure that the specified number of replicas is always running. In our case, that scheduler is Docker Swarm.
Replicas can fail, they can be killed, and they can reside inside an unhealthy node. It does not really matter since Swarm will make sure that they are rescheduled when needed and (almost) always up-and-running. If all our services are scalable and we are running at least a few replicas of each, there will never be downtime. Self-healing processes inside Docker will make sure of that while our own self-adaptation processes aim to provide high-availability. The combination of the two is what makes the system almost fully autonomous and self-sufficient.
Problems begin piling up when a service is not scalable. If we cannot have multiple replicas of a service, Swarm cannot guarantee that there will be no downtime. If a replica fails, it will be rescheduled. However, if that replica is the only one, the period between a failure and until it is up and running results in downtime. It’s a similar situation like with us. We get sick, stay in bed, and, after a while, return to work. The problem is if we’re the only employee in the company and there’s no one to take over the business while we’re out. The same holds true for services. Two replicas is a minimum for any service that hopes to avoid any downtime.
Unfortunately, your services might not be designed with scalability in mind. Even when they are, the chances are that some of the third-party services you’re using are not. Scalability is an important design decision, and it is an essential requirement we should evaluate whenever we’re choosing the next tool we’ll use. We need to make a clear distinction between services that must never have downtime and those that would not put the system at risk when they are not available for a few seconds. Once you make that distinction, you will know which ones must be scalable. Scalability is a requirement for no-downtime services.
Cluster Role In The System
Finally, everything we do is inside one or more clusters. There are no individual servers anymore. We do not decide what goes where. Schedulers do. From our (human) perspective, the smallest entity is a cluster which is a collection of resources like memory and CPU.
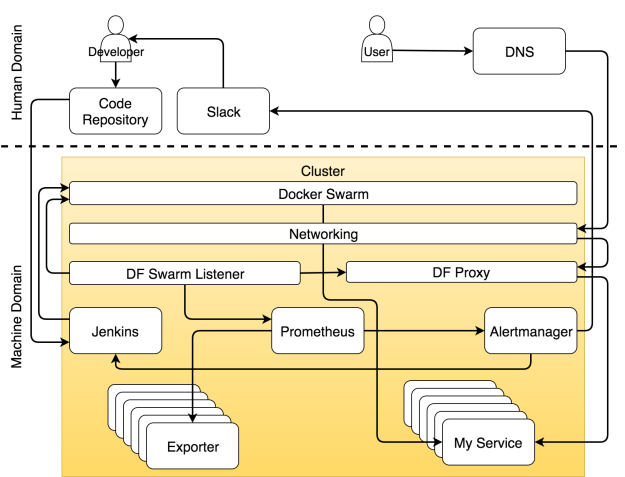
Everything is a cluster
The DevOps 2.2 Toolkit: Self-Healing Docker Clusters
The article you just read is the summary of the progress we made in The DevOps 2.2 Toolkit: Self-Healing Docker Clusters. You can find the hands-on exercises that build the system in the book.
If you liked this article, you might be interested in The DevOps 2.2 Toolkit: Self-Healing Docker Clusters book. The book goes beyond Docker and schedulers and tries to explore ways for building self-adaptive and self-healing Docker clusters. If you are a Docker user and want to explore advanced techniques for creating clusters and managing services, this book might be just what you’re looking for.
The book is still under development. If you choose to become an early reader and influence the direction of the book, please get a copy from LeanPub. You will receive notifications whenever a new chapter is added.
Give the book a try and let me know what you think
| Reference: | Building A Self-Sufficient Docker Cluster from our JCG partner Viktor Farcic at the Technology conversations blog. |
