Fortunately, now we have a decent free tool that integrates with the Eclipse known as Memory Analyzer, or MAT. Installation can be done via the standard update sites, just type memory analyzer and follow the installation instructions. Charts feature isn’t required if all you want to do is track down your problem areas. And I’ll assume you either have a heap dump generated on an OutOfMemory or have connected to a live vm to extract one. If you don’t have one and the vm is running, you can use MAT to extract one. Just look in File menu, Acquire Heap Dump option.
When you first open your heap dump, MAT will ask if you’d like to run one of their canned reports.

This likely isn’t worth your while. I haven’t found them to provide any meaningful insight. Perhaps if your application is very simple, the problem is obvious or in the case of tuning, the Component Report, these reports might be worth a shot. But likely your best starting point is to take a look at the dominator tree.
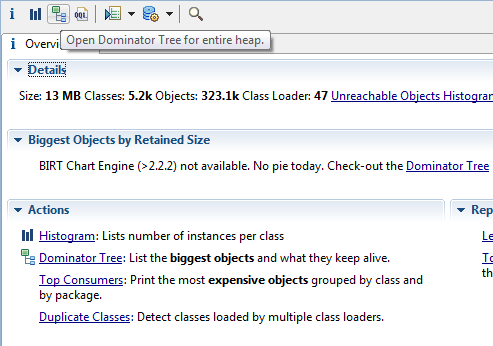
Either use the icon, the Dominator Tree link under the Biggest Objects by Retained Size section, or select it as an Action.
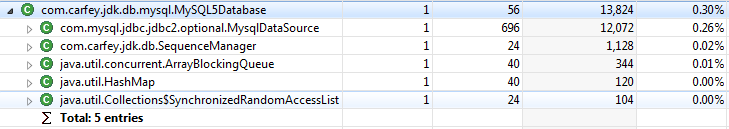
First of all, the default Dominator Tree view shows single objects. If nothing jumps out at you immediately, you can take one or both of the following actions.
- Select the Group Result By… icon and group by class
- Right click the header row and select Columns -> Edit Filter -> Class Name or start typing in the Regex row if available
This allows you to see # of Objects of each type and also filter them by your code, or perhaps other package name patterns that you suspect may be causing problems. Once you’ve found an entry that you’d like to dive into, you have several ways of getting additional information. If you expand the class selection, you’ll be able to see what references the objects are holding and their sizes – the retained objects. And MAT is smart enough that the filters you may have applied do not extend to these retained objects.
If you right click the class entry and select “Show Retained Set”, you will see all the retained objects of everything ultimately contained by that object, a very convenient view that can help you quickly pinpoint a problem class.

Perhaps you can’t understand why there are so many instances of a particular object type in your heap dump, feeling that they should be short-lived or limited in quantity. The “Path to GC Roots” (available when selecting a single object instance) and “Merge Shortest Path to GC Roots” (for multiple instances) give you a view of the objects in question that allows you to see which objects are maintaining references to the object(s) in question.

With these tools, views and filters, I’ve not found it necessary to use some of the other features of MAT but by all means, take a look at OQL (SQL style ability to query the heap details), Histograms and even specialized Java Collections usage details.
Once you have a class you’d like to investigate at the code level, assuming you have the source code in your workspace, right-click the class from any of these views and select “Open Source File”.
I’ve been able to successfully use MAT to pinpoint memory problems in applications that I had very little exposure to. It provides a concrete memory overview that doesn’t show bias when long-time project developers may be inclined to do so. If you happen to have a decent understanding of your application, even better. That knowledge will help you put context around some of the data MAT shows you. What’s your experience with MAT been?
Reference: Eclipse and Memory Analyzer (MAT) from our JCG partners at the Carfey Software blog.
