When developing complex, high-availability software projects, performance is of key importance. That is especially true in these modern times where anything other than lightning fast accessibility of real-time data is punished. This is not always an easy feat when talking about the huge amounts of data that are sometimes required.
In this post we’ll use an online booking engine as the guiding example. All data comes from a single API. We’ll map the expected bottlenecks, set up realistic scenarios on the expected load, and automate all of this so we can check the performance the whole time. We’ll do this using JMeter and BlazeMeter.
Analysis
All the load on the API can be put into one of three categories. There are the API calls from our booking engine. Then the automated jobs that have an impact on our system resources. These are triggered with an API endpoint as well. And finally, we look at the API calls that tax the server independently of the booking engine. It is important, in other words, to chart all factors that impact the server resources, as it is not just the booking engine that is responsible for the load.
We use Google Analytics to check the current page-views-per-API-method. The busiest day of the year is the basis for the load. If you expect a certain amount of growth, you can always multiply this with a certain factor. We also look at the division between API-calls between the booking engine and automated tasks on the one hand and other calls. This is best done over an entire year. The result of all this should be something like the following:
| API-CALL | AMOUNT | PERCENTAGE | PART |
| /available-days | 5k | 31% | BOOKING ENGINE |
| /available -hours | 4k | 15% | BOOKING ENGINE |
| … | |||
| /recalculate-event | 1k | 16% | TASKS |
| … | |||
| /get-employees | 2k | 5% | OTHER |
| … |
JMeter
We use JMeter to write our performance tests. To create realistic JMeter scenarios from this data, we use two additional plugins:
- Weighted Switch Controller, to get the necessary of requests.
- Random CSV Data Set, to use random parameters from a CSV list for the API calls.
In the end, the scenario’s look like this:
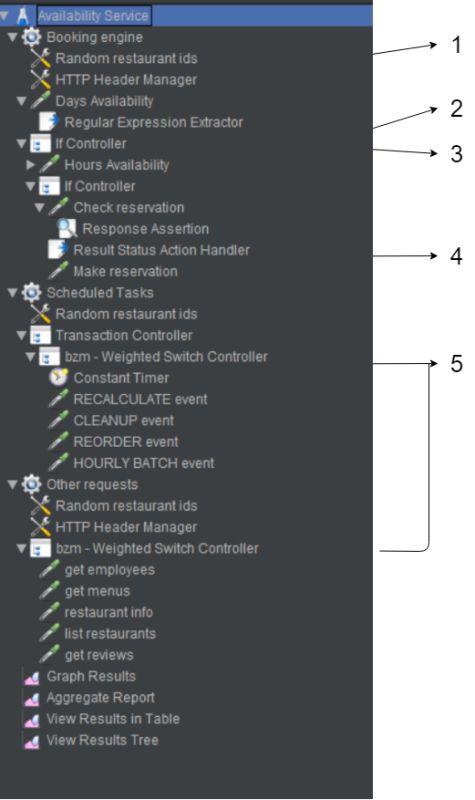
There are three repeating parts in the scenario. Some important aspects:
1. Loading up random restaurant IDs with the Random CSV Data Set plugin to create API requests for the different restaurants.
2. Completing a booking via the engine consists of several sequential steps. We call on these steps using the random data from the CSV set together with JMeter functions:
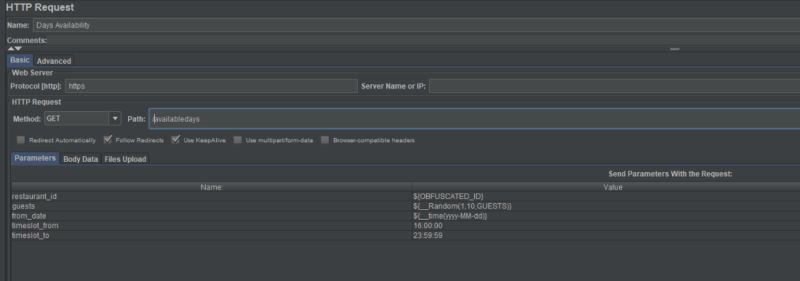
The Regular Expression Extractor saves the API response in a variable for the next steps:
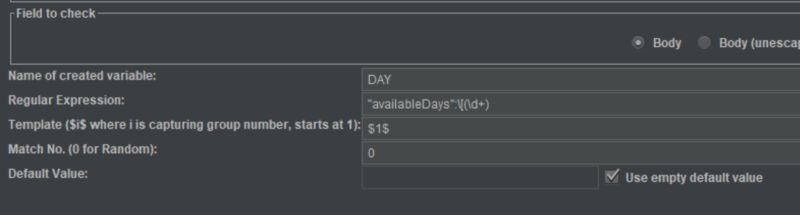
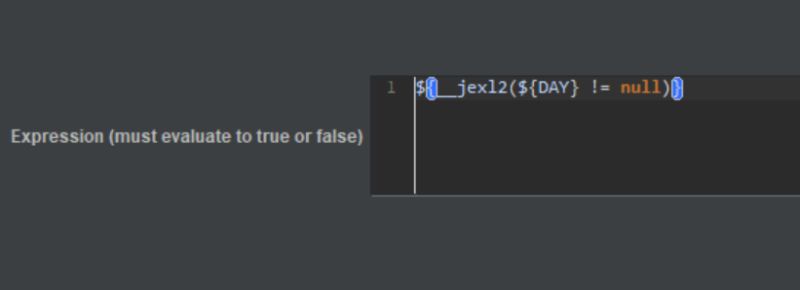
3. The IF controller makes sure the next steps are only started when a certain condition is met. If not, JMeter starts the next test cycle, where we check the availability for the random data that was given. A Jexl2 expression is used to check whether the variable is not null:
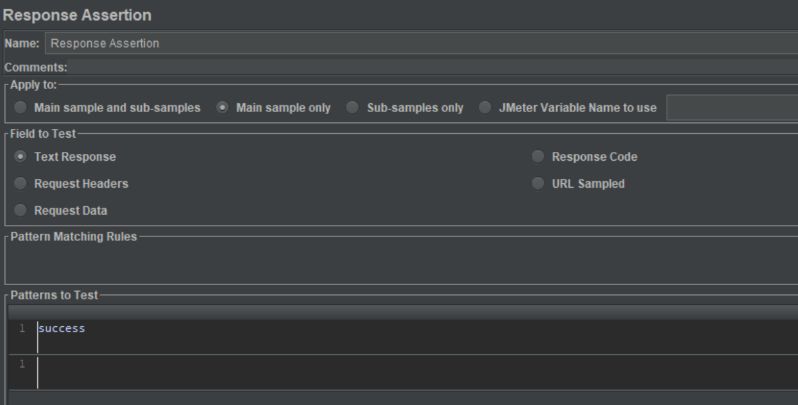
4. In this last step we use the Response Assertion to check the response. If it does not contain the word ‘success’, JMeter goes to the next test cycle:
5. The Weighted Switch Controller is used to launch the automated tasks and the other API calls with a weighted average. We use the percentages from our analysis for this.
Each group requires a set number of users. Depending on your analysis and the expected load, select an amount that makes sense.
BlazeMeter
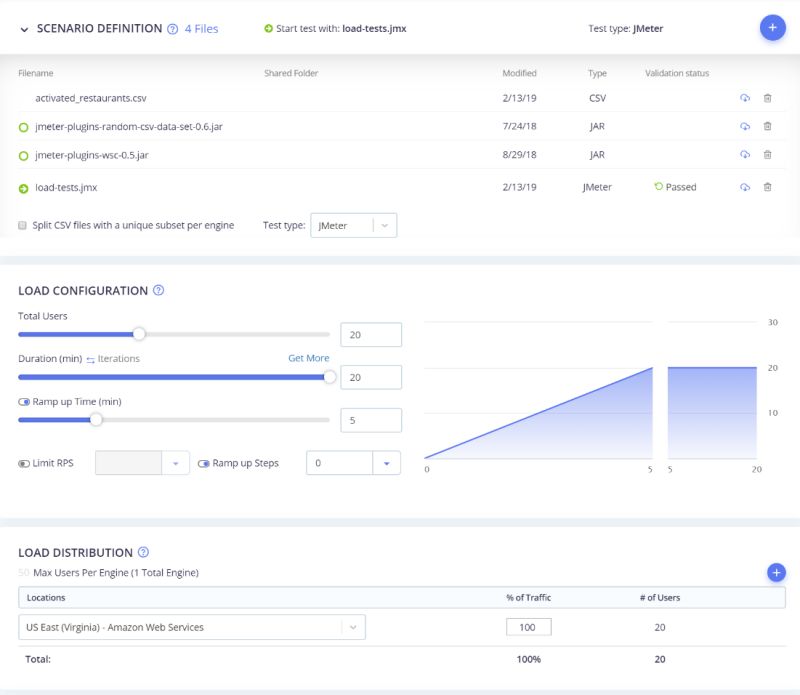
BlazeMeter is a great tool to run JMeter tests. After you upload your scenarios, plugins and data CSV, you can configure your load with the amount of concurrent users, time to complete and ramp-up. The most important factor is the number of users. This amount will be spread out evenly over the different groups, based on the number of users set in JMeter. The amount should be such that you produce at least your expected load. Finally, BlazeMeter also allows you to select the origin of your traffic. Its free plan allows you to run one such plan per week.
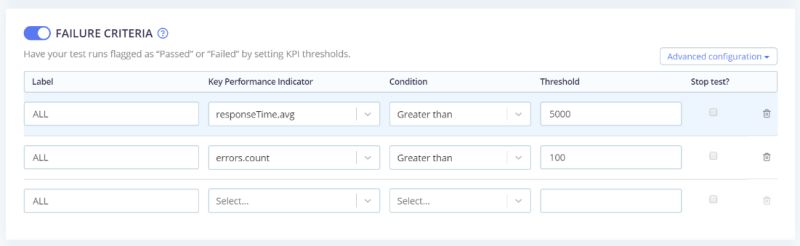
It is also possible to select failure criteria, based on your KPIs:
BlazeMeter allows integrations with different monitoring and CI tools; we ourselves use Bamboo. There is a Bamboo plugin and a comprehensive guide to help you with the integration.
This way you can run automated performance tests once a week (more often if you upgrade your BlazeMeter subscription). These tests generate reports with a detailed overview of the responses and errors per request.
Conclusion
Getting your analysis right is perhaps the most important part of writing performance tests. This means getting not just the expected load from the application itself, but also the other API calls and other tasks that influence performance. That data is used to create the JMeter scenarios; the Random Data & Weighted Controllers plugins are a great help here. BlazeMeter lets you run these scenarios and creates visual reports to help you find your bottlenecks and problems. Integration with your CI system is a boon here.
Performance testing is an invaluable tool. The combination of JMeter with BlazeMeter allows us to weed out bottlenecks and issues regularly and consistently. So each build is as fast as we can make it.
Published on Java Code Geeks with permission by Sander Van Loock, partner at our JCG program. See the original article here: Performance Testing with JMeter Opinions expressed by Java Code Geeks contributors are their own. |

Very clearly explained, thank you!