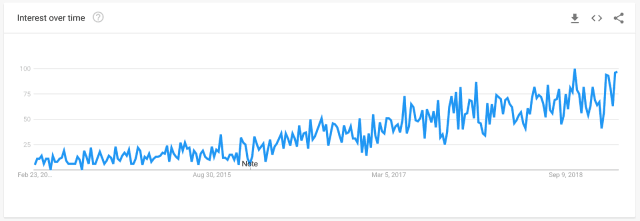
Everything “as code” is all the rage now. What can we represent as code except for the programs? First of all, infrastructure as code is gaining popularity — it is enough to see the Google Trends graph for it to see that it is steadily climbing year by year. Terraform, OpenShift, CloudFormation, Helm, Puppet and many other tools are the representatives of this trend.
However, this article deals with something else entirely: diagrams as code. Why do it? Well, code has a few advantages over, well, diagrams:
- It is readable. Well, at least good code is. A lot of people absorb written information better than anything else, despite that saying about one picture being better than a thousand words.
- It is compact. A text file size is usually times and times smaller than any picture. And is much easier therefore to store in the repository.
- Version control. You can keep pictures under version control, however, they are binary files, and the changes are therefore obfuscated. If you change the picture in a repo, people will not know what the change was about, until they check out the repo and have a look at the picture. The diff itself won’t be much help at all.
- It is easy. It is much easier to type “Service A uses Service B” than draw those boxes on a diagram, label them, connect them with arrows etc. Especially for people who might be, let’s say, artistically challenged.
It turns out, however, that there’s a tool that allow you to have a best of both worlds. And this tool is PlantUML.
PlantUML allows to basically write text which is automatically transformed into the diagrams. It has its own pretty simple DSL and allows for a lot of the types of UML diagrams:
- Sequence diagrams;
- Usecase diagrams;
- Class diagrams;
- Activity diagrams;
- Component diagrams;
- State diagrams;
- Object diagrams;
- Deployment diagrams;
- Timing diagram.
Also, it supports some non-UML diagrams which are pretty cool, for example the Wireframe diagrams for UI design, which seems a really interesting concept.
How to use PlantUML? Actually, in a hundred ways. It can be installed locally as a separate tool or as a plugin to basically anything (Wikis, forums, text editors, IDEs and what not, check the link and chances are, you will find at least several alternatives that you’re already using). As my tool of choice is IntelliJ IDEA, this is the plugin I use.
Let’s try a sequence diagram, because it’s the one that usually gives me a lot of headache. (All those swimlanes and blocks that need to be aligned, don’t make me started.) We’re designing an automated restaurant order system (no waiter, just a tablet to order with — know what I mean?) and need a bird’s view of the basic flow. We have a client who orders from the menu, an inventory against which the order is checked, and a feedback system to be able to correct the order. And we’ll put some queues in to make the process asynchronous (just because we are cool).
How will it look? Approximately like this.
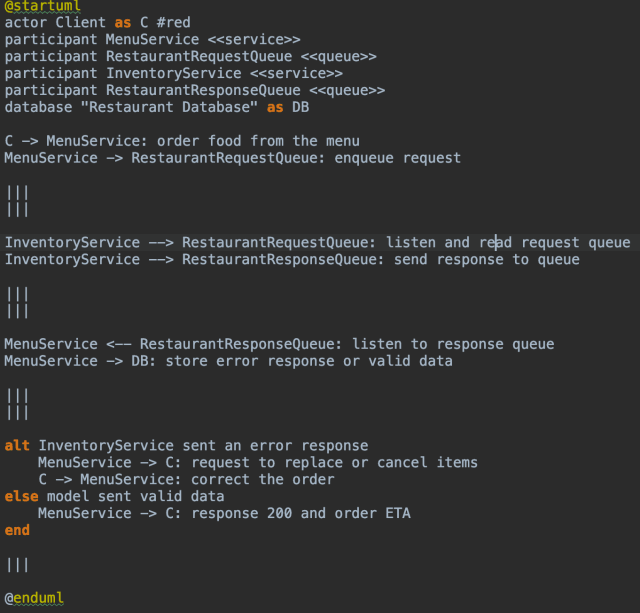
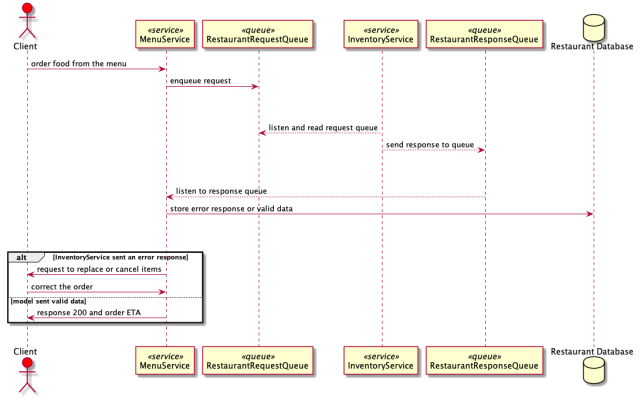
We can clearly see that we have one actor — Client, four participants MenuService, InventoryService and two queues for requests and responses — and a database to keep track of all this. The IDE plugin instantly transforms the code into this picture:
What can I do with it? I can export it into a picture and show to anyone. Also, I can use the online demo server and just copy and paste the whole code I have into the textbox there and click Submit. The demo server will return a URL to the generated diagram:
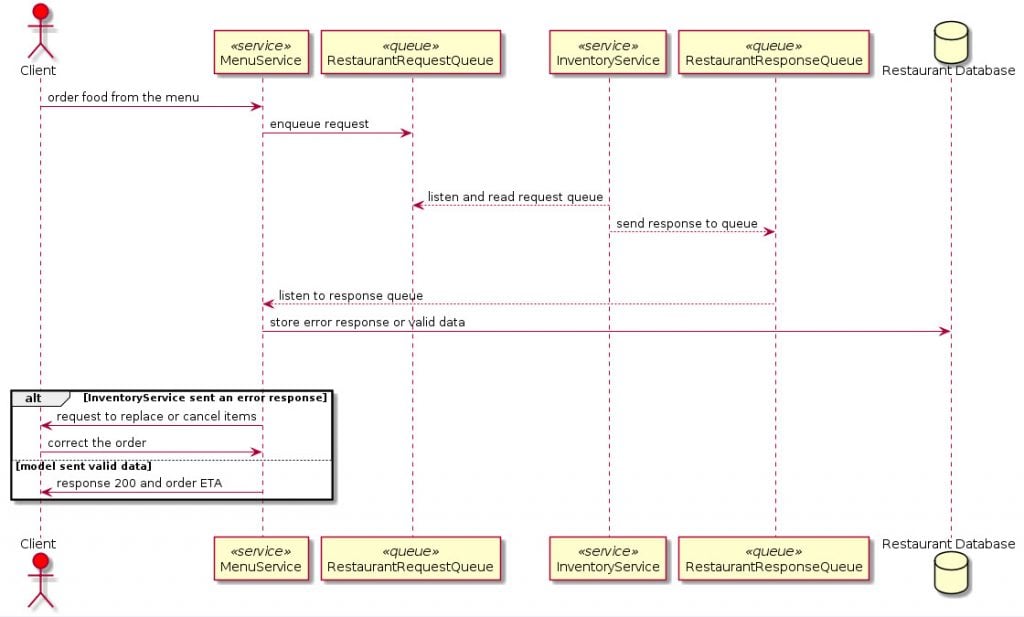
This URL can be used to get the picture into your project readme file, confluence wiki or just any web page. The interesting thing about it is that a picture itself isn’t stored on the demo server, because all the information is already encoded into the URL. So, just the URL is stored.
I think this tool is great to play with and explore. And these “diagrams” are great to store under source control, because all the changes are immediately readable by just scrolling to a diff. And it goes so much faster than drawing and repositioning all those blocks and swimlanes.
If you like the idea, by any means go and try the tool on your own! What I’ve shown here is just a very basic example, but I thing one can do a lot with it. The website also has a FAQ to help people with some issues that may arise (I experienced none with the IDE plugin, but as this tool has so many integrations which I haven’t tried).
Not all of us are artist, but the great thing is, not all of us have to be.
Published on Java Code Geeks with permission by Maryna Cherniavska, partner at our JCG program. See the original article here: PlantUML: Diagrams as Code Opinions expressed by Java Code Geeks contributors are their own. |

Excellent. Interesting article. Thanks for sharing.
GOOD JOB! IS THERE A TOOL LIST FOR JAVA DEVELOPERS?