The upcoming release of NetBeans, currently in active development and testing, boasts plenty of new features. A few of them include EMCAScript 6 Support, Docker Support, JavaShell Support, and SQL Profiling. In the latest nightly builds, the SQL Profiler is now available for use, so I took it for a test spin. In this post, I’ll run through just a few of the options available with the upcoming NetBeans SQL Profiler…I think you will be quite pleased.
The SQL Profiler allows one to instantly see which queries are causing the most contention within an application, and enables easy comparison via total running time and invocations against each of the queries that have been executed. The tool also allows one to perform heap dump, garbage collection in the profiled process, and many other useful features.To get started with the SQL Profiler, download the latest nightly build of NetBeans, which can be done at the following URL: http://bits.netbeans.org/download/trunk/nightly/latest/
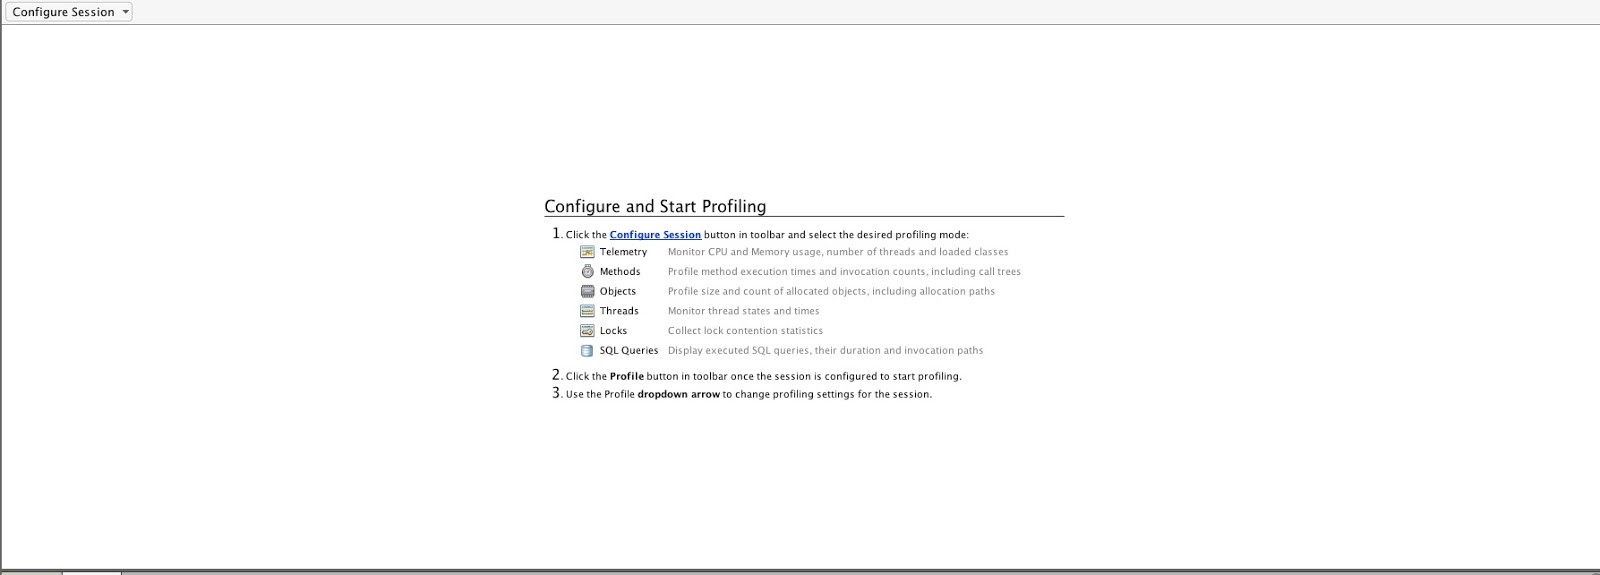
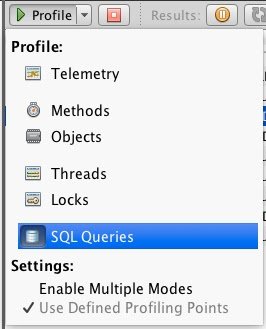
Next, install and run the IDE, then import or select a project that utilizes a database. Just like the other NetBeans profilers, a JVM must be calibrated for profiling before the SQL Profiler can be ran against a project that utilizes that JVM. To perform calibration, select the project and then choose “Profile Project” from the “Profile” menu. After a JVM has been calibrated, any project using that JVM can be profiled. Simply select the project, and start the profiler of your choice by selecting the profiler option within the drop-down list. In this case, I’ll choose the SQL Queries option.
Once the profiler has been started, the application will launch and the most current SQL queries will be displayed in a chart. In this case, I am profiling a Maven based Web application project running Java EE 7 and JPA. When the profiler is started, the web application launches and the SQL Profiler screen is displayed.
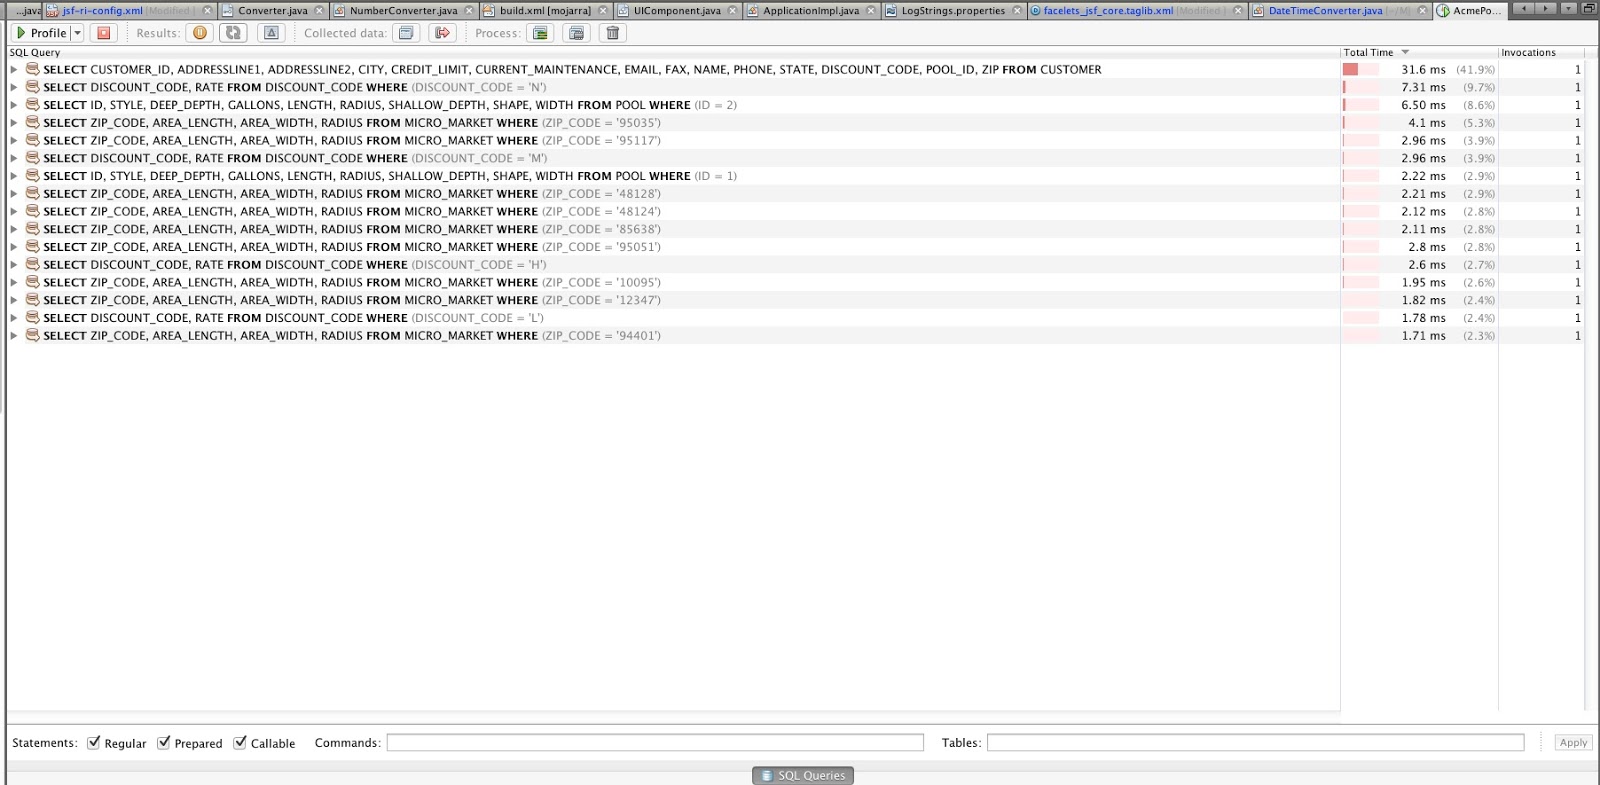
The NetBeans SQL Profiler makes it easy to see which queries have been invoked, how many times they have been initiated, and how long they took to run. As I run my cursor over the SQL queries, the query that is under my cursor is highlighted, and I am able to click on it to expand the row and see the method invocation stack.

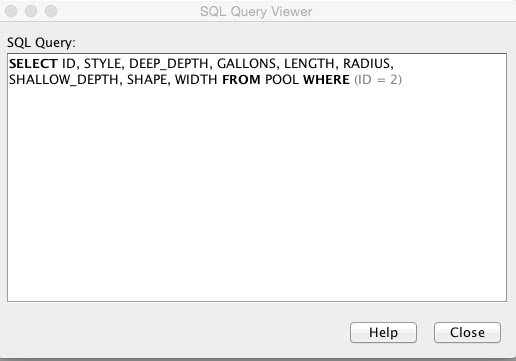
If I choose, I can right-click on a given query, and view the SQL.
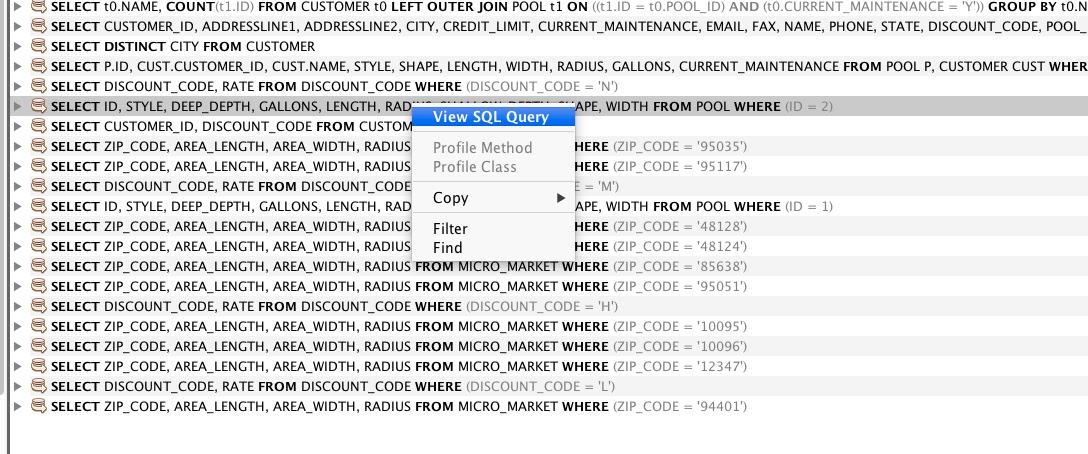
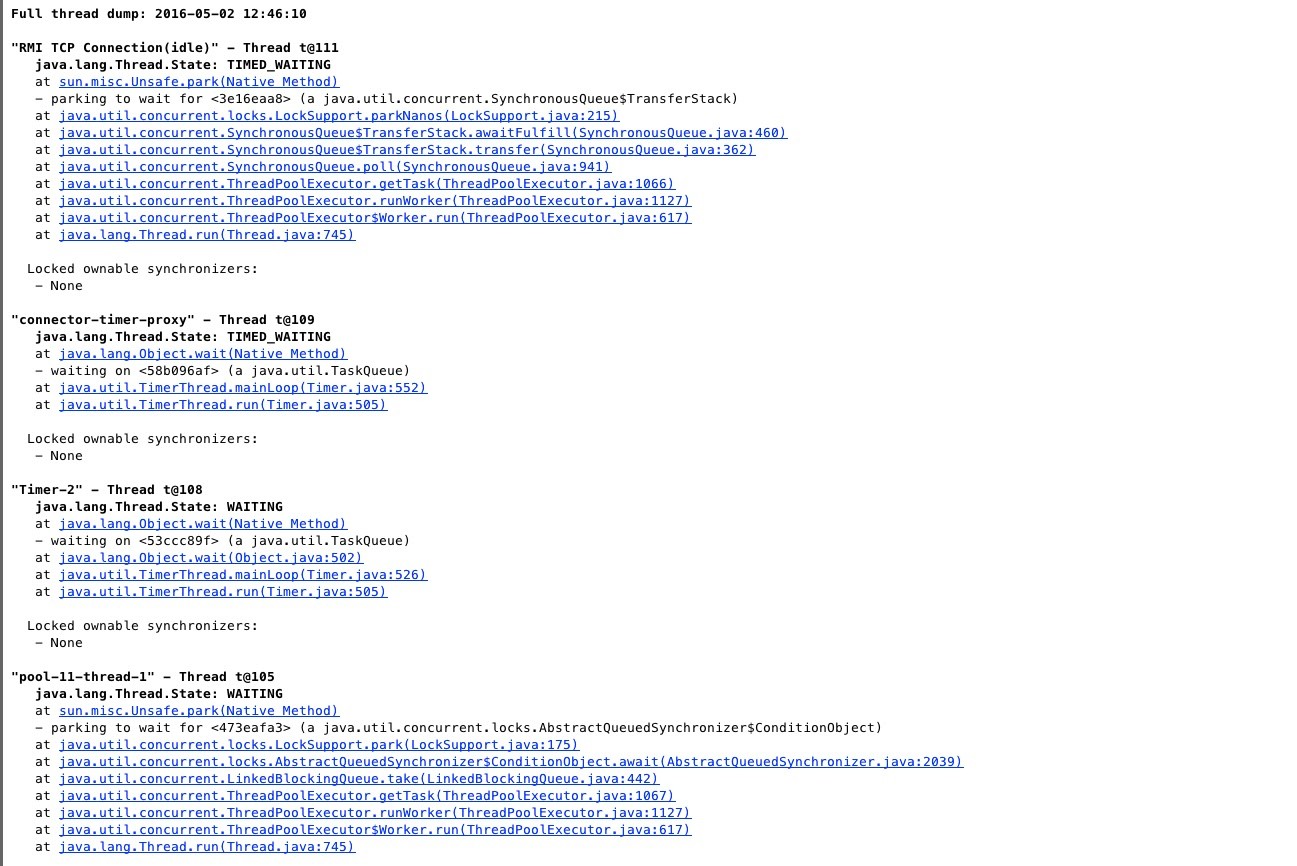
As mentioned at the top of the post, I have the ability to perform a heap or thread dump for a selected query, and I can even perform a garbage collection.
The NetBeans SQL Profiler is going to be a great tool for anyone that develops applications utilizing a database backend. Not only will it allow one to clearly see which SQL is causing the most contention within an application, but it also allows for easy comparison and provides detailed information on the underlying SQL invocations.
Download the latest build to try it out now…otherwise, it will be available with the public release of NetBeans 8.2. The bonus is that if you try it now and find issues or have comments, you can help the developers make the Profiler even better.
| Reference: | NetBeans SQL Profiler – Take it for a Spin! from our JCG partner Josh Juneau at the Josh’s Dev Blog – Java, Java EE, Jython, Oracle, and More… blog. |
