Introduction
This is the second part of our MongoDB time series tutorial, and this post will be dedicated to performance tuning. In my previous post, I introduced you into our virtual project requirements.
In short we have 50M time events, spanning from the 1st of January 2012 to the 1st of January 2013, with the following structure:
{
    "_id" : ObjectId("52cb898bed4bd6c24ae06a9e"),
    "created_on" : ISODate("2012-11-02T01:23:54.010Z")
    "value" : 0.19186609564349055
}
We’d like to aggregate the minimum, the maximum, and the average value as well as the entries count for the following discrete time samples:
- all seconds in a minute
- all minutes in an hour
- all hours in a day
This is how our base test script looks like:
var testFromDates = [
	new Date(Date.UTC(2012, 5, 10, 11, 25, 59)),
	new Date(Date.UTC(2012, 7, 23, 2, 15, 07)),
	new Date(Date.UTC(2012, 9, 25, 7, 18, 46)),
	new Date(Date.UTC(2012, 1, 27, 18, 45, 23)),
	new Date(Date.UTC(2012, 11, 12, 14, 59, 13))
];

function testFromDatesAggregation(matchDeltaMillis, groupDeltaMillis, type, enablePrintResult) {
	var aggregationTotalDuration = 0;
	var aggregationAndFetchTotalDuration = 0;
	testFromDates.forEach(function(testFromDate) {
		var timeInterval = calibrateTimeInterval(testFromDate, matchDeltaMillis);
		var fromDate = timeInterval.fromDate;
		var toDate = timeInterval.toDate;
		var duration = aggregateData(fromDate, toDate, groupDeltaMillis, enablePrintResult);
		aggregationTotalDuration += duration.aggregationDuration;
		aggregationAndFetchTotalDuration += duration.aggregationAndFetchDuration;
	});
	print(type + " aggregation took:" + aggregationTotalDuration/testFromDates.length + "s");
	if(enablePrintResult) {
		print(type + " aggregation and fetch took:" + aggregationAndFetchTotalDuration/testFromDates.length + "s");
	}
}
And this is how we are going to test our three use cases:
testFromDatesAggregation(ONE_MINUTE_MILLIS, ONE_SECOND_MILLIS, 'One minute seconds');
testFromDatesAggregation(ONE_HOUR_MILLIS, ONE_MINUTE_MILLIS, 'One hour minutes');
testFromDatesAggregation(ONE_DAY_MILLIS, ONE_HOUR_MILLIS, 'One year days');
We are using five start timestamps and these are used to calculate the current in-testing time interval by the given time granularity.
The first time stamp (e.g. T1) is Sun Jun 10 2012 14:25:59 GMT+0300 (GTB Daylight Time) and the associated in-testing time intervals are:
- all seconds in a minute:
[ Sun Jun 10 2012 14:25:00 GMT+0300 (GTB Daylight Time)
, Sun Jun 10 2012 14:26:00 GMT+0300 (GTB Daylight Time) ) - all minutes in an hour:
[ Sun Jun 10 2012 14:00:00 GMT+0300 (GTB Daylight Time)
, Sun Jun 10 2012 15:00:00 GMT+0300 (GTB Daylight Time) ) - all hours in a day:
[ Sun Jun 10 2012 03:00:00 GMT+0300 (GTB Daylight Time)
, Mon Jun 11 2012 03:00:00 GMT+0300 (GTB Daylight Time) )
Cold database testing
The first tests are going to be run on a freshly started MongoDB instance. So between each test we are going to restart the database, so no index gets pre-loaded.
| Type | seconds in a minute | minutes in an hour | hours in a day |
|---|---|---|---|
| T1 | 0.02s | 0.097s | 1.771s |
| T2 | 0.01s | 0.089s | 1.366s |
| T3 | 0.02s | 0.089s | 1.216s |
| T4 | 0.01s | 0.084s | 1.135s |
| T4 | 0.02s | 0.082s | 1.078s |
| Average | 0.016s | 0.088s | 1.3132s |
We are going to use these results as a reference for the following optimization techniques I’m going to present you.
Warm database testing
Warming-up indexes and data is a common technique, being used for both SQL and NoSQL database management systems. MongoDB offers the touch command for this purpose. But this is no magic wand, you don’t blindly use it in the hope of leaving all your performance problems behind. Misuse it and your database performance will drastically drop, so be sure you understand your data and its usage.
The touch command let us specify what we want to preload:
- data
- indexes
- both data and indexes
We need to analyze our data size and how we are going to query it, to get the best of data preloading.
Data size footprint
MongoDB comes fully equipped when it comes to analyzing your data. Nest, we are going to introspect our time events collection using the following commands:
> db.randomData.dataSize()
3200000032
> db.randomData.totalIndexSize()
2717890448
> db.randomData.totalSize()
7133702032
The data size is around 3GB, while the total size is almost 7GB. If I choose to preload all data and indexes I’m going to hit the 8GB RAM limit of the current workstation I am running the tests on. This will cause swapping and performance will drop.
Doing more harm than good
To replicate this scenario I am going to restart the MongoDB server and run the following command:
db.runCommand({ touch: "randomData", data: true, index: true });I included this command in a script file to see also how much it takes to load all data for the very first time.
D:\wrk\vladmihalcea\vladmihalcea.wordpress.com\mongodb-facts\aggregator\timeseries>mongo random touch_index_data.js
MongoDB shell version: 2.4.6
connecting to: random
Touch {data: true, index: true} took 15.897s
Now, let’s rerun our tests and see what we get this time:
| Type | seconds in a minute | minutes in an hour | hours in a day |
|---|---|---|---|
| T1 | 0.016s | 0.359s | 5.694s |
| T2 | 0 | 0.343s | 5.336s |
| T3 | 0.015s | 0.375s | 5.179s |
| T4 | 0.01s | 0.359s | 5.351s |
| T4 | 0.016s | 0.343s | 5.366s |
| Average | 0.009s | 0.355s | 5.385s |
The performance dropped drastically, and I wanted to include this use case to make you realize that optimizations are serious business. You really have to understand what’s going on, otherwise you may end up doing more harm than good.
This is a snapshot of the memory usage for this particular use case:
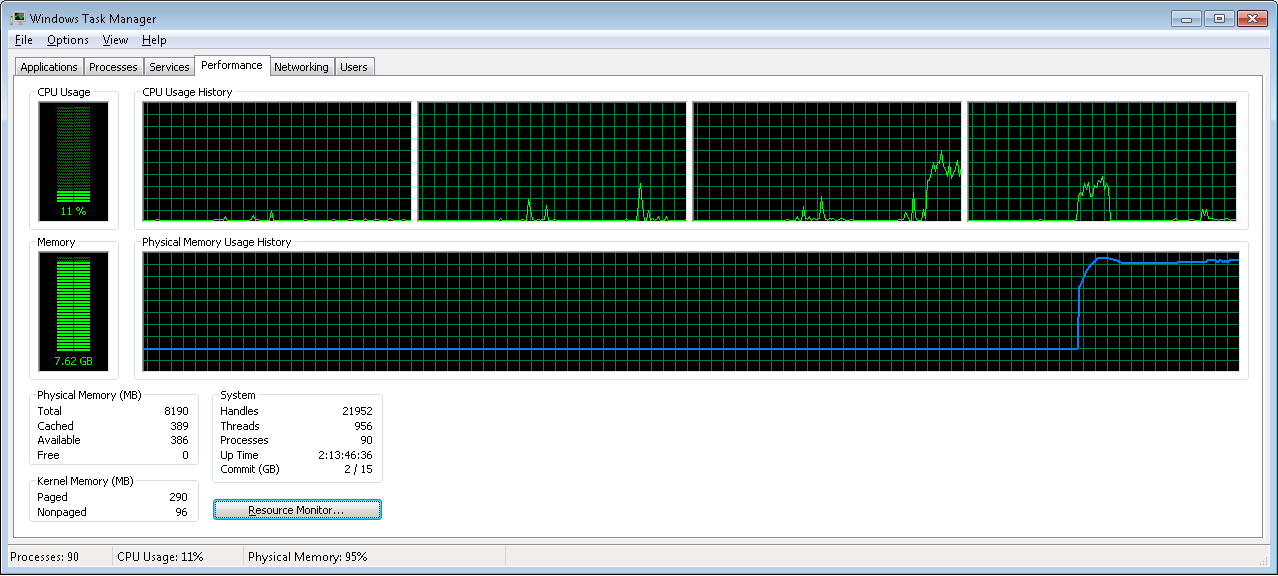
To find more about this topic, I recommend spending some time reading about MongoDB storage inner-workings.
Preloading data only
As I said before, you need to know both the available optimization techniques as your particular data usage. In our project, as I explained in my previous post, we use the index during the match phase only. During data fetching, we are also loading the values, which are not indexed. Because the data size fits entirely in RAM, we can choose to only preload data, leaving the indexes away.
This is a good call, considering our current collection indexes:
"indexSizes" : {
      "_id_" : 1460021024,
      "created_on_1" : 1257869424
}
We don’t need the _id index at all, and for our specific use-case, loading it is actually hindering performance. So, this time we are preloading data only.
db.runCommand({ touch: "randomData", data: true, index: false });D:\wrk\vladmihalcea\vladmihalcea.wordpress.com\mongodb-facts\aggregator\timeseries>mongo random touch_data.j
MongoDB shell version: 2.4.6
connecting to: random
Touch {data: true} took 14.025sRerunning all tests yields the following results:
| Type | seconds in a minute | minutes in an hour | hours in a day |
|---|---|---|---|
| T1 | 0 | 0.047s | 1.014s |
| T2 | 0 | 0.047s | 0.968s |
| T3 | 0.016s | 0.047s | 1.045s |
| T4 | 0 | 0.047s | 0.983s |
| T4 | 0 | 0.046s | 0.951s |
| Average | 0.003s | 0.046s | 0.992s |
This is better as we can see improvements for all three time- interval queries. But this is not the best we can get, as we can improve it even further.
We can preload all working set in a background process, and that should definitely improve all our aggregations.
Preloading the working set
For this I wrote the following script:
load(pwd() + "/../../util/date_util.js");
load(pwd() + "/aggregate_base_report.js");
var minDate = new Date(Date.UTC(2012, 0, 1, 0, 0, 0, 0));
var maxDate = new Date(Date.UTC(2013, 0, 1, 0, 0, 0, 0));
var one_year_millis = (maxDate.getTime() - minDate.getTime());
aggregateData(minDate, maxDate, ONE_DAY_MILLIS);
This is going to aggregate a year span of data and aggregate it for each day of year:
D:\wrk\vladmihalcea\vladmihalcea.wordpress.com\mongodb-facts\aggregator\timeseries>mongo random aggregate_year_report.js
MongoDB shell version: 2.4.6
connecting to: random
Aggregating from Sun Jan 01 2012 02:00:00 GMT+0200 (GTB Standard Time) to Tue Jan 01 2013 02:00:00 GMT+0200 (GTB Standard Time)
Aggregation took:299.666s
Fetched :366 documents.
Rerunning all tests yields the best results so far:
| Type | seconds in a minute | minutes in an hour | hours in a day |
|---|---|---|---|
| T1 | 0 | 0.032s | 0.905s |
| T2 | 0 | 0.046s | 0.858s |
| T3 | 0 | 0.047s | 0.952s |
| T4 | 0 | 0.031s | 0.873s |
| T4 | 0 | 0.047s | 0.858s |
| Average | 0 | 0.040s | 0.889s |
Let’s check our current working set memory footprint.
db.serverStatus( { workingSet: 1 } );
...
"workingSet" : {
"note" : "thisIsAnEstimate",
"pagesInMemory" : 1130387,
"computationTimeMicros" : 253497,
"overSeconds" : 723
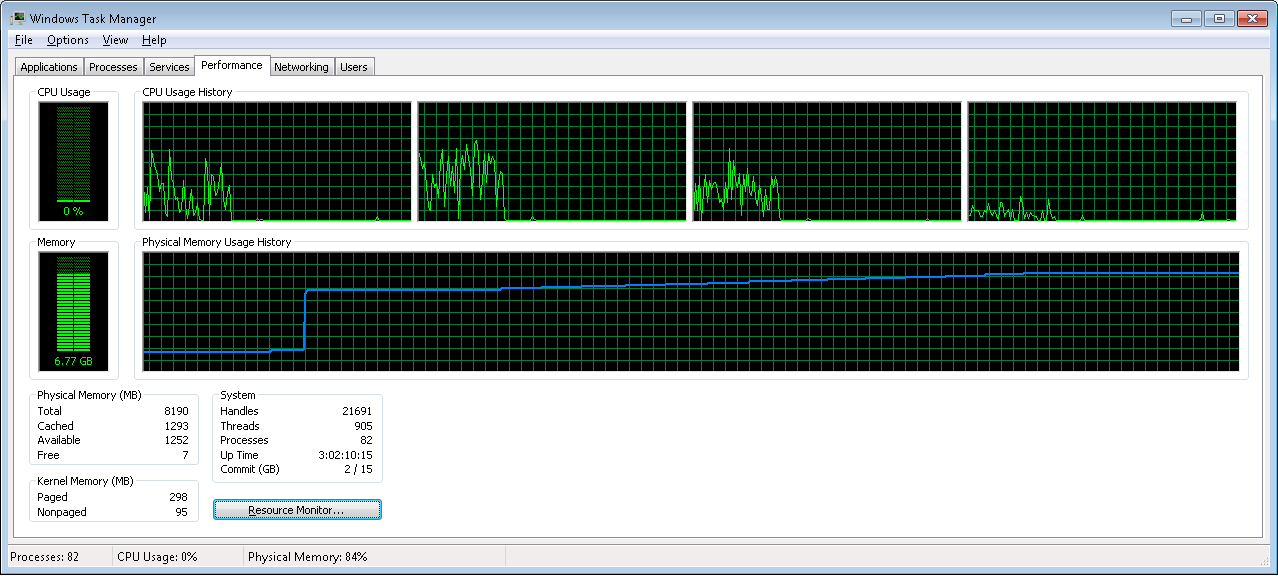
}This is an estimation, and each memory page is about 4k, so our estimated working set is about 4k * 1130387 = 4521548k = 4.31GB, ensuring us the current working set fits our RAM.
This case also be confirmed by the memory usage for the working set preloading and all test runs:
Conclusion
Comparing the current minutes-in-an-hour results to my previous one we can see a five time improvement already, but we are not done with it yet. This simple optimization reduced the gap between my previous results (0.209s) and the JOOQ Oracle one (0.02s), although their result is still a little bit better.
We concluded that the current structure works against us for large data-sets. My next post will bring you an improved compressed data model, which will allow us to store more documents per shard.
- Code available on GitHub.
