
The benchmark tests to help you discover how Logback performs under pressure
Logging is essential for server-side applications but it comes at a cost. It’s surprising to see though how much impact small changes and configuration tweaks can have on an app’s logging throughput. In this post we will benchmark Logback’s performance in terms of log entries per minute. We’ll find out which appenders perform best, what is prudent mode, and what are some of the awesome side effects of Async methods, sifting and console logging. Let’s get to it.
The groundwork for the benchmark
At its core, Logback is based on Log4j with tweaks and improvements under Ceki Gülcü’s vision. Or as they say, a better Log4j. It features a native slf4j API, faster implementation, XML configuration, prudent mode, and a set of useful Appenders which I will elaborate on shortly.
Having said that, there are quite a few ways to log with the different sets of Appenders, patterns and modes available on Logback. We took a set of commonly used combinations and put them to a test on 10 concurrent threads to find out which can run faster. The more log entries written per minute, the more efficient the method is and more resources are free to serve users. It’s not exact science but to be more precise, we’ve ran each test 5 times, removed the top and bottom outliers and took the average of the results. To try and be fair, all log lines written also had an equal length of 200 characters.
** All code is available on GitHub right here. The test was run on a Debian Linux machine running on Intel i7-860 (4 core @ 2.80 GHz) with 8GB of RAM.
First Benchmark: What’s the cost of synchronous log files?
First we took a look at the difference between synchronous and asynchronous logging. Both writing to a single log file, the FileAppender writes entries directly to file while the AsyncAppender feeds them to a queue which is then written to file. The default queue size is 256, and when it’s 80% full it stops letting in new entries of lower levels (Except WARN and ERROR).
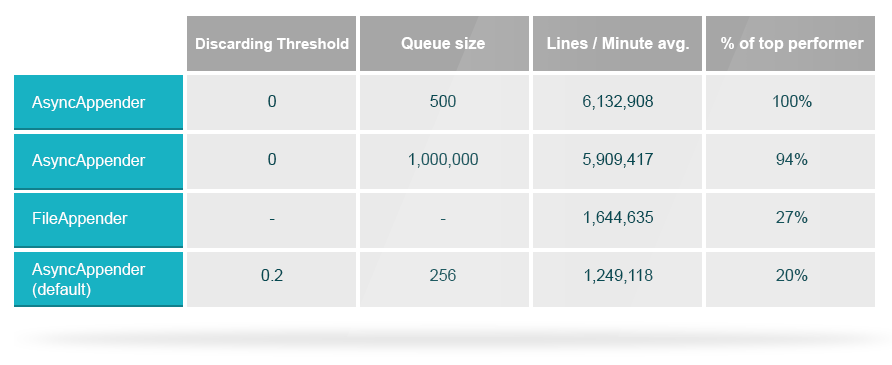
The table compares between the FileAppender and different queue sizes for the AsyncAppender. Async came on top with the 500 queue size.
- Tweak #1: AsyncAppender can be 3.7x faster than the synchronous FileAppender. Actually, it’s the fastest way to log across all appenders.
It performed way better than the default configuration that even trails behind the sync FileAppender which was supposed to finish last. So what might have happened?
Since we’re writing INFO messages, and doing so from 10 concurrent threads, the default queue size might have been too small and messages could have been lost to the default threshold. Looking at results of the 500 and 1,000,000 queue sizes, you’ll notice that their throughput was similar so queue size and threshold weren’t an issue for them.
- Tweak #2: The default AsyncAppender can cause a 5 fold performance cut and even lose messages. Make sure to customize the queue size and discardingThreshold according to your needs.
<appender name="ASYNC500" class="ch.qos.logback.classic.AsyncAppender">
<queueSize>500</queueSize>
<discardingThreshold>0</discardingThreshold>
<appender-ref ref="FILE" />
</appender>
** Setting an AsyncAppender’s queueSize and discardingThreshold
Second Benchmark: Do message patterns really make a difference?
Now we want to see the effect of log entry patterns on the speed of writing. To make this fair we kept the log line’s length equal (200 characters) even when using different patterns. The default Logback entry includes the date, thread, level, logger name and message, by playing with it we tried to see what the effects on performance might be.
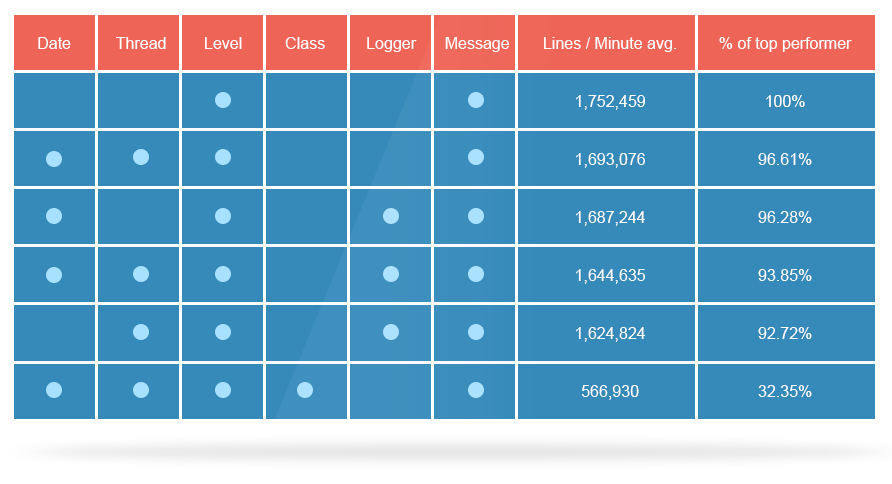
This benchmark demonstrates and helps see up close the benefit of logger naming conventions. Just remember to change its name accordingly to the class you use it in.
- Tweak #3: Naming the logger by class name provides 3x performance boost.
Taking the loggers or the threads name off added some 40k-50k entries per minute. No need to write information you’re not going to use. Going minimal also proved to be a bit more effective.
- Tweak #4: Compared to the default pattern, using only the Level and Message fields provided 127k more entries per minute.
Third Benchmark: Dear prudence, won’t you come out to play?
In prudent mode a single log file can be accessed from multiple JVMs. This of course takes a hit on performance because of the need to handle another lock. We tested prudent mode on 2 JVMs writing to a single file using the same benchmark we ran earlier.
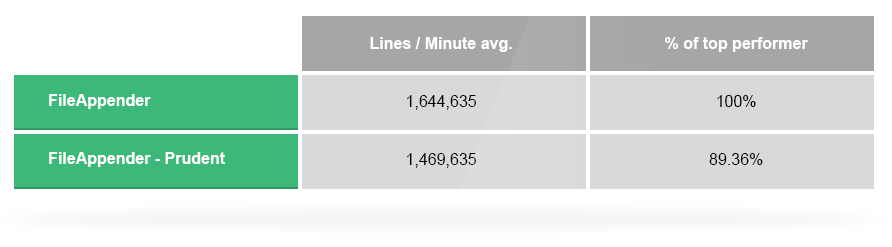
Prudent mode takes a hit as expected, although my first guess was that the impact would be a stronger.
- Tweak #5: Use prudent mode only when you absolutely need it to avoid a throughput decrease.
<appender name="FILE_PRUDENT" class="ch.qos.logback.core.FileAppender">
<file>logs/test.log</file>
<prudent>true</prudent>
</appender>
** Configuring Prudent mode on a FileAppender
Fourth Benchmark: How to speed up synchronous logging?
Let’s see how synchronous appenders other than the FileAppender perform. The ConsoleAppender writes to system.out or system.err (defaults to system.out) and of course can also be piped to a file. That’s how we we’re able to count the results. The SocketAppender writes to a specified network resource over a TCP socket. If the target is offline, the message is dropped. Otherwise, it’s received as if it was generated locally. For the benchmark, the socket was was sending data to the same machine so we avoided network issues and concerns.
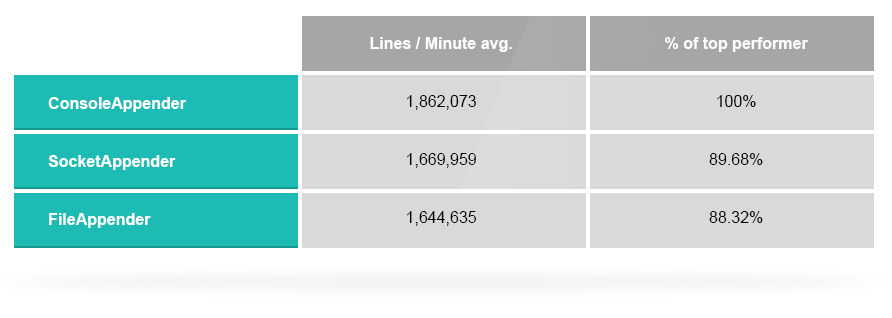
To our surprise, explicit file access through FIleAppender is more expensive than writing to console and piping it to a file. The same result, a different approach, and some 200k more log entries per minute. SocketAppender performed similarly to FileAppender in spite of adding serialization in between, the network resource if existed would have beared most of the overhead.
- Tweak #6: Piping ConsoleAppender to a file provided 13% higher throughput than using FileAppender.
Fifth Benchmark: Now can we kick it up a notch?
Another useful method we have in our toolbelt is the SiftingAppender. Sifting allows to break the log to multiple files. Our logic here was to create 4 separate logs, each holding the logs of 2 or 3 out of the 10 threads we run in the test. This is done by indicating a discriminator, in our case, logid, which determines the file name of the logs:
<appender name="SIFT" class="ch.qos.logback.classic.sift.SiftingAppender">
<discriminator>
<key>logid</key>
<defaultValue>unknown</defaultValue>
</discriminator>
<sift>
<appender name="FILE-${logid}" class="ch.qos.logback.core.FileAppender">
<file>logs/sift-${logid}.log</file>
<append>false</append>
</appender>
</sift>
</appender>
** Configuring a SiftingAppender
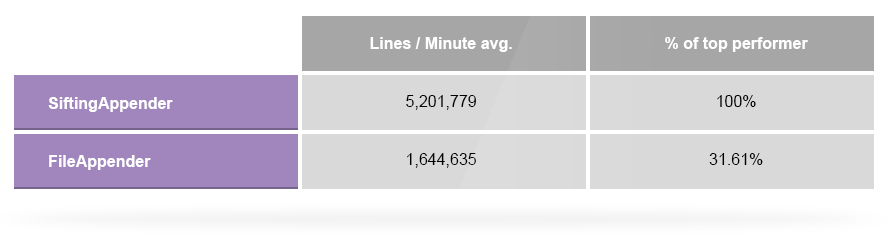
Once again our FileAppender takes a beat down. The more output targets, the less stress on the locks and fewer context switching. The main bottleneck in logging, same as with the Async example, proves to be synchronising a file.
- Tweak #7: Using a SiftingAppender can allow a 3.1x improvement in throughput.
Conclusion
We found that the way to achieve the highest throughput is by using a customized AsyncAppender. If you must use synchronous logging, it’s better to sift through the results and use multiple files by some logic. I hope you’ve found the insights from the Logback benchmark useful and look forward to hear your thoughts at the comments below.
| Reference: | How to Instantly Improve Your Java Logging With 7 Logback Tweaks from our JCG partner Alex Zhitnitsky at the Takipi blog. |

Great post! Clear and informative. Thanks!
Great informative post. Having some problems with logback performance. Will surely put your advices to the test.
Thanks