Topic of today’s post stays a bit aside from day-to-day coding and development but nonetheless covers a very important subject: our application log files. Our apps do generate enormous amount of logs which if done right are extremely handy for problems troubleshooting. It’s not a big deal if you have a single application up and running, but nowadays apps, particularity webapps, run on hundreds of servers. With such a scale figuring out where is a problem becomes a challenge. Wouldn’t it be nice to have some kind of a view which aggregates all logs from all our running applications into single dashboard so we could see a whole picture constructed from the pieces? Please welcome: Logstash, the logs aggregation framework.
Although it’s not the only solution available, I found Logstash to be very easy to use and extremely simple to integrate. To start with, we don’t even need to do anything on the application side, Logstash can do all the job for us. Let me introduce the sample project: standalone Java application which has some multithreading activity going on. There is a logging to the file configured using great Logback library (SLF4J could be used as a seamless replacement). The POM file looks pretty simple:
<project xmlns="http://maven.apache.org/POM/4.0.0" xmlns:xsi="http://www.w3.org/2001/XMLSchema-instance" xsi:schemalocation="http://maven.apache.org/POM/4.0.0 http://maven.apache.org/xsd/maven-4.0.0.xsd">
    <modelversion>4.0.0</modelversion>

    <groupid>com.example</groupid>
    <artifactid>logstash</artifactid>
    <version>0.0.1-SNAPSHOT</version>
    <packaging>jar</packaging>

    <properties>
        <project.build.sourceencoding>UTF-8</project.build.sourceencoding>
        <logback.version>1.0.6</logback.version>
    </properties>

    <dependencies>
        <dependency>
            <groupid>ch.qos.logback</groupid>
            <artifactid>logback-classic</artifactid>
            <version>${logback.version}</version>
        </dependency>

        <dependency>
            <groupid>ch.qos.logback</groupid>
            <artifactid>logback-core</artifactid>
            <version>${logback.version}</version>
        </dependency>
    </dependencies>

    <build>
        <plugins>
            <plugin>
                <groupid>org.apache.maven.plugins</groupid>
                <artifactid>maven-compiler-plugin</artifactid>
                <version>3.0</version>
                <configuration>
                    <source>1.7
                    <target>1.7</target>
                </configuration>
            </plugin>
        </plugins>
    </build>
</project>
And there is only one Java class called Starter which uses Executors services to do some work concurrently. For sure, each thread does some logging and from time to time there is an exception thrown.
package com.example.logstash;

import java.util.ArrayList;
import java.util.Collection;
import java.util.Random;
import java.util.concurrent.Callable;
import java.util.concurrent.ExecutionException;
import java.util.concurrent.ExecutorService;
import java.util.concurrent.Executors;
import java.util.concurrent.Future;
import java.util.concurrent.TimeUnit;
import java.util.concurrent.TimeoutException;

import org.slf4j.Logger;
import org.slf4j.LoggerFactory;

public class Starter {
    private final static Logger log = LoggerFactory.getLogger( Starter.class );

    public static void main( String[] args ) {
        final ExecutorService executor = Executors.newCachedThreadPool();
        final Collection< Future< Void > > futures = new ArrayList< Future< Void > >();
        final Random random = new Random();

        for( int i = 0; i < 10; ++i ) {
            futures.add(
                executor.submit(
                    new Callable< Void >() {
                        public Void call() throws Exception {
                            int sleep = Math.abs( random.nextInt( 10000 ) % 10000 );
                            log.warn( 'Sleeping for ' + sleep + 'ms' );
                            Thread.sleep( sleep );
                            return null;
                        }
                    }
                )
            );
        }

        for( final Future< Void > future: futures ) {
            try {
                Void result = future.get( 3, TimeUnit.SECONDS );
                log.info( 'Result ' + result );
            } catch (InterruptedException | ExecutionException | TimeoutException ex ) {
                log.error( ex.getMessage(), ex );
            }
        }
    }
}
The idea is to demonstrate not only simple one-line logging events but famous Java stack traces. As every thread sleeps for random time interval, it causes TimeoutException to be thrown whenever the result of computation is being asked from the underlying future object and taken more than 3 seconds to return. The last part is Logback configuration (logback.xml):
<configuration scan="true" scanperiod="5 seconds">
    <appender name="FILE" class="ch.qos.logback.core.FileAppender">
        <file>/tmp/application.log</file>
        <append>true</append>
        <encoder>
            <pattern>[%level] %d{yyyy-MM-dd HH:mm:ss.SSS} [%thread] %logger{36} - %msg%n</pattern>
     </encoder>
    </appender>

    <root level="INFO">
        <appender-ref ref="FILE">
    </appender-ref></root>
</configuration>
And we are good to go! Please note that file path /tmp/application.log corresponds to c:\tmp\application.log on Windows. Running our application would fill log file with something like that:
[WARN] 2013-02-19 19:26:03.175 [pool-2-thread-1] com.example.logstash.Starter - Sleeping for 2506ms
[WARN] 2013-02-19 19:26:03.175 [pool-2-thread-4] com.example.logstash.Starter - Sleeping for 9147ms
[WARN] 2013-02-19 19:26:03.175 [pool-2-thread-9] com.example.logstash.Starter - Sleeping for 3124ms
[WARN] 2013-02-19 19:26:03.175 [pool-2-thread-3] com.example.logstash.Starter - Sleeping for 6239ms
[WARN] 2013-02-19 19:26:03.175 [pool-2-thread-5] com.example.logstash.Starter - Sleeping for 4534ms
[WARN] 2013-02-19 19:26:03.175 [pool-2-thread-10] com.example.logstash.Starter - Sleeping for 1167ms
[WARN] 2013-02-19 19:26:03.175 [pool-2-thread-7] com.example.logstash.Starter - Sleeping for 7228ms
[WARN] 2013-02-19 19:26:03.175 [pool-2-thread-6] com.example.logstash.Starter - Sleeping for 1587ms
[WARN] 2013-02-19 19:26:03.175 [pool-2-thread-8] com.example.logstash.Starter - Sleeping for 9457ms
[WARN] 2013-02-19 19:26:03.176 [pool-2-thread-2] com.example.logstash.Starter - Sleeping for 1584ms
[INFO] 2013-02-19 19:26:05.687 [main] com.example.logstash.Starter - Result null
[INFO] 2013-02-19 19:26:05.687 [main] com.example.logstash.Starter - Result null
[ERROR] 2013-02-19 19:26:08.695 [main] com.example.logstash.Starter - null
java.util.concurrent.TimeoutException: null
 at java.util.concurrent.FutureTask$Sync.innerGet(FutureTask.java:258) ~[na:1.7.0_13]
 at java.util.concurrent.FutureTask.get(FutureTask.java:119) ~[na:1.7.0_13]
 at com.example.logstash.Starter.main(Starter.java:43) ~[classes/:na]
[ERROR] 2013-02-19 19:26:11.696 [main] com.example.logstash.Starter - null
java.util.concurrent.TimeoutException: null
 at java.util.concurrent.FutureTask$Sync.innerGet(FutureTask.java:258) ~[na:1.7.0_13]
 at java.util.concurrent.FutureTask.get(FutureTask.java:119) ~[na:1.7.0_13]
 at com.example.logstash.Starter.main(Starter.java:43) ~[classes/:na]
[INFO] 2013-02-19 19:26:11.696 [main] com.example.logstash.Starter - Result null
[INFO] 2013-02-19 19:26:11.696 [main] com.example.logstash.Starter - Result null
[INFO] 2013-02-19 19:26:11.697 [main] com.example.logstash.Starter - Result null
[INFO] 2013-02-19 19:26:12.639 [main] com.example.logstash.Starter - Result null
[INFO] 2013-02-19 19:26:12.639 [main] com.example.logstash.Starter - Result null
[INFO] 2013-02-19 19:26:12.639 [main] com.example.logstash.Starter - Result null
Now let’s see what Logstash can do for us. From the download section, we get the single JAR file: logstash-1.1.9-monolithic.jar. That’s all we need for now. Unfortunately, because of this bug on Windows we have to expand logstash-1.1.9-monolithic.jar somewhere, f.e. into logstash-1.1.9-monolithic folder. Logstash has just three concepts: inputs, filters and outputs. Those are very well explained into the documentation. In our case, the input is application’s log file, c:\tmp\application.log. But what would be the output? ElasticSearch seems to be an excellent candidate for that: let’s have our logs indexed and searchable any time. Let’s download and run it:
elasticsearch.bat -Des.index.store.type=memory -Des.network.host=localhost
Now we are ready to integrate Logstash which should tail our log file and feed it directly to ElasticSearch. Following configuration does exactly that (logstash.conf):
input {
    file {
        add_field => [ 'host', 'my-dev-host' ]
        path => 'c:\tmp\application.log'
        type => 'app'
        format => 'plain'
    }
}

output {
    elasticsearch_http {
        host => 'localhost'
        port => 9200
        type => 'app'
        flush_size => 10
    }
}

filter {
    multiline {
        type => 'app'
        pattern => '^[^\[]'
        what => 'previous'
    }
}
It might look not very clear on first glance but let me explain what is what. So the input is c:\tmp\application.log, which is a plain text file (format => ‘plain’). The type => ‘app’ serves as simple marker so the different types of inputs could be routed to outputs through filters with the same type. The add_field => [ ‘host’, ‘my-dev-host’ ] allows to inject additional arbitrary data into the incoming stream, f.e. hostname.
Output is pretty clear: ElasticSearch over HTTP, port 9200 (default settings). Filters need a bit of magic, all because of Java stack traces. The multiline filter will glue the stack trace to the log statement it belongs to so it will be stored as a single (large) multiline. Let’s run Logstash:
java -cp logstash-1.1.9-monolithic logstash.runner agent -f logstash.conf
Great! Now whenever we run our application, Logstash will watch the log file, filter it property and send out directly to ElasticSearch. Cool, but how can we do the search or at least see what kind of data do we have? Though ElasticSearch has awesome REST API, we can use another excellent project, Kibana, web UI front-end for ElasticSearch. Installation is very straightforward and seamless. After a few necessary steps, we have Kibana up and running:
ruby kibana.rb
By default, Kibana provides the web UI available on port 5601, let’s point our browser to it, http://localhost:5601/ and we should see something like that (please click on image to enlarge):
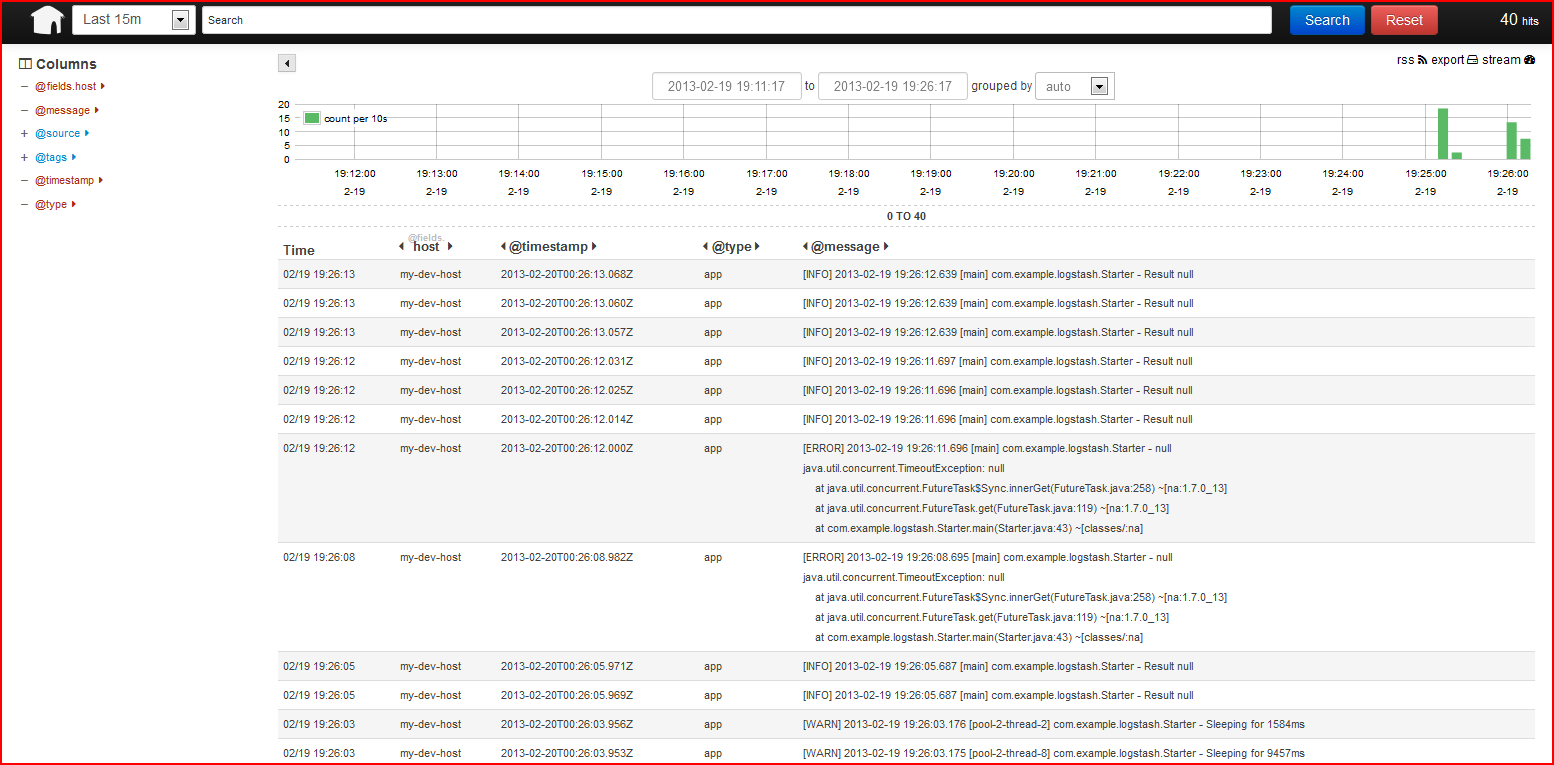
All our logs statements complemented by hostname are just there. Exceptions (with stack traces) are coupled with the related log statement. Log levels, timestamps, everything is being shown. Fulltext search is available out-of-the box, thanks to ElasticSearch.
It’s all awesome but our application is very simple. Would this approach work across multi-server / multi-application deployment? I am pretty sure it will work just fine. Logstash’s integration with Redis, ZeroMQ, RabbitMQ, … allows to capture logs from tens of different sources and consolidate them in one place. Thanks a lot, Logstash guys!
Reference: Your logs are your data: logstash + elasticsearch from our JCG partner Andrey Redko at the Andriy Redko {devmind} blog.

You should try logentries
windows path for me not working , its an open issue https://logstash.jira.com/browse/LOGSTASH-430
It worked for me, i just had to replace the value “http://”+window.location.hostname+”:9200″ with “http://127.0.0.1:9200” in Kibanas config.js (only for the evaluation purpose)
Brilliant I had been messing around with different scripts for weeks and this just is perfect. love they way it displays the whole message.
in line
1.7
is missing
1.7
(remove spaces)
Thank you, highlighter plugin scewed up the pom.xml. My apologies for that.
I am uploading data from a CSV file and here is Use case.
for a column, user can enter description, and I want to group the records in several categories based on description
for that I want to add one more column/field into elastic search. As no of fields to validate can vary, I have a csv file to validate it.
So is it possible to read a file inside filter/input/output. Other solution will also be fine.
Hi Krushnat,
Thanks a lot for your comment. Probably, CSV filter is what you are looking for: https://www.elastic.co/guide/en/logstash/current/plugins-filters-csv.html. Hope it helps, thanks!
Best Regards,
Andriy Redko
Thanks for this easy tutorial Andriy!!
There needs below changes in pom.xml-
1. end tag for ‘source’ is missing
2. groupid should be changed to groupId
3. sourceid should be changed to sourceId
*1. end tag for ‘source’ is missing at line no.35
Hi Rahul,
You are very right, my apologies for this mistypes. The XML tags got screwed up by syntax highlighter plugin.
Thank you.
Best Regards,
Andriy Redko