4 Hot Business Intelligence Trends: When Business Intelligence Meets Big Data (Part 1 of 4)
Business intelligence (BI), which is one of the oldest concepts in data processing, is undergoing a radical reinvention.
The concept has already evolved considerably since it first gained popularity in the early 1990s (and particularly since its first mention in the Cyclopædia of Commercial and Business Anecdotes in 1865!). In fact, the quest to mine transactional data for business insight has gone on since the earliest days of computing. Decision-support systems were deployed on mainframes in the 1960s. So-called “executive information systems” enjoyed a brief period of popularity in the 1980s, when IBM also coined the term “Information Center” to describe a class of intelligence-building tools. With the arrival of more powerful graphics on PCs in the 1990s, BI proliferated to business users market on track to become a $17 billion industry this year.
For most of its history, though, BI has been limited to analysis of internal data with a focus on improving operational efficiency. A classic example would be improving decisions about inventory allocation based upon historical data. But the promise of BI has always been about more than incremental gains. A seminal parable was a story first recounted in the Financial Times in 1996 about an unlikely association between sales of beer and diapers. It turned out that two products that had nothing to do with each other often sold in tandem. Although the details of the story have been wildly exaggerated over the years, the essential point is important: data analysis can reveal associations that aren’t obvious to human observers.
Until recently, BI has been mostly confined to internal data because of the lack of easy access to data from other sources in a harmonious format. But now things are changing. Big data platforms like Hadoop have made it possible to combine unstructured and structured data in ways that create unprecedented flexibility in querying and algorithmic manipulation
For example, social media channels such as Twitter and Instagram are essentially composed of unstructured data, but linguistic analysis, sentiment analysis, and semi-structured data types like hashtags, URLs, retweet labels and user handles can create a framework for understanding what’s being said. Once that structure is in place, it can be correlated with structured information in corporate databases. Search engines also bring an element of structure to free-form data in the ways in which they index and store text strings as data elements. In fact, Hadoop is based upon search engine constructs.
The merger of structured and unstructured data is opening up vast new horizons for BI. For example, we can now monitor what customers and partners are saying about our companies and our competitors and compare it to sales patterns. We can incorporate published third-party research and a multitude of cloud-based external databases published on a pay-as-you-go basis to build more complete profiles of our customers and markets. And we can combine all these things is a multitude of ways for multidimensional analysis and what-if querying.
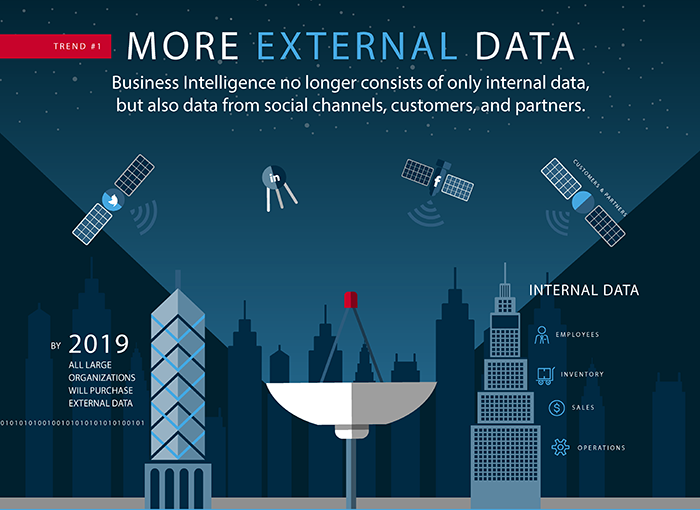
BI is also becoming more accessible to the broad audience of business users. Companies like Tableau are building visualization engines that make it possible for people without a data science background to mix together data from multiple sources and graph interdependencies. Specialty services are emerging that deliver analytics in the cloud for vertical or functional use. Many of these services aggregate data from hundreds of sources, saving customers the trouble of finding and licensing that information and enabling them to blend it with their own operational data. IDC estimates that 70% of large organizations already purchase external data and 100% will do so by 2019.
The need for structure
This smorgasbord of new data sources does create some organizational and governance challenges. Until about five years ago the BI function typically lived within the IT organization. Users defined their data needs, and IT pros took care of extracting, transforming and loading (ETL) everything into the analytics engine. The process was structured and predictable, but there was a limited amount of insight that could be gained from the limited data set.
This legacy process isn’t well-suited for the new dynamic in which users want to experiment with unconventional data sources and combinations, such as correlating hashtags and weather patterns with purchase behavior. The “Data lake” is an increasingly popular approach to addressing these demands. Think of data lakes as staging areas for analytics. Using a low cost and scalable storage layer like Hadoop, organizations can pour data from many sources into a common pool using metadata and unique identifiers for basic organization. Users can extract subsets of this data into their analytical models for experimentation without going through the time and trouble of creating a formalized schema.
Data lakes have several strengths. They easily handle multiple sources and formats without requiring a time-consuming schema definition. Their low cost enables users to experiment with new sources without incurring overhead. And they are natural transitional stage to models for the formal data warehouse.
Data lakes typically house three categories of data: raw, derived and aggregated. All three can be combined in the same place and served up to different applications. Data lakes can be used as data warehouse staging areas to transition raw data into detailed records, with the side benefit of having the historical raw data still available. In this way, the data lake can both feet and back up the data warehouse.
This approach is giving way to a new form of business intelligence sometimes called “agile or exploratory BI.” Business-side analysts can work with unstructured or semi-structured data in a sandbox environment to discover useful new information sources. Those can then be extracted into a formal schema. Thanks to the economics of big data, a large variety of sources can be tested and raw data need never be discarded.
While you don’t need a data lake to enable big data analytics, it surely helps to have one. Here are a few guidelines to keep in mind:
- Rethink data for the long term. The barriers to acquiring and storing data have been lowered, meaning that you can now affordably ingest more data sources into the data lake and keep them longer. When combined with the YARN resource manager, Hadoop can serve many diverse workloads simultaneously. Think of your data lake as a central repository for multiple applications. This reduces duplication and ETL effort.
- Put governance measures in place over issues like ownership, stewardship, roles and delegation rights. Making clear at the outset how data will be used and by whom prevents a lot of confusion later.
- Tackle security at the outset, keeping in mind that different kinds of data demand different security parameters. For example, detailed transaction records probably need both encryption and two-factor authentication while summary records may require little security at all. Consider partitioning the data lake into separate security zones to make administration easier.
Learn more by downloading the free book: The Definitive Guide to BI and Analytics on a Data Lake
| Reference: | 4 Hot Business Intelligence Trends: When Business Intelligence Meets Big Data (Part 1 of 4) from our JCG partner Sameer Nori at the Mapr blog. |
