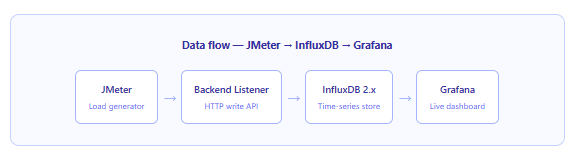
Running a load test without real-time visibility is a bit like flying a plane without instruments. JMeter produces rich performance data — response times, throughput, error rates, active threads — but by default that data only becomes visible after the test finishes, buried in a .jtl result file. For long-running tests, that means you could be 40 minutes into a two-hour soak test before you realise that error rates spiked 20 minutes ago and the system has been degraded ever since.
The solution is a monitoring stack that processes JMeter’s metrics as they are generated, stores them in a time-series database, and renders them in a live dashboard. The combination of InfluxDB and Grafana has become the standard way to do this, and once the pipeline is in place it transforms how your team interprets load test results — in real time, together, on a shared screen.
In this article we walk through the entire setup end-to-end, using InfluxDB 2.x and the latest JMeter Backend Listener configuration. By the end you will have a live Grafana dashboard updating every five seconds during every test run.
Why This Stack, and Why InfluxDB 2.x?
InfluxDB is purpose-built for time-series data — the kind of high-frequency, timestamped metrics that JMeter emits continuously during a test. Unlike a relational database, InfluxDB is optimised for fast writes and range queries over time windows, which is exactly what Grafana needs to render a rolling five-second view of throughput or latency. Furthermore, its data model maps naturally onto JMeter’s output: measurements, tags (sampler name, test title, node), and fields (response time, bytes, error count) slot directly into InfluxDB’s line protocol.
InfluxDB 2.x specifically is worth targeting over the older 1.x line for two reasons. First, it ships a new query language called Flux that is considerably more expressive than InfluxQL for shaping time-series data. Second, its authentication model uses tokens and organisations rather than plain username/password, which is both more secure and more CI/CD-friendly. Additionally, the JMeter Backend Listener has supported the InfluxDB v2 API endpoint natively since JMeter 5.2, so no plugin is required for the basic setup.
Step 1 — Install and Configure InfluxDB 2.x
1InfluxDB setup
The fastest way to get InfluxDB 2.x running locally is with Docker. The following command pulls the official image, maps the default API port, and mounts a local volume so your data survives container restarts.
# Pull and start InfluxDB 2.x
docker run -d \
  --name influxdb \
  -p 8086:8086 \
  -v influxdb-storage:/var/lib/influxdb2 \
  influxdb:2.7

# Verify it is running
curl -i http://localhost:8086/health
# Expected: HTTP/1.1 200 OK  {"name":"influxdb","message":"ready for queries and writes",...}
Once the container is up, open http://localhost:8086 in your browser. The first-run wizard walks you through setting an admin username, password, initial organisation name, and your first bucket. Use these values — you will need them in every subsequent step:
| Field | Suggested value | Used in |
|---|---|---|
| Organisation | perf-team | JMeter listener, Grafana data source |
| Bucket | jmeter | JMeter listener, Grafana queries |
| Retention | 30 days | InfluxDB storage policy |
After the wizard completes, navigate to Data → API Tokens → Generate API Token → All Access Token. Copy the token immediately — it is shown only once. Store it somewhere safe; you will need it for both JMeter and Grafana.
Production note: An All Access token is convenient for local development. For CI/CD or shared environments, generate a scoped Read/Write token restricted to the jmeter bucket only. This limits the blast radius if the token is ever exposed.
Step 2 — Configure the JMeter Backend Listener
2JMeter configuration
The Backend Listener is the component that streams JMeter metrics to InfluxDB as the test runs. It works by batching sample results and writing them to InfluxDB’s HTTP write API on a configurable interval — the default is every five seconds. Importantly, the Backend Listener runs in a separate thread and has a negligible impact on JMeter’s load generation, so it does not skew your test results.
To add it in the JMeter GUI, right-click on your Thread Group, then go to Add → Listener → Backend Listener. Set the parameters as follows:
| Parameter | Value |
|---|---|
| Backend Listener implementation | org.apache.jmeter.visualizers.backend.influxdb.InfluxdbBackendListenerClient |
influxdbUrl | http://localhost:8086/api/v2/write?org=perf-team&bucket=jmeter |
influxdbToken | Your API token (add via the Add button — it does not appear in the default parameter list) |
application | Name of the system under test, e.g. checkout-service |
measurement | jmeter |
summaryOnly | false — set to true only if you want a single aggregate row per interval |
samplersRegex | .* — captures all samplers; narrow with a regex to exclude internals |
percentiles | 95;90;75;50 |
testTitle | ${__time(yyyyMMdd-HHmm)}-checkout |
The testTitle parameter is one of the most important settings to get right. It is stored as a tag on every data point written to InfluxDB, which means your Grafana dashboard can filter by test run. Using a time-based value like ${__time(yyyyMMdd-HHmm)} ensures every run gets a unique, human-readable label automatically — without requiring any manual change to the test plan before each execution.
InfluxDB v2 vs v1 URL format: Note that the v2 API endpoint is
/api/v2/writewithorgandbucketas query parameters. This is different from the v1 format/write?db=jmeter. If you are migrating from an older setup, this is the most common point of confusion.
Running in Non-GUI Mode (Recommended)
JMeter’s own documentation recommends running actual load tests in non-GUI mode. The GUI consumes significant CPU and memory to render its interface, which can directly inflate the response times your test records. Non-GUI mode runs the same test plan headlessly, freeing all resources for load generation. The Backend Listener works identically in both modes.
# Run a JMeter test in non-GUI mode with the Backend Listener active
# (the Backend Listener is embedded in the .jmx file — no extra flag needed)

# Linux / macOS
./bin/jmeter.sh \
  -n \
  -t test-plans/checkout-load.jmx \
  -l results/run-$(date +%Y%m%d-%H%M).jtl \
  -j logs/jmeter-$(date +%Y%m%d-%H%M).log

# Windows
# jmeter.bat -n -t test-plans\checkout-load.jmx -l results\run.jtl -j logs\jmeter.log

# Flags explained:
#   -n   non-GUI mode
#   -t   path to the test plan (.jmx)
#   -l   output result file (.jtl) for post-test analysis
#   -j   JMeter log file
As soon as the test starts, the Backend Listener begins writing to InfluxDB. Within five seconds of the first samples being collected, data will be flowing into your jmeter bucket and ready for Grafana to read.
Step 3 — Install Grafana and Connect InfluxDB
3Grafana setup
Like InfluxDB, Grafana runs cleanly as a Docker container for local use. The default port is 3000 and the initial credentials are admin / admin.
# Start Grafana
docker run -d \
  --name grafana \
  -p 3000:3000 \
  grafana/grafana:latest

# Open http://localhost:3000 in your browser
# Login: admin / admin  (you will be prompted to change the password)
Once logged in, navigate to Connections → Data sources → Add data source and select InfluxDB. The configuration fields that matter are shown below. Critically, set the query language to Flux — not InfluxQL — since InfluxDB 2.x’s native query language is Flux and it gives you far more flexibility when building dashboard panels.
| Grafana field | Value |
|---|---|
| Query language | Flux |
| URL | http://localhost:8086 (or your InfluxDB host) |
| Organization | perf-team |
| Token | Your InfluxDB API token |
| Default bucket | jmeter |
Click Save & Test. A green banner reading “datasource is working” confirms the connection. If it fails, the most common causes are a mistyped token or Grafana being unable to reach InfluxDB’s port — double-check both before proceeding.
Step 4 — Build Your Grafana Dashboard
4Dashboard panels
The quickest path to a working dashboard is to import one of the community templates from grafana.com/grafana/dashboards. Dashboard 17472 (JMeter test results — InfluxDB2 Standard Listener) is maintained by the PerForge team and maps directly to the Backend Listener configuration above. Go to Dashboards → Import, enter 17472, and select your InfluxDB data source. You will have a fully populated dashboard in under a minute.
However, understanding how to write your own Flux queries is what lets you build panels tailored to your specific test. The following queries are the most useful ones to have on hand.
Average Response Time (rolling window)
from(bucket: "jmeter")
  |> range(start: v.timeRangeStart, stop: v.timeRangeStop)
  |> filter(fn: (r) => r._measurement == "jmeter")
  |> filter(fn: (r) => r._field == "avg")
  |> filter(fn: (r) => r.statut == "all")
  |> aggregateWindow(every: 5s, fn: mean, createEmpty: false)
  |> yield(name: "avg_response_time")
Throughput — Requests Per Second
from(bucket: "jmeter")
  |> range(start: v.timeRangeStart, stop: v.timeRangeStop)
  |> filter(fn: (r) => r._measurement == "jmeter")
  |> filter(fn: (r) => r._field == "count")
  |> filter(fn: (r) => r.statut == "all")
  |> derivative(unit: 1s, nonNegative: true)
  |> yield(name: "requests_per_second")
Error Rate Percentage
from(bucket: "jmeter")
  |> range(start: v.timeRangeStart, stop: v.timeRangeStop)
  |> filter(fn: (r) => r._measurement == "jmeter")
  |> filter(fn: (r) => r._field == "errorPct")
  |> aggregateWindow(every: 5s, fn: mean, createEmpty: false)
  |> yield(name: "error_rate")
For the error rate panel, set a threshold in the panel’s Overrides section — for example, colour the value red when it exceeds 1%. This transforms the panel from a passive display into an active signal that demands attention during a test run, which is precisely the point of real-time monitoring.
Dashboard tip: Set the Grafana time range to Last 15 minutes with auto-refresh every 5 seconds during an active test. This gives a rolling window that tracks what is happening right now rather than scrolling back through the full test history.
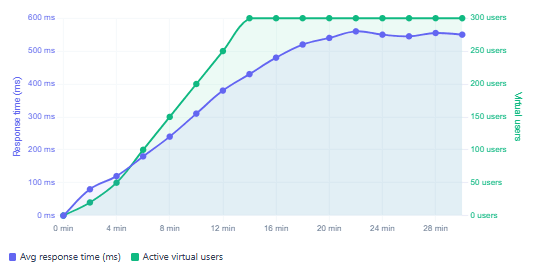
Typical JMeter load test metrics over a 30-minute ramp + sustained run
Key Metrics to Display on Your Dashboard
Not all metrics are equally useful at a glance. During an active test, the panels that give you the fastest signal about system health are a specific set. The table below lists the recommended panels and what each one tells you in practice.
| Panel | Field in InfluxDB | What it reveals |
|---|---|---|
| Average response time | avg | Overall latency trend — rising slope is the first sign of saturation |
| 95th percentile response time | pct95.0 | Tail latency — what slow users experience; often degrades before the average |
| Requests per second | count + derivative | Actual throughput delivered — drop signals a bottleneck or error storm |
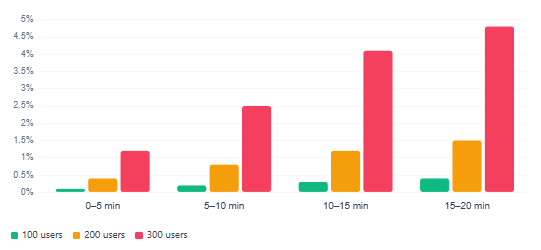
| Error rate % | errorPct | Immediate failure signal; any sustained value above 1% warrants investigation |
| Active virtual users | minAT / maxAT | Confirms the ramp profile is executing as designed |
| Response time by sampler | avg grouped by transaction | Isolates which endpoint is the bottleneck under load |
| Bytes sent / received | sentBytes / receivedBytes | Flags unexpected payload size changes or network saturation |
Sending Test Annotations to Grafana
One of the more powerful features of this stack is that JMeter automatically writes test lifecycle events — test start, test end, and virtual user ramp events — to InfluxDB as a separate measurement called events. When Grafana is configured to read this measurement as an annotation source, these events appear as vertical lines on every time-series panel, instantly showing you where each phase of the test began and ended without any manual cross-referencing.
To enable this, add an Annotation query in your Grafana dashboard settings under Annotations → Add annotation query with the following Flux query:
from(bucket: "jmeter")
  |> range(start: v.timeRangeStart, stop: v.timeRangeStop)
  |> filter(fn: (r) => r._measurement == "events")
  |> filter(fn: (r) => r._field == "text")
  |> rename(columns: {_value: "text", _time: "time"})
With this in place, every time you start or stop a JMeter test, a labelled annotation appears across all your panels simultaneously. It sounds like a small detail, but in practice it significantly reduces the time spent mentally correlating timestamps when reviewing a test after the fact.
Error rate behaviour across three load levels
Production Best Practices
Getting the stack running locally is one thing. Making it reliable in a CI/CD pipeline or shared team environment requires a few additional considerations that are easy to overlook until something goes wrong.
| Practice | Why it matters |
|---|---|
Always run JMeter in non-GUI mode (-n) | GUI overhead inflates response times and reduces the accuracy of your load results |
Set a unique testTitle per run | Enables filtering by run in Grafana — essential when multiple tests share the same bucket |
| Use scoped API tokens, not All Access | Limits exposure if a token leaks in CI logs or environment variables |
| Set a bucket retention policy | Prevents unbounded disk growth; 30 days covers most trend-analysis needs |
Match backend_influxdb.send_interval to Grafana refresh | Default is 5s; increasing to 10–30s reduces InfluxDB write load for high-TPS tests |
| Co-locate InfluxDB close to JMeter | Network latency between JMeter and InfluxDB adds overhead to every metric write |
Use samplersRegex to filter noise | Exclude internal JMeter samplers (e.g. JSR223 scripts) from the metrics stream |
| Pair with post-test HTML report | Run jmeter -g results.jtl -o report/ after the test for a complete offline summary |
Docker Compose shortcut: Rather than starting InfluxDB and Grafana as separate containers, define both services in a single docker-compose.yml file with a shared network. This way the entire monitoring stack starts and stops with one command — ideal for spinning up a clean environment before each test campaign and tearing it down afterwards.
docker-compose.yml for the Full Stack
# docker-compose.yml — start the full monitoring stack
version: "3.8"
services:
  influxdb:
    image: influxdb:2.7
    ports:
      - "8086:8086"
    volumes:
      - influxdb-data:/var/lib/influxdb2
    environment:
      DOCKER_INFLUXDB_INIT_MODE:        setup
      DOCKER_INFLUXDB_INIT_USERNAME:    admin
      DOCKER_INFLUXDB_INIT_PASSWORD:    changeme123
      DOCKER_INFLUXDB_INIT_ORG:         perf-team
      DOCKER_INFLUXDB_INIT_BUCKET:      jmeter
      DOCKER_INFLUXDB_INIT_RETENTION:   30d

  grafana:
    image: grafana/grafana:latest
    ports:
      - "3000:3000"
    depends_on:
      - influxdb
    volumes:
      - grafana-data:/var/lib/grafana

volumes:
  influxdb-data:
  grafana-data:

# Start everything:  docker compose up -d
# Stop everything:   docker compose down
With the DOCKER_INFLUXDB_INIT_* environment variables set, InfluxDB performs its first-run setup automatically on container start. No manual wizard required — which makes this compose file suitable for use in a CI pipeline where the monitoring stack needs to be ephemeral.
What We Learned
We built a complete real-time JMeter monitoring pipeline from scratch. Starting from why post-test result files are insufficient for long-running or collaborative load tests, we installed InfluxDB 2.x, created an organisation, bucket, and API token, then configured JMeter’s built-in InfluxdbBackendListenerClient to stream metrics to InfluxDB’s v2 HTTP write API every five seconds.
We connected Grafana to InfluxDB using the Flux query language, wrote the three most important Flux queries — average response time, throughput in requests per second, and error rate percentage — and recommended the community dashboard 17472 as a ready-made starting point. We also covered test annotations, which surface test lifecycle events as vertical markers on every Grafana panel, and wrapped up with a full Docker Compose file that brings the entire stack up in a single command. The production best practices table distils the key habits — non-GUI mode, scoped tokens, unique test titles, and retention policies — that turn a working local setup into something reliable enough to run in a CI/CD pipeline before every release.
