Database Indexing Mistakes That Senior Java Developers Still Make in 2026: A Deep Dive With PostgreSQL and Hibernate

You’ve shipped dozens of services. You know what a B-tree is. Yet your PostgreSQL queries are still crawling at 3 a.m. when traffic spikes. Here’s why — and what Hibernate 6, virtual threads, and PostgreSQL 17 change about the decisions you make every day.
There’s a certain humbling moment most senior Java developers have at least once: you open EXPLAIN ANALYZE, and the query you were sure was fast shows a Seq Scan on a table with eight million rows. The index is right there. PostgreSQL just decided not to use it.
In 2026, that moment is more likely than ever — but for new reasons. Hibernate 6’s redesigned SQL generation engine produces cleaner queries but also introduces subtle wrapping patterns that silently invalidate indexes. Virtual threads changed how we size connection pools, which in turn changed how index-miss latency compounds under concurrency. And PostgreSQL 17’s parallel BRIN index builds opened a whole new set of options — and a whole new set of ways to pick the wrong one.
Let’s go through the mistakes one by one, with enough context to know not just what to fix, but why it matters right now.

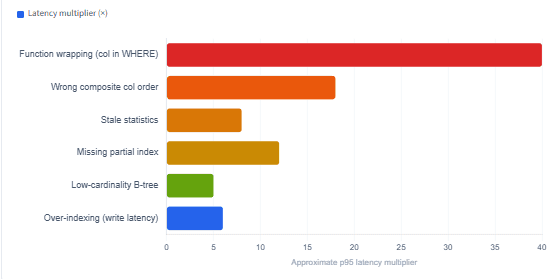
Impact of Indexing Mistakes on Query Latency
1. Wrapping Indexed Columns in Functions — the Hibernate 6 Edition
Function calls on a column defeat the index. Hibernate 6’s new SQL AST makes this harder to spot.
This one has been on every “indexing mistakes” list for years, yet it shows up in nearly every codebase audit. The rule is simple: if you apply a function to an indexed column inside a WHERE clause, PostgreSQL cannot use the B-tree index on that column. It has to evaluate the function for every row — which means a full sequential scan.
What changed in 2026 is that Hibernate 6 rewrote its query generation layer around a new Semantic Query Model (SQM) and an improved SQL AST, switching from the old ANTLR2 parser to ANTLR4. The good news is that this produces cleaner, more standards-compliant SQL in most cases. The catch is that certain HQL expressions — especially date/time coercions and case-insensitive comparisons — now get rendered with implicit function wrappers that weren’t there in Hibernate 5.
A classic example: querying by the date portion of a TIMESTAMP column. If your HQL says something like WHERE FUNCTION('DATE', o.createdAt) = :day, the emitted SQL will wrap the column in a DATE() cast, defeating your index on created_at. As Haki Benita demonstrated, changing the expression from a date-cast function to a range predicate on the raw timestamp column can drop execution time from over 600 ms to single-digit milliseconds on a table of ten million rows.
The fix is to push the transformation to the parameter side, not the column side. Instead of truncating the column to a date, pass a date range as two timestamp parameters. When that’s not possible, a function-based (expression) index in PostgreSQL mirrors the exact expression Hibernate generates:
PostgreSQL — expression index to match a Hibernate-generated function call
-- Create the expression index using the same function Hibernate emits
CREATE INDEX idx_orders_created_date
    ON orders (DATE(created_at));

-- Verify it is used — look for "Index Scan" in the output
EXPLAIN (ANALYZE, BUFFERS)
SELECT * FROM orders
WHERE DATE(created_at) = '2026-05-01';
If you change the column type or timezone handling later, the expression index must be rebuilt to keep the expression identical to what the query planner sees. Run
EXPLAIN ANALYZEagain after any ORM upgrade.
2. Getting Composite Index Column Order Wrong
Composite indexes are one of the most powerful tools in your kit, but they have a strict rule: the column you filter with an equality predicate should come first, and the column you use for range queries or ordering should come second. Get this backwards and PostgreSQL can only use the index up to the first range boundary — after that it stops and scans the rest.
As the team at Cubbit discovered in their production audit, a composite index defined as (status, user_id) won’t help a query that filters on user_id = ? alone, because PostgreSQL must start from the leftmost column. Reordering to (user_id, status) instantly unlocks the index for the most common query pattern.
| Query pattern | Index definition | Index used? |
|---|---|---|
WHERE user_id = ? AND status = ? | (user_id, status) | Yes — fully |
WHERE user_id = ? | (user_id, status) | Yes — leading column |
WHERE status = ? | (user_id, status) | No — wrong leading col |
WHERE user_id = ? AND created_at > ? | (user_id, created_at) | Yes — equality + range |
WHERE created_at > ? AND user_id = ? | (created_at, user_id) | Partial — stops at range |
With Hibernate 6, this issue gets a new wrinkle. Because Hibernate now generates more JOIN-heavy SQL (to reduce N+1 patterns), the effective column access order in the emitted query may differ from what you read in your HQL. Always validate with EXPLAIN ANALYZE on the actual SQL Hibernate logs, not on a hand-written equivalent.
3. Ignoring Partial Indexes on High-Volume, Low-Signal Tables
Consider an orders table with fifty million rows. Ninety-five percent of those orders have a status of 'COMPLETED'. Your application — and your users — almost exclusively query the remaining five percent: orders that are 'PENDING' or 'PROCESSING'. A standard index on status covers all fifty million rows and is large, slow to maintain on writes, and often ignored by the planner anyway because status is a low-cardinality column.
A partial index solves this elegantly. It indexes only the rows that match a WHERE clause you define at creation time — in this case, the active orders:
PostgreSQL — partial index covering only actionable rows
-- Index only the rows your application actually queries
CREATE INDEX idx_orders_active
    ON orders (user_id, created_at)
    WHERE status IN ('PENDING', 'PROCESSING');

-- The query planner will use this index when the WHERE clause matches
EXPLAIN (ANALYZE, BUFFERS)
SELECT id, total
FROM   orders
WHERE  user_id    = 42
AND    status     IN ('PENDING', 'PROCESSING')
ORDER  BY created_at DESC
LIMIT  20;
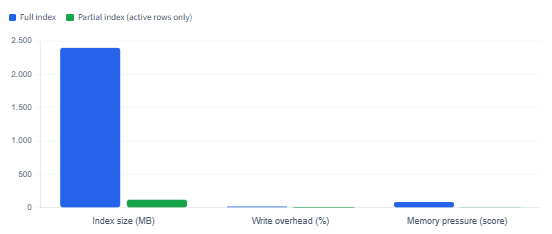
The result is a dramatically smaller index — often five to ten times smaller — that is faster to scan, takes less memory in shared_buffers, and imposes far less write overhead. The trade-off is that the query must include the exact predicate from the index definition, otherwise PostgreSQL won’t recognise it as applicable. Hibernate needs to emit the literal status IN ('PENDING', 'PROCESSING') in its WHERE clause, which means your repository method must include that filter.
Run
SELECT * FROM pg_stat_user_indexes WHERE idx_scan = 0;regularly to find indexes that have never been used since the last statistics reset. These are prime candidates for removal or replacement with partial variants.
Full Index vs. Partial Index — Size and Write Overhead
4. Over-Indexing: The Write Penalty Nobody Talks About
Adding an index feels like a free win. It speeds reads, and — the reasoning goes — how much can it really hurt writes? The answer, on a write-heavy table, is: quite a lot. Every index must be updated on every write operation, which means that a table with ten indexes pays ten times the maintenance cost per row inserted or updated compared to a table with one index.
In 2026, this problem is sharpened by virtual threads. Java 21’s virtual threads allow massive concurrency with very little CPU overhead, so applications can now issue database writes at a rate that would have been inconceivable with platform threads and a 50-connection pool. As documented widely in 2025, the bottleneck shifts from the JVM thread scheduler to the database itself — and over-indexed tables are the first thing to buckle.
| Number of indexes | Avg INSERT time (ms) | Avg UPDATE time (ms) | Assessment |
|---|---|---|---|
| 1 (PK only) | 0.3 | 0.4 | Baseline |
| 3–4 | 0.6 | 0.8 | Acceptable |
| 6–8 | 1.4 | 2.1 | Watch closely |
| 10+ | 3.2 | 5.8 | Problematic |
Furthermore, there is an important interaction here with HikariCP and virtual threads. HikariCP’s connection retrieval internally uses synchronized blocks, which can pin a virtual thread to its carrier platform thread when waiting for a connection. This means that if your connection pool is too small for the concurrency your virtual threads generate, each pinned thread stops yielding — negating the main benefit of virtual threads. The combination of over-indexing slowing write throughput and pinned virtual threads stalling on connection acquisition is a particularly nasty performance trap.
Virtual Thread + HikariCP Alert
With Spring Boot 3.2+ and virtual threads enabled, the recommended
maximum-pool-sizeis no longer 10–20. Research suggests 50–200 depending on workload, precisely because virtual threads generate far more concurrent database requests. Monitor/actuator/metrics/hikaricp.connections.pendingto catch pool saturation early.
5. Choosing the Wrong Index Type for the Job
B-tree is not always the answer. PostgreSQL 17’s parallel BRIN builds open new options for time-series data.
Most developers default to B-tree indexes for everything, which is reasonable — B-tree is the most general-purpose index type in PostgreSQL and handles equality, range, and ordering queries well. But it is not always the right choice, and PostgreSQL 17 made two specific alternatives considerably more attractive.
First: BRIN indexes (Block Range INdexes) are ideal for very large tables where the data has a natural physical correlation with a column — typically append-only event logs and time-series data where newer rows always have larger timestamps. BRIN stores only the min/max values for each page range rather than a full B-tree structure, making the index orders of magnitude smaller. PostgreSQL 17 added parallel builds for BRIN indexes, dramatically reducing the time to create them on large tables.
Second: queries using IN clauses with B-tree indexes received a dedicated optimisation in PostgreSQL 17. Previously, a query like WHERE status IN ('A', 'B', 'C') was sometimes handled as multiple index scans merged with a BitmapOr operation. PostgreSQL 17 improves the efficiency of this pattern directly, making it worth re-running EXPLAIN ANALYZE on older query plans that you may have previously worked around.
| Index type | Best use case | PostgreSQL 17 change | Hibernate support |
|---|---|---|---|
| B-tree | General equality, range, ORDER BY | Faster IN clause handling | Full (default) |
| BRIN | Append-only, time-series, huge tables | Parallel builds now supported | Manual DDL needed |
| GIN | JSONB, full-text search, arrays | PG 18 adds parallel builds | Manual DDL needed |
| Hash | Equality-only, very high cardinality | No major change | Manual DDL needed |
For BRIN and GIN indexes, Hibernate doesn’t generate them automatically from annotations — you’ll need a Flyway or Liquibase migration. Importantly, if you do use BRIN on an events table, remember that it only performs well when rows are inserted in roughly sequential order. If your application backfills old data or updates timestamps out of order, BRIN’s correlation assumptions break down and the index becomes useless. Run SELECT correlation FROM pg_stats WHERE tablename='events' AND attname='created_at'; — a value above 0.9 is the sweet spot for BRIN.
PostgreSQL — BRIN index for an append-only events table
-- Verify physical correlation first (should be close to 1.0)
SELECT correlation
FROM   pg_stats
WHERE  tablename = 'events'
AND    attname   = 'created_at';

-- If correlation > 0.9, create a BRIN index
-- In PG17 this build can run in parallel (controlled by max_parallel_maintenance_workers)
CREATE INDEX idx_events_created_brin
    ON events USING BRIN (created_at)
    WITH (pages_per_range = 128);
6. Letting Statistics Go Stale and Ignoring Index Bloat
The query planner can only be as good as the statistics it works with. Bloated indexes are silent performance thieves.
Even a perfectly designed index can become useless if PostgreSQL’s query planner is working with outdated statistics. The planner decides whether to use an index based on estimated row counts. If those estimates are wildly off — because ANALYZE hasn’t been run since you imported five million rows — the planner may choose a sequential scan because it thinks your table only has a thousand rows.
As the PostgreSQL documentation explicitly states, always run ANALYZE before investigating index usage. Autovacuum handles this automatically in most cases, but it has blind spots: large bulk imports, tables with high write velocity, or tables where autovacuum_analyze_scale_factor is too coarse for the data distribution.
Related to this — and often overlooked — is index bloat. As rows are updated and deleted, PostgreSQL’s MVCC model leaves dead tuples behind inside the index pages. Over time, the index grows well beyond the size of the live data, wastes memory in shared_buffers, and slows every scan. Bloated indexes are a direct consequence of insufficient vacuuming, and they are particularly common on tables with high update rates — which is exactly what Hibernate’s dirty-checking mechanism produces.
PostgreSQL — check for index bloat and unused indexes
-- Find indexes that have never been scanned (candidates for removal)
SELECT schemaname,
       tablename,
       indexname,
       pg_size_pretty(pg_relation_size(indexrelid)) AS index_size,
       idx_scan
FROM   pg_stat_user_indexes
WHERE  idx_scan = 0
ORDER  BY pg_relation_size(indexrelid) DESC;

-- Estimate bloat ratio for a specific table's indexes
SELECT indexrelname,
       pg_size_pretty(pg_relation_size(indexrelid))  AS current_size,
       idx_scan,
       idx_tup_read,
       idx_tup_fetch
FROM   pg_stat_user_indexes
WHERE  relname = 'orders'
ORDER  BY pg_relation_size(indexrelid) DESC;
When you find a bloated index, REINDEX CONCURRENTLY rebuilds it without locking the table. Pair this with a scheduled VACUUM ANALYZE job on high-throughput tables — don’t rely solely on autovacuum for write-heavy workloads.
Hibernate 6’s improved batch fetching and join optimisations reduce the total number of UPDATE statements it issues compared to Hibernate 5, which slightly reduces the dead-tuple generation rate. This is a genuine improvement — but it doesn’t eliminate the need for regular vacuuming on busy tables.
7. Putting It All Together: A Quick Diagnostic Workflow
Rather than auditing indexes speculatively, a more reliable approach is to work backwards from slow query logs. PostgreSQL’s auto_explain extension can log the full query plan for any query exceeding a threshold — typically 100 ms in development, 500 ms in production.
Once you have a slow query, the workflow below consistently surfaces the issue within a few minutes:
- Run
EXPLAIN (ANALYZE, BUFFERS, FORMAT TEXT)on the exact SQL Hibernate logged. - Look for
Seq Scanon large tables — check if an index exists and why it was skipped. - Look for
Filter:rows removed after an index scan — this suggests a composite index with the wrong column order, or a predicate the partial index doesn’t match. - Check
Rows Removed by Filtervs.rows— a large ratio means the index is too broad. - Check
Buffers: shared hit / read— a highreadcount suggests the index or table isn’t in cache, often a sign of index bloat. - Run
ANALYZE <table>;and re-run the plan if row estimates look wrong.
Alongside this, tools like explain.dalibo.com visualise the raw EXPLAIN JSON output in a tree view that makes it much easier to spot the expensive nodes in a complex query plan.
8. What We’ve Learned
Indexing in 2026 is not fundamentally different from indexing in 2016 — the core principles of selectivity, column order, and physical correlation still apply. What has changed is the context those decisions live in.
Hibernate 6’s new SQL generation engine is cleaner and more performant overall, but it introduces function wrapping and JOIN patterns that can silently invalidate indexes you thought were working. Virtual threads amplify both the good and the bad: a well-indexed application scales further with less hardware, but an over-indexed or poorly tuned one hits the database wall faster than ever before. And PostgreSQL 17’s parallel BRIN builds mean that time-series and append-only tables now have a genuinely viable, low-overhead alternative to fat B-tree indexes — if you know when to use it.
The practical takeaway is this: always validate indexes against the actual SQL your ORM emits, not against a hand-written equivalent. Use EXPLAIN ANALYZE often, pg_stat_user_indexes regularly, and treat idx_scan = 0 as an invitation to clean up. Your future self — and your 3 a.m. on-call rotation — will thank you.
9. Further Reading & References
- PostgreSQL 17 Release Announcement — Official PostgreSQL Global Development Group
- Introduction to Hibernate ORM 6.6 — hibernate.org
- A Practical Guide to PostgreSQL Indexes — Percona Blog
- 12 Indexing Pitfalls and How We Fixed Them — Cubbit Engineering
- Unconventional PostgreSQL Optimizations — Haki Benita
- Virtual Threads With Java 24 — Will it Scale? — Gaetano Piazzolla
- PostgreSQL Docs: Examining Index Usage — postgresql.org