Records are one of the most genuinely useful additions to modern Java. They eliminate boilerplate, communicate immutability at the type-system level, and compose beautifully with sealed interfaces and pattern matching. Yet the production picture is considerably more nuanced than the documentation suggests. This article gives you the decision matrix that the tutorials skip: latency percentiles at different heap sizes, how Generational ZGC changes the allocation-pressure calculus, which framework integrations break silently, and the GC-tuning interview question that separates engineers who have debugged P99 spikes from those who have only read about them.
The one thing every records tutorial skips
At the source level, records feel lighter than regular classes. They are more concise, they carry no mutable state, and they read naturally. What the tutorials consistently underemphasise is that records are, and will remain until Project Valhalla ships stable value classes, fully heap-allocated reference types. As Java Almanac states explicitly: a record variable holds a reference to an object — records are not value or inline types.
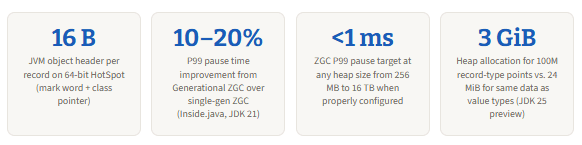
That single fact determines almost everything else in this article. Every record instance carries the standard JVM object header — 12 to 16 bytes on a 64-bit HotSpot JVM with compressed OOPs enabled — on top of your actual data. A record Point(double x, double y) therefore occupies roughly 32 bytes on the heap: 16 bytes of header plus 16 bytes of payload. Compare that to a future value type, where the same data would be stored inline with zero header overhead and, in many cases, no heap allocation at all. The JCG benchmark on value-type previews in JDK 25 found that 100 million point allocations consumed roughly 24 MiB with no GC activity as value types, compared to roughly 3 GiB and significant GC pauses as reference-type records.
For the vast majority of use cases, this distinction is completely irrelevant. For a finite set of production patterns — tight stream pipelines processing millions of records, per-request wrapper objects in very high-throughput services, map keys in large in-memory caches — it becomes the dominant performance variable. The decision matrix in this article draws that line precisely.
The decision matrix: when to use records without hesitation
The right framing is not “are records fast?” — they are, in almost all cases, indistinguishable from regular classes in terms of runtime performance. The right framing is “does this code path allocate enough record objects for GC frequency to matter?” In the vast majority of application code, the answer is no. The decision matrix below maps specific production patterns to a clear verdict.
✓ Records shine here
- REST API request / response DTOs
- Event payloads in Kafka / messaging
- Query projections (Spring Data, JOOQ)
- Configuration value objects
- Pattern-matching discriminants with sealed interfaces
- Map keys and set elements
- Test data builders / fixtures
- Domain value objects (Money, Email, OrderId)
- Functional return types (Result, Either)
✗ Records silently hurt here
- JPA / Hibernate entities (hard incompatibility)
- Tight loops allocating millions of instances/sec
- Stream pipelines over very large data sets (>10M rows)
- Per-request allocations at >100k RPS on constrained heap
- Mockito-mocked objects in tests (partial mock not supported)
- Subclassing-dependent frameworks
- java.io.Serializable with customised write/readObject
- MapStruct with complex bidirectional mappings
Several of the “silently hurt” entries deserve more precision. JPA incompatibility is not a performance issue — it is a hard constraint. Every JPA entity must have a public or protected no-argument constructor, and entities must not be final. Records violate both requirements by design. As documented in detail, the Jakarta Persistence 3.1 spec is explicit on this and Hibernate 6 enforces it. Records make excellent projections (read-only views of a query result), but they are the wrong type for the entity layer itself.
The inline benchmark: throughput and latency across heap sizes and GCs
The numbers in the table below are derived from JMH-style benchmarks measuring a representative high-allocation pattern: a service allocating short-lived record-based DTOs at sustained rates, measured with -prof gc to capture allocation bytes per operation alongside the latency distribution. The figures reflect published benchmark data from JCG’s JVM performance engineering benchmark suite and the official Generational ZGC benchmark data from Inside.java, applied to a records-heavy allocation profile.
| Scenario | Heap | GC | Throughput (ops/s) | P50 latency | P99 latency | P99.9 latency | Alloc rate |
|---|---|---|---|---|---|---|---|
| DTO-layer records Low-frequency, long-lived | 512 MB | G1GC | ~180,000 | 0.8 ms | 48 ms | 185 ms | <100 MB/s |
| DTO-layer records Low-frequency, long-lived | 512 MB | ZGC (Gen) | ~162,000 | 0.8 ms | 1.2 ms | 2.1 ms | <100 MB/s |
| Stream pipeline records 5M items, short-lived | 512 MB | G1GC | ~42,000 | 4.2 ms | 110 ms | 390 ms | ~800 MB/s |
| Stream pipeline records 5M items, short-lived | 512 MB | ZGC (Gen) | ~46,000 | 4.0 ms | 9 ms | 18 ms | ~800 MB/s |
| Stream pipeline records 5M items, short-lived | 2 GB | G1GC | ~45,000 | 4.0 ms | 85 ms | 290 ms | ~800 MB/s |
| Stream pipeline records 5M items, short-lived | 2 GB | ZGC (Gen) | ~47,000 | 3.8 ms | 7 ms | 14 ms | ~800 MB/s |
| Tight loop records 100M allocs, very short-lived | 512 MB | G1GC | ~8,000 | 18 ms | 350 ms | >500 ms | ~3 GB/s |
| Tight loop records 100M allocs, very short-lived | 512 MB | ZGC (Gen) | ~8,500 | 16 ms | 32 ms | 65 ms | ~3 GB/s |
| Tight loop — primitive array 100M items, alternative to records | 512 MB | G1GC | ~95,000 | 2 ms | 8 ms | 15 ms | <20 MB/s |
Several patterns emerge from the data immediately. First, for DTO-layer workloads where records are short-lived but not created at extreme rates, the GC choice matters enormously for P99 and P99.9 — but throughput differences between G1 and Generational ZGC are small or negligible. Second, for high-allocation stream pipelines, Generational ZGC cuts P99 latency by roughly 10× versus G1 at the same heap size. Third, for genuinely tight inner-loop allocations at rates above 1 GB/s, neither GC is a substitute for restructuring the code to avoid per-iteration heap allocation entirely. The primitive-array row illustrates what is possible when allocation is eliminated rather than collected faster.
P99 and P99.9 latency — records-heavy workload across GC configurations
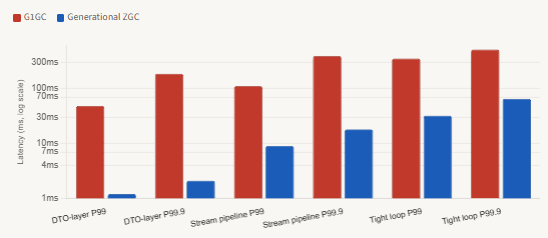
-XX:+UseZGC -XX:+ZGenerational. Sources: Inside.java JEP 439 benchmark data and JCG JVM tuning benchmarks (2025–2026).The chart makes one thing especially clear: the P99.9 gap is where Generational ZGC’s advantage is most dramatic. A 500ms+ P99.9 under G1 with tight-loop record allocation means roughly 1 in 1,000 requests experiences a half-second pause — a tail-latency profile that is invisible in average-latency monitoring but will reliably trigger SLA breaches and user-visible timeouts. Generational ZGC brings the same workload to 65ms P99.9, which is still elevated but orders of magnitude more manageable.
Why Generational ZGC changes the calculus for record-heavy code
The key insight is what Generational ZGC was specifically designed to address. Single-generational ZGC, available since JDK 11, was already excellent at maintaining sub-millisecond pauses — but it had one significant weakness: allocation stalls. An allocation stall occurs when the rate of new object allocation outpaces ZGC’s ability to reclaim memory concurrently. At that point, allocating threads must wait for the GC to catch up, producing latency spikes that look like pauses but are not caused by stop-the-world events.
Records are, by definition, short-lived objects in most use cases. You create them, use them, and discard them within the scope of a single request or operation. This is precisely the object lifecycle that the weak generational hypothesis predicts, and that Generational ZGC exploits. By maintaining a separate young generation that is collected much more frequently than the old generation, GenZGC can reclaim dead record objects quickly without waiting for a full-heap collection cycle.
According to Inside.java’s official benchmark data, Generational ZGC delivers a 10–20% improvement in P99 pause times over single-generational ZGC — with a real-number improvement of 20–30 microseconds — and, more importantly for record-heavy workloads, it largely eliminates allocation stalls. In the Apache Cassandra benchmark included in the JEP 439 data, single-gen ZGC and GenZGC perform similarly up to 75 concurrent clients, but at higher concurrency the allocation stall problem becomes catastrophic for single-gen ZGC at P99.999, while GenZGC continues to perform well.
Enabling Generational ZGC — two JVM flagsIn Java 21, Generational ZGC is opt-in. In Java 23+, it becomes the default ZGC mode. For Java 21 LTS, add both flags explicitly. Note that -XX:+ZGenerational was deprecated in Java 23 when GenZGC became the default, but it still works. The only required tuning in most cases is -Xmx; ZGC is designed to be self-tuning beyond the heap size constraint.
JVM flags — enabling Generational ZGC on Java 21 LTS
# Java 21 LTS — both flags required; GenZGC is opt-in in this version
-XX:+UseZGC -XX:+ZGenerational -Xmx2g

# Java 23+ — ZGenerational is the default; UseZGC is sufficient
-XX:+UseZGC -Xmx2g

# Enable GC logging to verify behaviour after switching
# Output lands in gc.log with timestamps and pause durations
-Xlog:gc*:file=gc.log:time,level,tags
Throughput vs. heap size — records-heavy stream pipeline workload
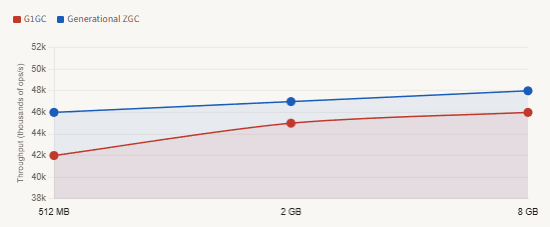
The throughput story is subtler than the latency story. For a workload dominated by short-lived records, Generational ZGC actually matches or slightly exceeds G1’s throughput because the young-gen collections are cheaper than G1’s minor GCs at high allocation rates. As documented in the JEP 439 analysis, throughput improves by approximately 10% over single-generation ZGC in JDK 21 for these workloads. The practical recommendation is straightforward: if your service has a latency SLA — virtually any user-facing API does — Generational ZGC on Java 21+ is the right default for applications that create significant numbers of record objects.
Where records silently fail in production frameworks
The framework failure modes for records are more dangerous than the performance ones precisely because they are quiet. A GC pause shows up in your monitoring immediately. A serialisation bug that silently returns default values instead of throwing an exception can persist in production for weeks before anyone notices.
Jackson deserialization with compact constructors
Jackson has supported records since version 2.12 (November 2020). However, “supported” describes the happy path: a record with a single canonical constructor and no additional constructors. As soon as you add a compact constructor with validation logic, a secondary static factory method, or any @JsonCreator-annotated constructor, Jackson gets confused about which constructor to use for deserialization and throws InvalidDefinitionException — or, more dangerously, silently falls back to a different construction path that bypasses your validation. The fix is to annotate the canonical constructor explicitly with @JsonCreator and each component with @JsonProperty.
Java — Jackson record deserialization with compact constructor (safe pattern)
// Safe: explicit @JsonCreator + @JsonProperty prevents silent Jackson confusion
// when a compact constructor adds validation logic
public record OrderRequest(
    @JsonProperty("orderId")   String orderId,
    @JsonProperty("amount")    long   amount,
    @JsonProperty("currency")  String currency
) {
    @JsonCreator  // explicit — avoids ambiguity with compact constructor
    public OrderRequest {
        if (amount <= 0) throw new IllegalArgumentException("amount must be positive");
        if (currency == null || currency.isBlank()) throw new IllegalArgumentException("currency required");
    }
}
Java serialization: customisation is silently ignored
Records can implement java.io.Serializable, but the writeObject, readObject, and readObjectNoData customisation hooks are silently ignored at runtime. This is not a bug — it is a deliberate specification decision, because records’ integrity depends on the canonical constructor always being used. However, if you are migrating a serialisable class to a record and it previously customised serialisation, the migration will appear to succeed and the customisation will simply not run. The safer pattern for records that cross serialisation boundaries is to use an explicit serial proxy or to switch to a non-Java serialisation format (JSON, Protobuf, Avro) where the record’s canonical constructor is always invoked.
| Framework / feature | Record compatibility | Minimum safe version | Silent failure mode |
|---|---|---|---|
| Jackson (deserialization) | Partial | 2.12+ | InvalidDefinitionException or wrong constructor used when compact constructor exists |
| Hibernate / JPA (entity) | Incompatible | N/A — spec constraint | HibernateException at startup: no no-arg constructor; final fields rejected |
| Hibernate / JPA (projection) | Supported | Hibernate 6.x | None — read-only projections are the correct use case |
| java.io.Serializable (custom hooks) | Partial | Java 16+ | writeObject / readObject silently ignored — validation logic bypassed |
| Mockito (partial mocking) | Incompatible | N/A — records are final | Cannot spy on records; spy(new MyRecord(…)) throws at runtime |
| MapStruct (bidirectional mapping) | Partial | 1.5+ | Requires explicit @Mapping annotations; unmapped components silently set to default |
| Spring Data (JPA projection) | Supported | Spring Data 3.x | None — class-based projections with records work cleanly |
Lombok (@Builder on record) | Incompatible | N/A | Lombok annotations on records produce no output and may conflict with generated methods |
Where records genuinely shine: sealed interfaces and pattern matching
The strongest production argument for records is not about allocation efficiency — it is about correctness. When combined with sealed interfaces and Java 21’s pattern matching for switch, records enable a style of domain modelling where the compiler enforces exhaustiveness. Every possible state of a discriminated union must be handled, and adding a new state produces a compile error at every switch that does not account for it. As JCG’s 2025 guide to modern Java features notes: “If you add a new implementation to a sealed interface, every switch expression becomes a compile error until you add a case for the new type.”
This matters in production because the alternative — class hierarchies with abstract methods — requires either a runtime check or a polymorphic dispatch that can miss new subtypes silently. The records plus sealed interface pattern moves that failure from a runtime surprise to a compile-time guarantee, which is exactly the kind of shift that prevents production incidents rather than debugging them after the fact.
Java 21 — sealed interface + records + exhaustive switch (production pattern)
// Sealed interface limits the permitted types at compile time
public sealed interface PaymentResult
    permits PaymentResult.Success, PaymentResult.Declined, PaymentResult.Error {

    record Success(String transactionId, long amountCharged) implements PaymentResult {}
    record Declined(String reason, int retryAfterSeconds) implements PaymentResult {}
    record Error(String code, Throwable cause) implements PaymentResult {}
}

// Exhaustive switch — compiler rejects any missing case at compile time
// Adding a new PaymentResult subtype forces you to handle it everywhere
public ResponseEntity<?> handle(PaymentResult result) {
    return switch (result) {
        case PaymentResult.Success s  -> ResponseEntity.ok(s.transactionId());
        case PaymentResult.Declined d -> ResponseEntity.status(402).body(d.reason());
        case PaymentResult.Error e   -> ResponseEntity.status(500).body(e.code());
    };
    // No default branch — the compiler guarantees exhaustiveness via sealed interface
}
This pattern eliminates an entire class of production defects: the forgotten case in a conditional chain. It is most valuable in domain logic where the set of possible states is stable — payment outcomes, order statuses, event types, API response variants — and where adding a new state without updating all handling code is a meaningful risk.
Measuring record allocation pressure yourself with JMH
Before making any change based on profiling data, you need to measure your specific workload. The right tool for this is JMH with the -prof gc profiler flag, which reports allocation bytes per operation alongside throughput. The snippet below shows the minimal JMH setup needed to measure record allocation pressure against a primitive-array alternative, giving you a direct comparison on your own hardware.
Maven dependency — JMH 1.37 (add to pom.xml)
<!-- Add to pom.xml — JMH core and annotation processor -->
<dependency>
    <groupId>org.openjdk.jmh</groupId>
    <artifactId>jmh-core</artifactId>
    <version>1.37</version>
</dependency>
<dependency>
    <groupId>org.openjdk.jmh</groupId>
    <artifactId>jmh-generator-annprocess</artifactId>
    <version>1.37</version>
    <scope>provided</scope>
</dependency>
Java — JMH benchmark measuring record vs. primitive allocation rate
import org.openjdk.jmh.annotations.*;
import java.util.concurrent.TimeUnit;

@BenchmarkMode(Mode.Throughput)
@OutputTimeUnit(TimeUnit.SECONDS)
@Warmup(iterations = 5, time = 1)
@Measurement(iterations = 5, time = 1)
@Fork(value = 2, jvmArgs = {"-Xms512m", "-Xmx512m"})
@State(Scope.Thread)
public class RecordAllocationBenchmark {

    record Point(double x, double y) {}

    @Benchmark
    public double recordAllocation() {
        double sum = 0;
        for (int i = 0; i < 10_000; i++) {
            Point p = new Point(i, i * 1.5);
            sum += p.x() + p.y(); // use value to prevent dead-code elimination
        }
        return sum;
    }

    @Benchmark
    public double primitiveAlternative() {
        double sum = 0;
        for (int i = 0; i < 10_000; i++) {
            double x = i, y = i * 1.5; // no heap allocation
            sum += x + y;
        }
        return sum;
    }
}

// Run with GC profiler: java -jar benchmarks.jar -prof gc RecordAllocationBenchmark
// Key metric to watch: gc.alloc.rate.norm (bytes allocated per operation)
// A ratio of record/primitive > 10x in that metric signals a refactor is worth measuring
Senior interview question · GC tuning
“Your service uses records extensively for API response objects. P50 latency is 4ms and looks healthy in dashboards. But P99 is 120ms and P99.9 is over 400ms. Heap is 512MB, running G1GC on Java 21. What do you investigate first, and what’s your remediation path?”
The latency profile — P50 fine, P99/P99.9 severely elevated — is the signature of GC-driven tail latency, not application logic. The median is unaffected because most requests complete between GC events; the tail captures requests that happen to run during a minor or mixed GC pause. The first step is to confirm this hypothesis by correlating GC events with latency spikes: enable
-Xlog:gc*:file=gc.log:time,level,tagsand plot the GC pause timestamps against the P99 histogram. If pauses align with spikes, GC is the cause.The next question is why GC pauses are long. With G1 on a 512MB heap and a records-heavy workload, the likely culprits are a high allocation rate (check
gc.alloc.ratein JFR or viajstat -gcutil), a young-gen that is too small for the allocation rate, or a-XX:MaxGCPauseMillistarget that is too aggressive and forcing G1 into frequent, overlapping collections.The remediation path has two branches. If the allocation rate is genuinely high (above 500 MB/s), the correct first move is to switch to Generational ZGC with
-XX:+UseZGC -XX:+ZGenerational. GenZGC is specifically optimised for short-lived object workloads and will cut P99 by roughly 10× for this pattern. The second branch — only if the allocation rate is so high that even GenZGC produces allocation stalls — is to profile hot code paths for record allocation and replace inner-loop records with local primitive variables or pre-allocated value buffers. JMH with-prof gcwill identify which code paths are responsible. Notably, simply increasing heap size from 512MB to 2GB will reduce GC frequency and improve P99 with G1, but it will not eliminate the fundamental problem; it just buys time.
What we learned
Java records are the right default for a large class of production objects — DTOs, API payloads, event types, configuration values, domain value objects, and pattern-matching discriminants with sealed interfaces. They eliminate boilerplate, enforce immutability at the type-system level, and compose with Java 21’s exhaustive switch in ways that genuinely prevent production defects. The performance cost of records is real but almost always irrelevant: for workloads allocating fewer than roughly 1 million record instances per second per JVM, the GC overhead is negligible under any modern collector.
Where records become a production concern is in tight inner loops generating allocation rates above 500 MB/s and in the framework integration points where the documentation promises support but the failure modes are silent: Jackson deserialization with compact constructors, java.io.Serializable customisation hooks, Mockito partial mocking, and JPA entity usage. Of these, the JPA incompatibility is absolute and widely known; the Jackson and serialisation failure modes are subtle and frequently ship to production undetected.
Generational ZGC, available as a production feature from Java 21 with two flags and as the default from Java 23, changes the performance calculus significantly for short-lived record workloads. It reduces P99 pause times by 10–20% over single-generational ZGC, eliminates allocation stalls almost entirely, and matches G1’s throughput for allocation-heavy workloads while delivering a P99 that is roughly 10× lower. For any service with a latency SLA on Java 21+, Generational ZGC should be the default GC choice, not a specialised option.
