Ever feel like you’re spending hours crawling through code, hunting down that elusive bug? There’s a better way! JMX, the Java Management Extensions, isn’t just for monitoring – it’s a hidden debugging weapon waiting to be wielded. In this revisited exploration, we’ll dive into how JMX can supercharge your debugging workflow, saving you time and frustration.
1. Introduction
We’ve all been there: staring at lines of code, meticulously stepping through each line, trying to isolate that pesky bug that’s causing your program to malfunction. Traditional debugging can be a time-consuming and frustrating process. Imagine spending hours sifting through code, adding print statements, and restarting your application repeatedly – all just to pinpoint the source of a single error.
But what if there was a better way? Enter JMX, the Java Management Extensions, a powerful tool that’s often overlooked as a debugging ally. JMX isn’t just about monitoring applications; it’s a hidden weapon that can supercharge your debugging workflow.
Here’s why:
- Faster Debugging: Forget the tedious code crawling. JMX allows you to peek “under the hood” of your application while it’s running. Imagine being able to view real-time data like thread dumps (a snapshot of all running threads) or heap dumps (a snapshot of all objects in memory) without modifying your code. This can significantly reduce debugging time by giving you immediate insights into the application’s state.
- Deeper Insights: Traditional debugging often leaves you blind to what’s happening within the application. JMX provides a wealth of information that can be crucial for pinpointing elusive bugs. For instance, you can see how much memory your application is using, identify any deadlocked threads (threads stuck waiting for each other), or even monitor resource utilization. This granular level of detail allows you to diagnose issues much more effectively.
Let’s consider a real-world example. Imagine your application is experiencing slow performance. Traditional debugging might involve adding print statements to track code execution and analyze bottlenecks. With JMX, you could simply view the thread dump and identify any threads that are stuck or waiting for resources. This can save you hours of digging through code and pinpoint the performance issue much faster.
2. What is JMX?
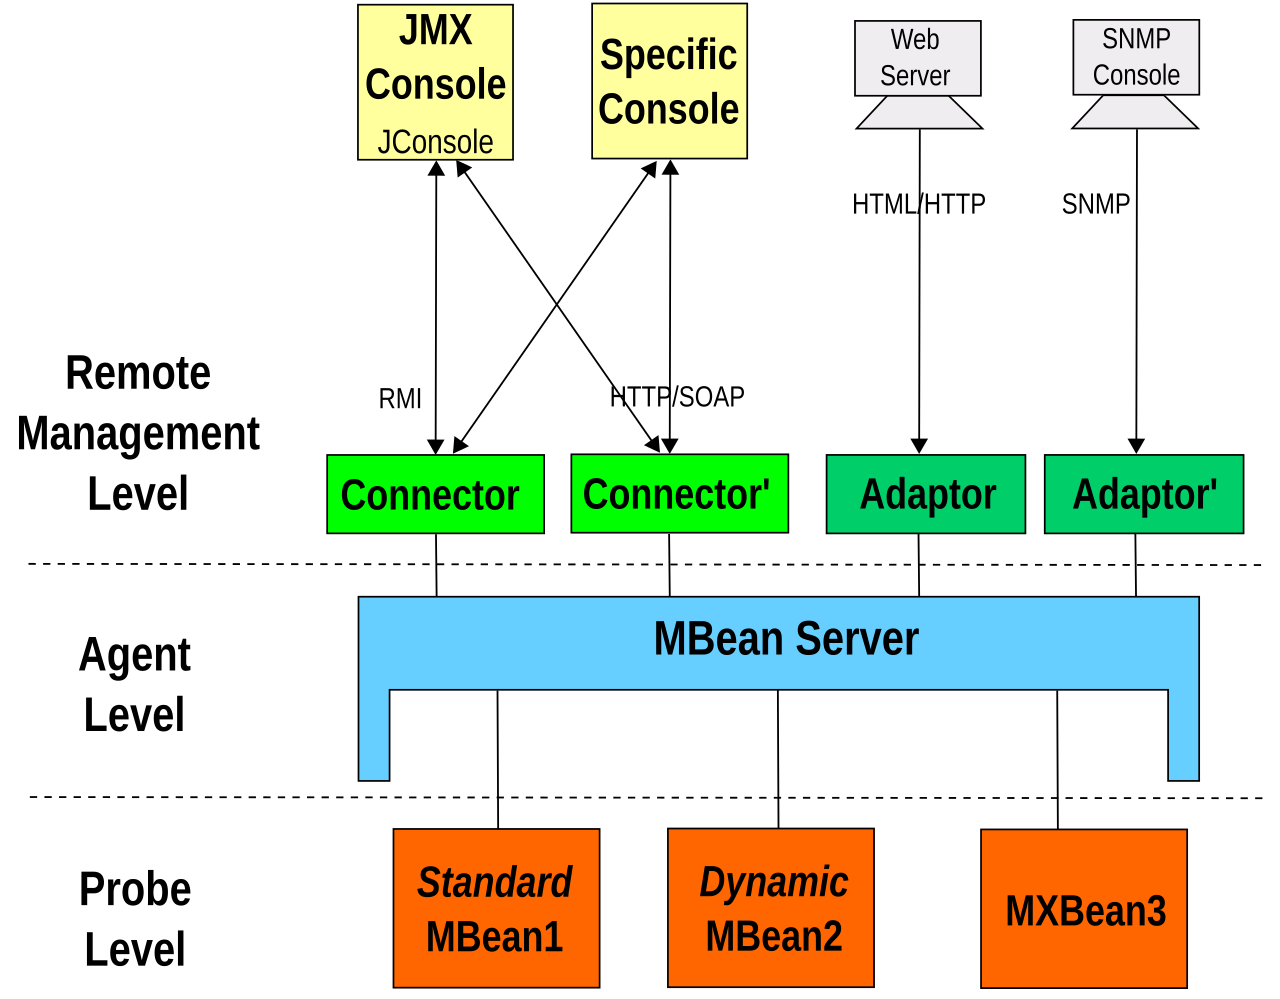
JMX, or Java Management Extensions, can be thought of as a mission control center for your Java applications. It provides a standardized way to monitor and manage applications, even while they’re running. Imagine having a central dashboard where you can see everything that’s going on inside your program – that’s essentially what JMX offers.
Here’s a breakdown of its core functionalities:
- Monitoring: JMX acts like a watchful eye, constantly gathering information about your application’s health. It can track various metrics like memory usage, thread activity, and resource consumption. This real-time data allows you to identify potential problems before they cause major issues.
- Management: JMX goes beyond just monitoring. It empowers you to take control of your application. You can use JMX to:
- Start, stop, and restart various components within your application.
- Modify configuration settings on the fly without needing to redeploy your code.
- Trigger specific events or actions within the application for testing purposes.
The key to JMX’s functionality lies in MBeans (Managed Beans). These are special Java objects that expose specific data and functionalities of your application. Think of them as sensors and controls built into your program. Through JMX, you can access and interact with these MBeans to gather information, change configurations, or even execute specific methods within your application. This allows you to remotely “reach inside” your program and manipulate its behavior for debugging or management purposes.
In simpler terms, imagine MBeans as labeled dials and gauges on a control panel. JMX acts as the control room operator, allowing you to see the readings on these dials (monitoring) and even adjust them (management) to fine-tune your application’s performance.
3. JMX for Debugging
Now that we understand the core functionalities of JMX, let’s delve into how it can be used to supercharge your debugging workflow:
3.1. Inspecting Application State: X-Ray Vision for Your Code
Imagine being able to see exactly what’s happening inside your running application – that’s the power JMX offers for inspecting its state. Here’s how you can leverage it:
- Thread Dumps: Feeling overwhelmed by tangled threads? JMX lets you take a “thread dump,” a snapshot of all running threads within your application. This allows you to see if any threads are stuck or waiting for resources, which can be a major cause of performance issues and deadlocks.
- Heap Dumps: Memory leaks can be a nightmare to track down. With JMX, you can generate a “heap dump,” a snapshot of all objects currently residing in memory. This can be incredibly useful for identifying objects that are no longer being used but haven’t been garbage collected, leading to memory leaks.
- Resource Utilization: Ever wondered how much memory, CPU, or network bandwidth your application is consuming? JMX provides real-time insights into resource utilization. This can help you identify bottlenecks and ensure your application is operating efficiently.
3.2. Invoking Methods: Testing Functionalities Remotely
JMX doesn’t just provide a passive view; it allows you to interact with your application remotely. This can be incredibly powerful for debugging specific functionalities:
- Triggering Code Paths: Debugging often involves testing specific scenarios within your code. With JMX, you can invoke methods on MBeans that represent functionalities within your application. This allows you to remotely trigger specific code paths without modifying your application itself, helping you isolate and test problematic areas.
- Simulating Events: Need to test how your application reacts to certain events? JMX allows you to simulate events by invoking methods on MBeans that represent those events. This can be extremely useful for testing error handling or asynchronous behavior within your application.
3.3. Modifying Attributes: Tweaking Your Application for Debugging
JMX isn’t just about viewing data; it allows you to make subtle adjustments to your application’s behavior for debugging purposes:
- Enabling Debug Flags: Some libraries or frameworks offer hidden debug flags that can provide more information about what’s happening within your code. JMX can sometimes be used to modify attributes on MBeans that control these debug flags, allowing you to enable them without recompiling your application.
- Changing Configuration Settings: Sometimes, a simple configuration change can reveal the root cause of an issue. JMX allows you to modify certain configuration settings exposed by MBeans on the fly. This can be helpful for testing different configurations and isolating the impact on the bug you’re facing.
4. Benefits of Using JMX for Debugging
JMX offers several key advantages that set it apart from traditional debugging techniques:
1. Non-intrusive Debugging: Say Goodbye to Code Modifications
One of the biggest frustrations with traditional debugging is the need to constantly modify your application code. Adding print statements, inserting breakpoints, and patching code can be time-consuming and error-prone. JMX shines here because it allows you to debug your application without modifying the code itself. This means you can inspect the application’s state, invoke methods, and even make configuration changes – all from the comfort of a JMX client tool. This not only saves you time and effort, but also reduces the risk of introducing new bugs by modifying the original code.
2. Real-time Insights: See What’s Happening Now, Not What Happened
Traditional debugging often feels like looking in the rearview mirror. You can only analyze what happened in the past by stepping through code execution line by line. JMX provides a crucial advantage by offering real-time insights into your application’s state. You can view thread dumps, heap dumps, and resource utilization data as your application is running. This allows you to see the application’s behavior in the moment, making it much easier to pinpoint issues that might only occur under specific conditions.
3. Remote Debugging: Unleash the Power from Anywhere
Imagine debugging a deployed application running on a remote server. Traditional methods would require physical access or complex remote debugging setups. JMX empowers you to debug applications remotely. By connecting to the application’s JMX interface with a JMX client tool, you can inspect its state, invoke methods, and make configuration changes – all from your local machine. This not only saves you time and effort but also makes debugging applications in production environments much more efficient.
In essence, JMX offers a non-intrusive, real-time, and remote approach to debugging, making it a powerful weapon in your development arsenal.
5. Getting Started with JMX Debugging
Ready to experience the debugging power of JMX? Here’s a practical guide to get you started:
JMX Tools: Your Gateway to Application Insights
The first step is to choose a JMX client tool. Thankfully, there are several user-friendly options available:
- JConsole: This is a lightweight tool included with the standard JDK installation. It provides a basic interface for browsing MBeans, viewing attributes, and invoking operations.
- VisualVM: A more comprehensive tool also bundled with the JDK. VisualVM offers a wider range of functionalities, including monitoring tools, thread dumps, heap dumps, and profiling capabilities. It provides a powerful all-in-one solution for JMX debugging and performance analysis.
- Third-Party Tools: Several third-party tools offer advanced features and integrations with specific application servers or frameworks. These can be a good option if you need more specialized functionalities beyond the basic JMX clients.
Connecting to a Running Application: Bridging the Gap
Once you have your chosen JMX client tool, it’s time to connect to your running application. Here’s a general process (specific steps might vary slightly depending on the tool):
- Enable JMX: JMX needs to be explicitly enabled when launching your Java application. This is typically done by adding specific flags to the JVM startup command. You can find detailed instructions on enabling JMX in your specific application server documentation or consult the official Java documentation.
- Identify JMX Details: With JMX enabled, your application will expose a JMX service on a specific port. You’ll need to know the hostname or IP address of the machine running the application and the port number where the JMX service is listening. This information might be displayed in the application logs or server configuration.
- Connect with Your JMX Client: Launch your chosen JMX client tool. It will typically have an option to connect to a remote JMX service. Provide the hostname/IP address and port number you identified in step 2.
- Explore and Debug: Once connected, you can start exploring the available MBeans within your application. The JMX client will allow you to browse the MBean hierarchy, view attribute values, invoke methods, and potentially modify certain configurations. Use the functionalities offered by your JMX client tool to inspect the application’s state, trigger specific behaviors, and gain valuable insights to pinpoint and resolve bugs.
This is a basic guide. Each JMX client tool might have its own specific interface and functionalities. However, the core principles of enabling JMX, identifying connection details, and exploring MBeans remain consistent. Don’t hesitate to consult the documentation of your chosen JMX client for detailed instructions and advanced features.
6. Advanced JMX Debugging Techniques
For those seeking to unlock even more debugging power with JMX, here are some advanced techniques to consider:
1. MBean Creation and Registration: Expose What You Need
The standard MBeans exposed by your application might not always provide all the data you need for debugging. JMX allows you to create and register your own custom MBeans. This empowers you to expose additional data or functionalities specifically tailored to your debugging needs.
Here’s a high-level overview of the process:
- Implement the MBean Interface: You define an interface that extends the
javax.management.MBeaninterface. This interface specifies the attributes and operations you want to expose through your custom MBean. - Implement the MBean Logic: Create a class that implements the custom MBean interface. This class will house the logic for accessing and manipulating the data you want to expose for debugging.
- Register the MBean: Use the JMX API to register your custom MBean with the MBean server within your application. This makes it accessible for discovery and interaction through JMX client tools.
Creating custom MBeans can be a powerful technique for exposing hidden data points or functionalities within your application, providing deeper insights for debugging complex issues.
2. Scripting with JMX: Automate Your Debugging Workflow
JMX interactions don’t have to be manual. You can leverage scripting languages like Jython or Groovy to automate repetitive tasks during debugging. Here’s how:
- Scripting JMX Clients: Most JMX client tools offer scripting capabilities. You can write scripts that interact with the JMX client programmatically. This allows you to automate tasks like connecting to the JMX service, browsing MBeans, invoking operations, and collecting data.
- Standalone JMX Scripting: You can write standalone scripts using JMX libraries like JMX Remote API (JSR-160) to directly interact with the MBean server within your application. This allows for even more flexibility and customization in automating your debugging workflows.
Scripting with JMX can significantly improve your debugging efficiency by automating repetitive tasks and data collection. This allows you to focus on analyzing the data and pinpointing the root cause of issues.
Advanced techniques like custom MBean creation and scripting require a deeper understanding of JMX concepts and APIs. However, for experienced developers, these techniques can unlock a whole new level of power and control for debugging complex Java applications.
7. Conclusion: JMX – Your Debugging Ally Awaits
JMX is often overlooked as a debugging tool, but it possesses immense potential to supercharge your workflow. By offering non-intrusive, real-time, and remote debugging capabilities, JMX can save you time, effort, and frustration in your quest to squash bugs.
This exploration has equipped you with the fundamentals of JMX debugging, from using JMX clients to inspecting application state and invoking methods. For those seeking to delve deeper, custom MBean creation and scripting with JMX open doors to even more control and automation in your debugging endeavors.
Remember, JMX is a powerful tool, but like any tool, it requires practice and exploration to master. Start incorporating JMX into your debugging routine, and witness the bugs melt away as you wield the power of JMX debugging!
