See and Resolve Team Dependencies, Part 4: All Component Teams, Complex Product
The larger your product, the more likely you have components teams. I often see component teams because of the architecture of the product.
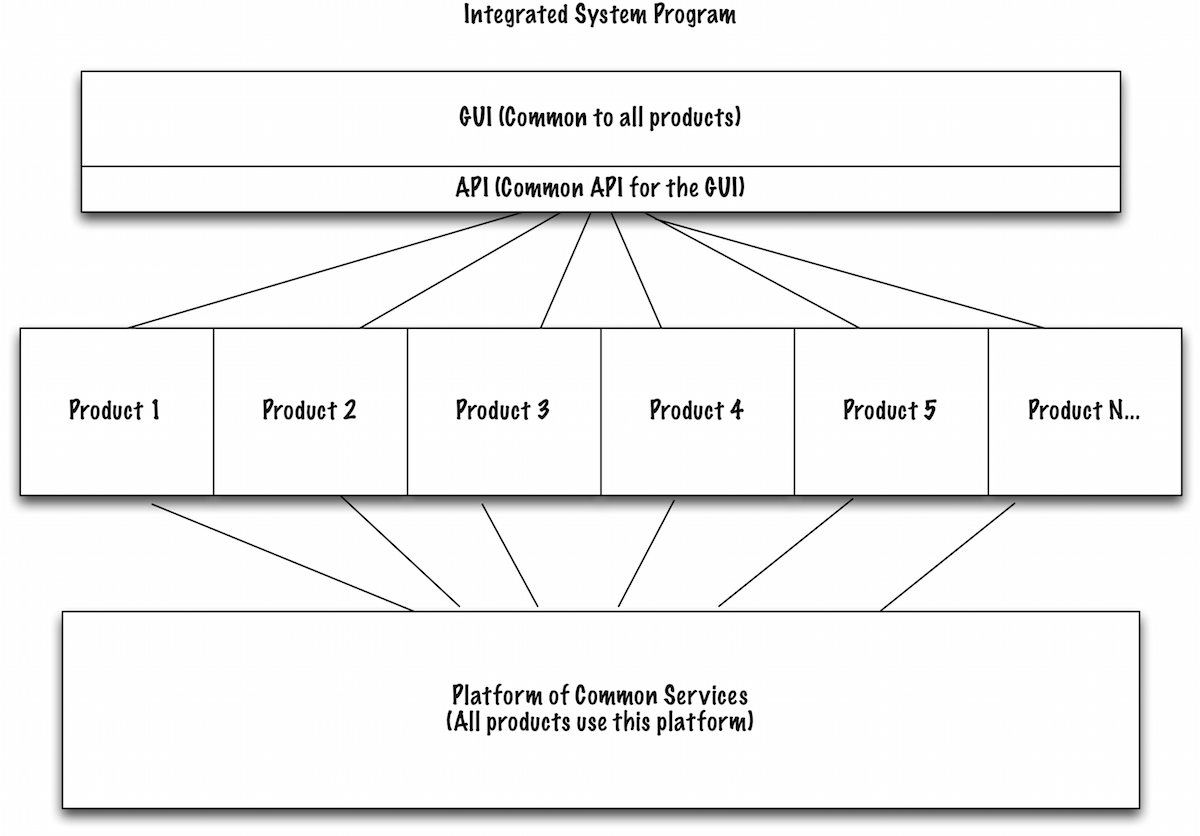
In this first image, the Integrated System Program, the rest of the product uses the Platform of Common Services as components. Also, the teams find it tempting to think of the common GUI and API as components.
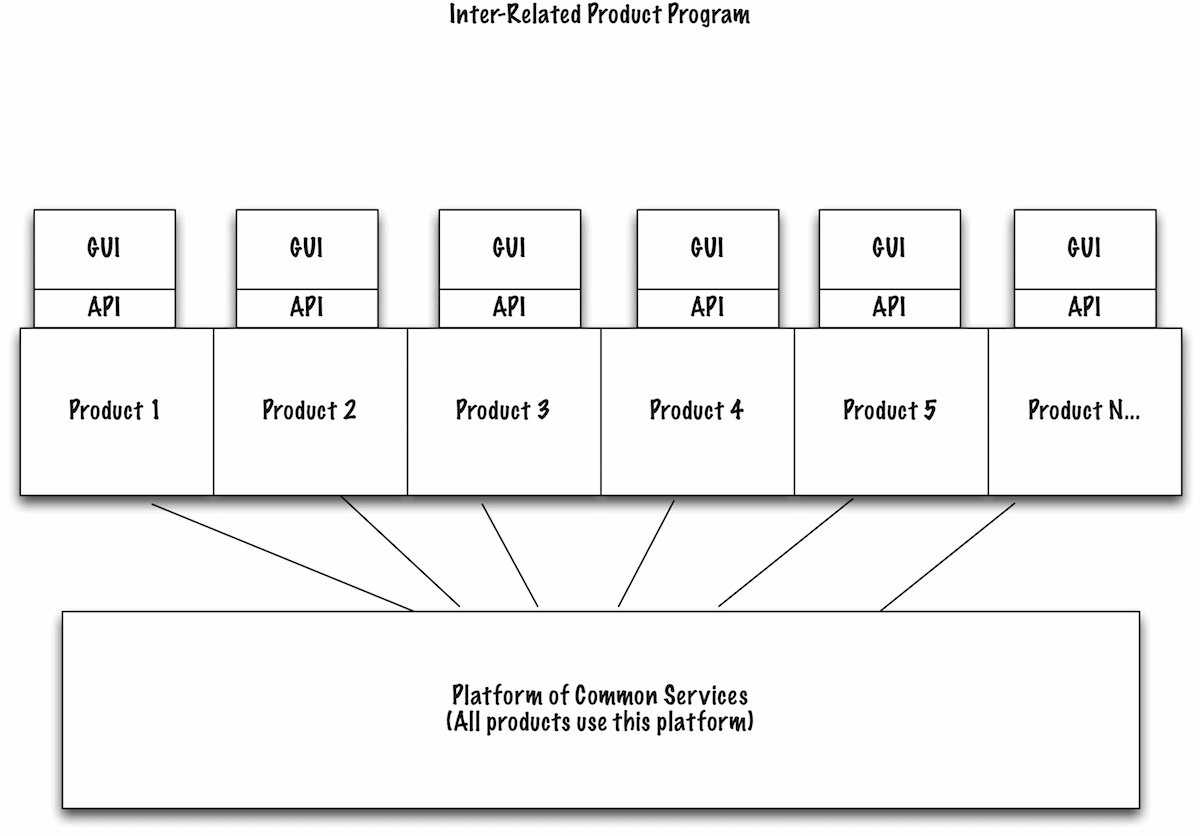
But that’s not the only possible way to describe large programs. In Agile and Lean Program Management, I suggested two other views of large products. One is the InterRelated Program.
In the second image, the InterRelated Program image, the teams also use the Platform of Common Services as components. In contrast to the first image, the GUI and API are separate for each product. The teams might not use the GUI and API as components.
However, neither of those images show how I often see data. The third image, Architecture of a Large Program has my drawing of products I’ve seen with data stores.
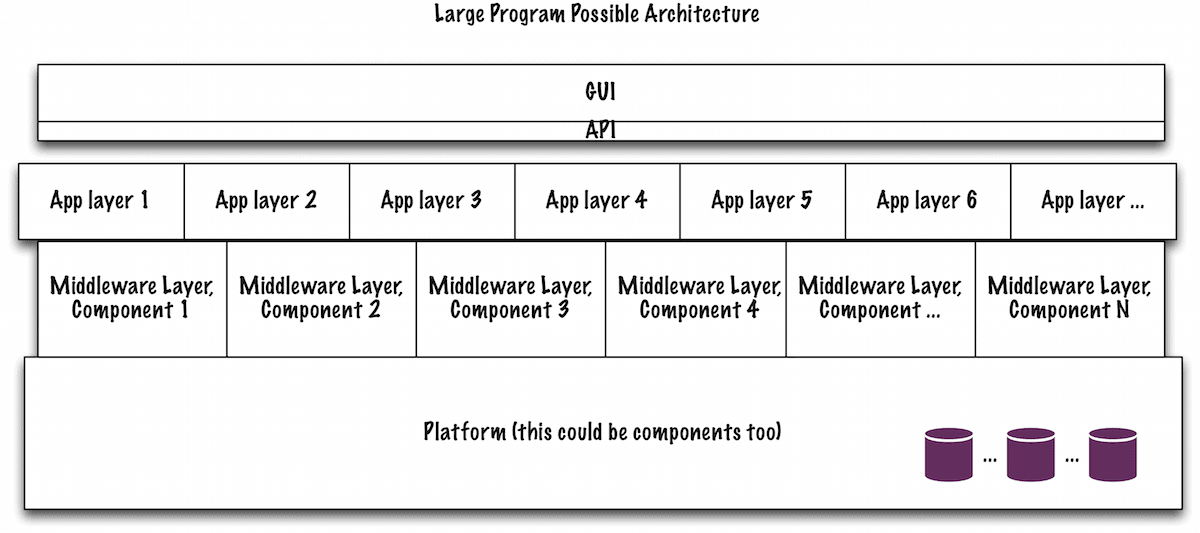
My disclaimer: I’m not an architect and I’m sure I have the details wrong. However, from the program perspective, this is what I see.
The more data you have, the more layers you have, and the more interconnected everything is, the more likely you have component teams.
What can you do? Start by visualizing your complexity.
Draw Pictures of Your Architecture
Architects often draw images that show inputs and outputs. That’s great. I would add any security and performance delays between those inputs and outputs, too. I’m sure the teams need that image.
But the pictures I want to see don’t need to show inputs, outputs, and delays. I want to see the product interconnections between the layers and the components. I’m looking for the Conway’s Law version of the image. (Conway’s Law says that products mirror the organizational structure.)
The more you show where the organization mirrors the product, the more likely you can see where you have components teams.
Once you can see how the organizational structure creates teams, you can decide what to do. I suggest you first measure cycle time.
Measure Delivery Cycle Time
Your customers care about when they will get features. That means the cycle time for any given team doesn’t matter. What matters is the time from when the first team starts on a feature until the last team finishes and deploys. (If you have a product with hardware, measure to an internal deployment. See Create Feedback Loops (Agile Approaches) for Hardware Products.)
To measure that cycle time, reflect back on the last month or so. How many features did you deploy and what was the cycle time for each of those? Make a time series chart, such as the one in Low Tech Way to Visualize Your Percentile Confidence for Forecasts. (You don’t need boxes. Dots work.)
Are you happy with that duration? If so, do nothing.
But I bet you think that’s too long for your desired delivery/release frequency.
Offer the data to the teams and ask them what they would like to do. The teams probably know or have ideas.
Ask the Teams
In my experience, the teams already know what’s going on. If you ask them, they will have good ideas to reduce cycle time, once they see it. And, maybe once they see the Conway’s Law image of the product. (See Component Teams Create Coupling in Products and Organizations for one way to draw these pictures, aside from the images here.)
If they have no ideas, offer them the ideas in One Experimental Possibility: Self-Organization from Component Teams to Feature Teams. They might not like that, but those ideas might prompt the teams to consider other experiments. See if you can get the teams to generate three experiments. (That’s the Rule of Three at work.)
Summary
Interdependencies slow everyone down. Here’s what I’ve suggested:
- Recognize where the interdependencies are. Within the team? Outside the team? Between teams? (All of the above?)
- Measure the cycle time to see the delays with those interdependencies. If you want to measure more, consider the Cost of Delay.
- For team interdependencies, draw pictures of your product. Include the teams and how they work. Do they create narrow features in slices? Or, wide features in slices? Or, totally across architectural layers? Those pictures will help the teams see alternatives.
- Ask the teams to generate experiments.
Don’t blame people for continuing to hold onto older ways of working. Those ways worked earlier when you had fewer people and the product was smaller. Now that you have more people and the product is larger, it’s time to take a different look at how you work. Not just at the team level, but at the product level. (This is a classic case of what got you here won’t get you to the next step.)
So, start again, looking at the product, not the team. And definitely not the component.
And, watch for resource efficiency thinking, not flow efficiency thinking.
The Series
The series so far (which arose from A Common Tool Trap: the Tool Will Help Your Delivery and Planning Problems):
- See and Resolve Team Dependencies, Part 1: Inside the Team
- See and Resolve Team Dependencies, Part 2: One Person Outside the Team
- See and Resolve Team Dependencies, Part 3: Some Component Teams, Some Feature Teams
- See and Resolve Team Dependencies, Part 4: All Component Teams, Complex Product
Published on Java Code Geeks with permission by Johanna Rothman , partner at our JCG program. See the original article here: See and Resolve Team Dependencies, Part 4: All Component Teams, Complex Product Opinions expressed by Java Code Geeks contributors are their own. |
