When you tune Garbage collection performance, you are not only improving Garbage collection pause time but also the overall application’s response time and reducing cloud computing cost. Recently we helped to tune the Garbage collection behavior of a popular application. Just by making a minor change, it resulted in a dramatic improvement. Let’s discuss this garbage collection tuning success story in this post.
Garbage Collection KPIs
There is a famous saying that ‘you can’t optimize something that you can’t measure‘. When it comes to garbage collection tuning there are only 3 primary Key Performance Indicators (KPIs) that you should be focusing upon:
a. GC Pause Time
b. GC Throughput
c. CPU consumption
When garbage collection runs, it pauses your application. ‘GC Pause time’ indicates the time your application is pausing during a garbage collection event. This metric is studied in seconds or milliseconds.
‘GC Throughput’ indicates the total amount of time your application spends in processing customer transactions vs the total amount of time it spends in processing garbage collection activity. This metric is studied in Percentage. For example, if someone says his application’s GC throughput is 98%, it indicates the application is spending 98% of its time in processing customer activity and the remaining 2% of the time in processing Garbage Collection activity.
Modern applications tend to create thousands of objects to process even a simple request. Due to this, garbage collectors have to run constantly in the background to evict these thousands of objects that are created for every request. Thus, Garbage collection tends to consume a heavy amount of CPU. So, when you tune Garbage Collection performance, you should also study the CPU consumption. To learn more about these KPIs, you can refer to this post.
How to source these KPIs?
Garbage collection Logs are your best friend when it comes to tuning Garbage collection performance. You can enable garbage collection logs on your application by passing the JVM arguments given here. I would recommend enabling garbage collection logs always be ON, as it provides rich information which can facilitate you to predict outages, troubleshoot production problems, and help with capacity planning. Besides that, enabling garbage collection doesn’t add any noticeable overhead to your application.
Once the garbage collection log is enabled, you can use free Garbage collection log analysis tools like GCeasy, IBM GC & Memory visualizer, HP Jmeter, Garbage Cat to see the above-mentioned KPIs.
Here is a post that walks you through, how to do GC log analysis.
Baseline Garbage collection behavior:
Enough of the introduction. Let’s get back to the original theme of this article. We enabled the Garbage collection log on this popular application. We let the application run for a 24-hour period. Then we uploaded the generated GC log file to the GCeasy tool. The tool provided insightful graphs and GC KPIs. This application’s GC throughput was 96.176% and the average pause time was 12.429 seconds.
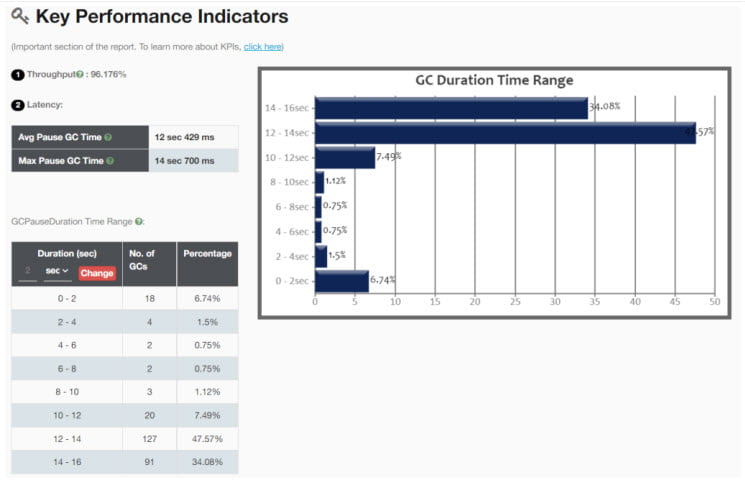
Basically, these GC KPIs are not good enough for high throughput, low latency types of applications. This application was running with the ‘Parallel GC’ algorithm. This application was configured to run with a 40GB heap size (i.e. -Xmx). In this 40GB heap size, 20GB (i.e50%) was allocated to the young generation and the remaining 20GB to the old generation.
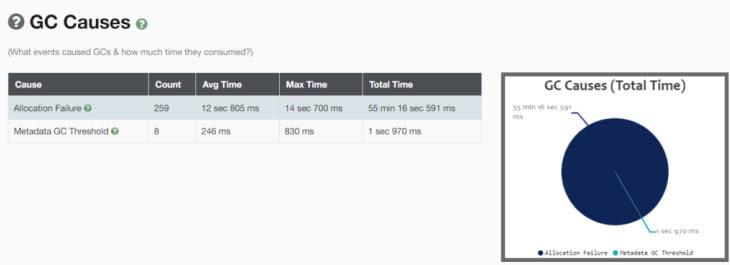
The above table from the GCeasy tool shows the causes that were triggering the GC events. You can notice that a significant amount of GC events were triggered because of the ‘Allocation Failure’. This type of ‘Allocation failure’ GC events are triggered when there is not sufficient memory to create new objects in the young generation. You can notice that ‘Allocation Failure’ GC events alone cumulatively triggered 55 minutes & 16 seconds of pause time. This is a very large amount of pause time for a 24-hour period.
Reducing Young Generation size
If you notice the young generation size of this application, it is quite large (i.e.20GB). Since the young generation’s size is very large, a lot of objects in this generation have to be scanned and unreferenced objects from this region have to be evicted. Thus, the larger the young generation’s size, the larger the pause time. Thus, the team decided to reduce the young generation size from 20GB to 1GB. The rationale is: If the young generation size is small, then a smaller number of objects needs to be scanned & evicted thus less would be the garbage collection pause times.
Benchmark Garbage collection behavior:
After dropping the young gen size from 20GB to 1GB, we ran the application for the same 24-hour period in the production environment. When we uploaded the generated Garbage collection log file in the GCeasy tool, it generated the below KPIs:
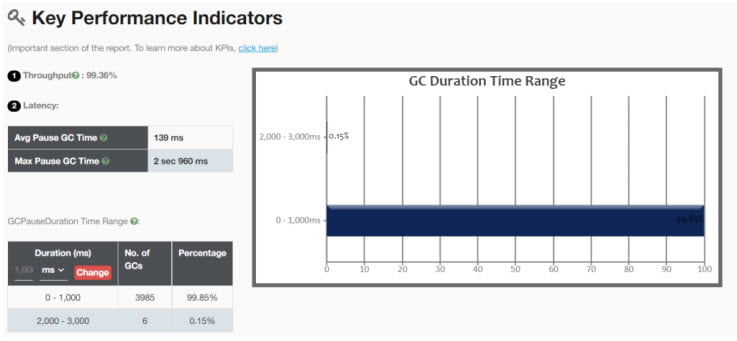
GC Throughput improved from 96.176% to 99.36%. Average GC pause time improved from 12.429 seconds to 139ms. This is a phenomenal improvement. Eureka moment. Below is how the GC causes table started to look:
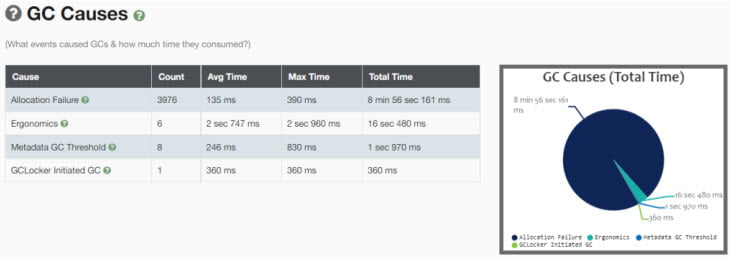
You can notice that ‘Allocation Failure’ GC events count has significantly increased from 259 to 3976. Since the young generation size has become small, the number of occurrences of ‘Allocation Failure’ GC events increased. Even though the number of occurrences of ‘Allocation Failure’ increased, cumulatively pause time reduced from ’55 minutes and 16 seconds’ to ‘8 minutes and 56 seconds’. It’s because the region size is small, less number of objects has to be evicted from the memory. Thus, as per our expectation, reducing young generation size improved the Garbage collection behavior.
WARNING: It’s not always that reducing young generation size will reduce the GC pause time. It depends on your traffic volume, object type creation (i.e., short-lived or long-lived objects) of your application & GC algorithm configuration. Thus, don’t reduce your young generation size based on this article, do your own proper due-diligence and testing before changing the generation size.
Published on Java Code Geeks with permission by Ram Lakshmanan, partner at our JCG program. See the original article here: Garbage Collection tuning success story – reducing young gen size Opinions expressed by Java Code Geeks contributors are their own. |
