We continue our effort to optimize Apache Camel. This is blog post part 7 which covers are latest effort on dramatically reducing the object allocations caused by Camel while routing messages.
The good news is that we have overachieved and was able to reduce object allocations to ZERO!!! – so no more JVM memory usage graphs with saw tooth (note: in real world use-cases there will always be user data causing object allocations – but I wanted to have a click-bait blog title).
To help identify potential areas of improvement in the core Camel, we put together a small performance application, which has only a single route triggered by a timer every producing 1000 msg/sec. These messages are routed to 10 different log endpoints (logging turned off). This allows us to focus on the internals of Camel only and what code paths is executed and what objects are being allocated and in-use by the internal routing engine. There are no message data (body or headers), or network communication etc.
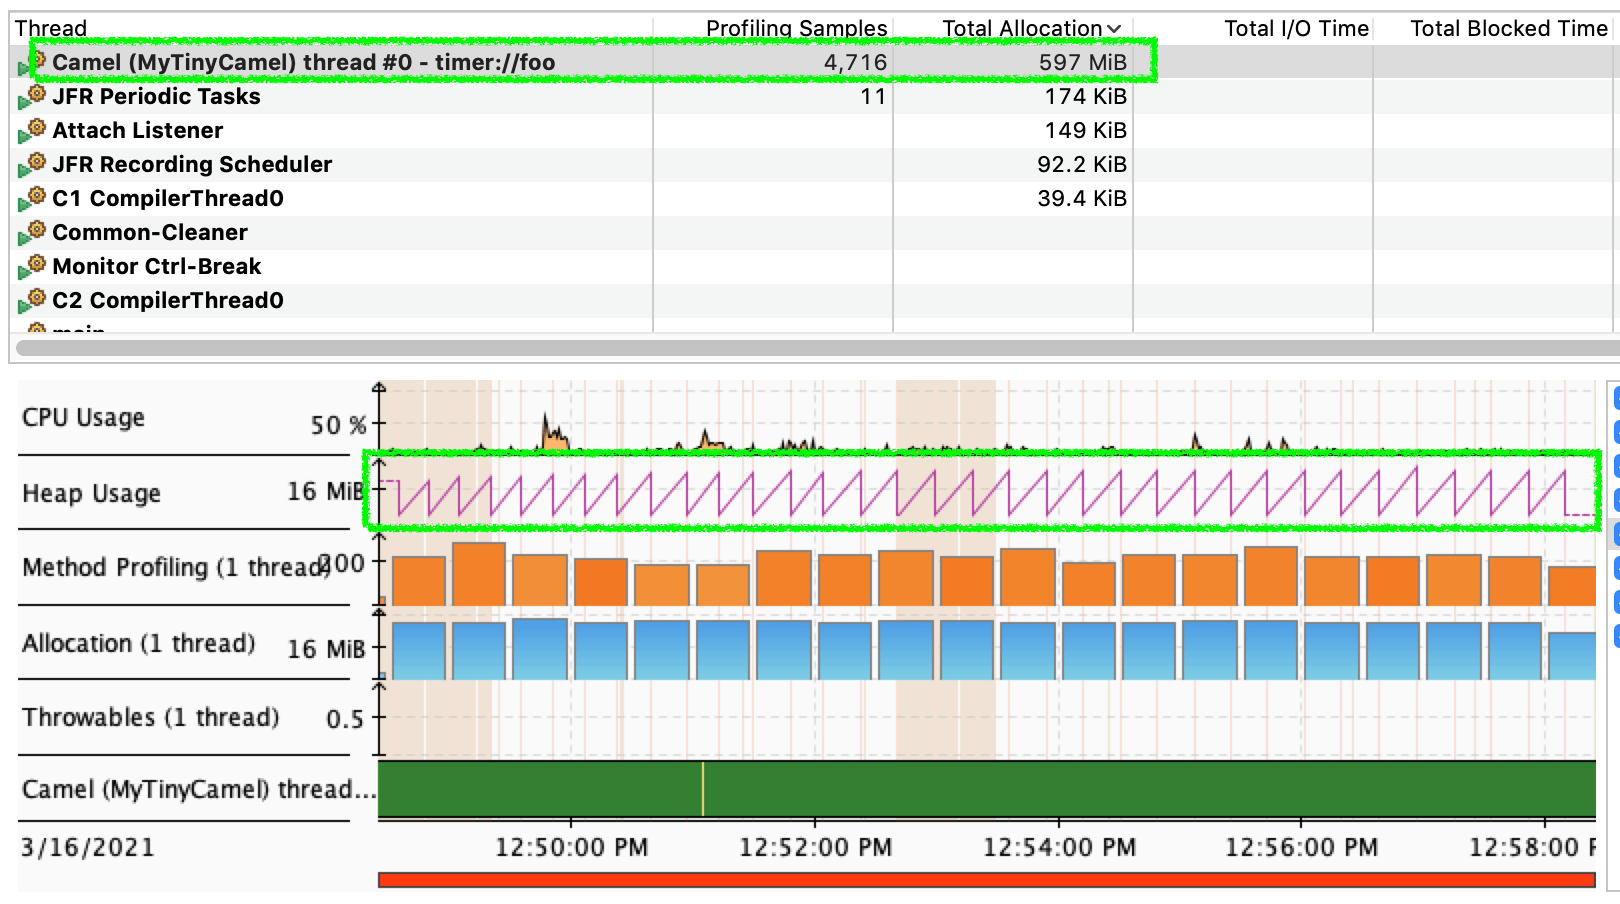
Running the example (JVM heap size set to max 32mb) for 10 minutes profiled by JFR and browsed in JDK mission control we can see the dramatic difference.
In Camel 3.8 597mb of objects is allocated by Camel in total.
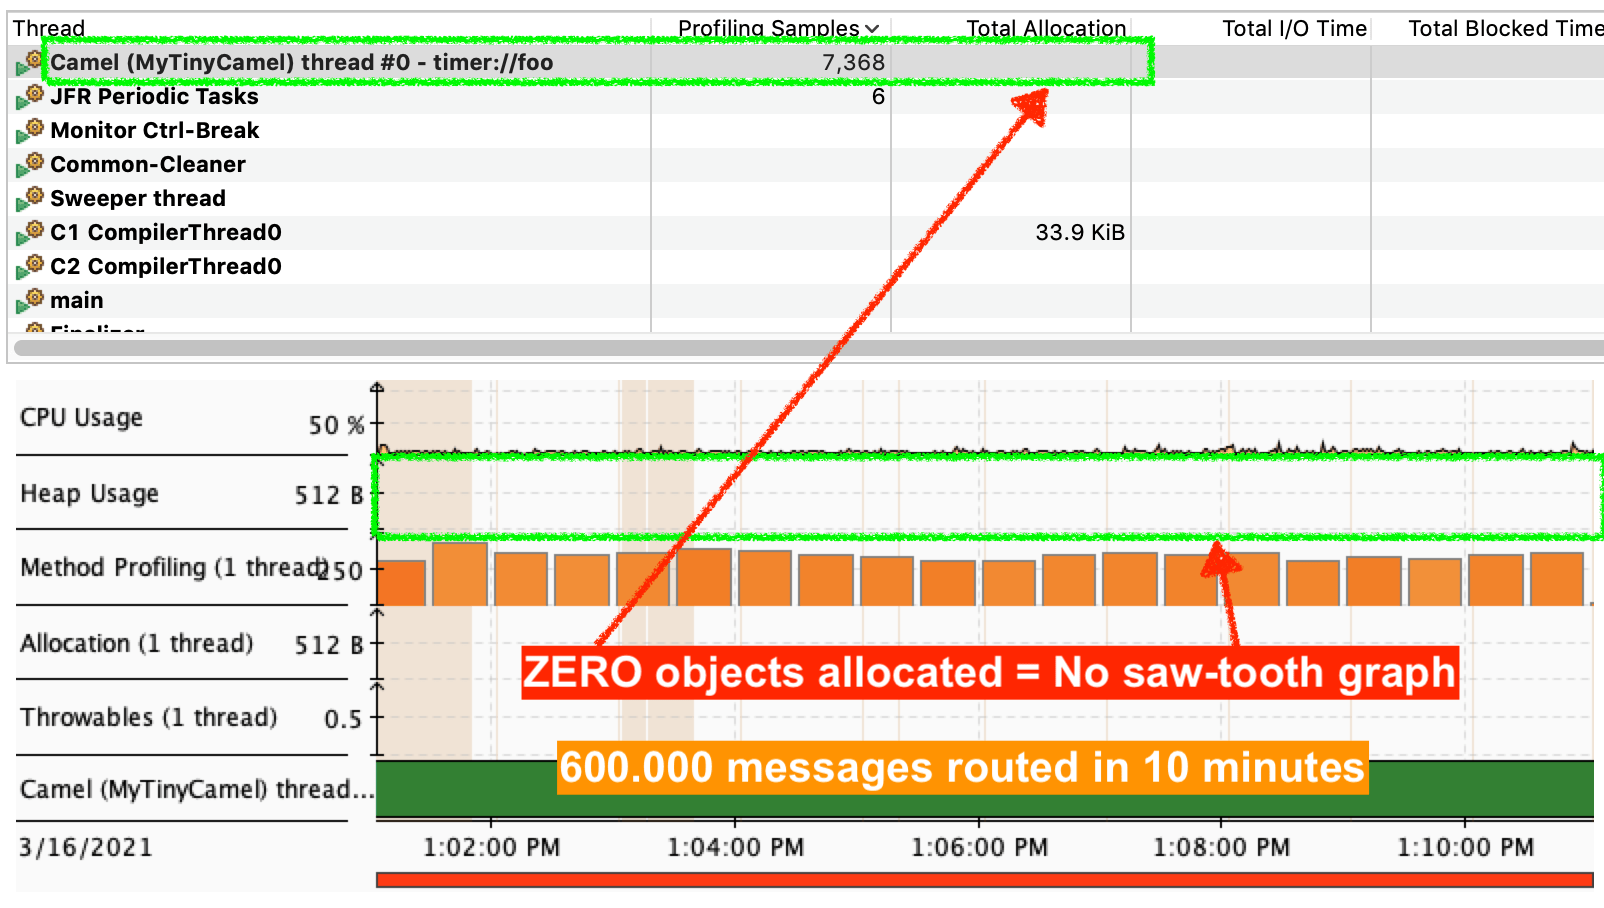
And in Camel 3.9 that is ZERO.
How did we get to zero?
That is a long journey that started about a year ago, and we have gradually optimised Camel which I have blogged about in the 6 parts preceding this post.
All this work is like pealing an onion, layer after layer. As one layer has been optimised, then the profiler reveals another layer, and so on. This time we could identify 5 areas for improvements:
- consumers
- core EIP patterns
- internal routing processor
- error handler
- exchange and message
The consumers are the source of incoming messages into Apache Camel. And so that is a great place to start. It’s the consumers that allocate a new exchange, populate the exchange with message data such as body and headers.
After that it’s the internal routing engine that routes the exchange via EIP patterns. And here we identified several spots where we could eliminate object allocations, or reduce allocations when some features are not in use etc. Error handling is one of the most complex part in the core Camel, and it uses objects to keep state in case of exceptions to handle redeliveries and whatnot. We were able to split the error handling into two tasks that operate either as a simplified or complex task. In the core EIP patterns we were able to optimize code that reduces object allocations.
The 5th area we optimized is the exchange object. EIPs and the Camel routing engine store state per exchange on the exchange instance itself as exchange properties. That data is stored in a Map which means for each entry both a key is allocated in the java.util.Map. We optimized this to use an internal object array where each key is hardcoded as an index entry in the array. That means read/write is very fast and simple as its just an array index.
And then we ….. cheated … instead of allocating new objects (via new constructor) we recycle existing objects from the previous exchange to the next. In other words we are using a sort of object pooling – this feature is called exchange pooling in Camel.
Exchange Pooling
The diagram above with ZERO object allocation is in fact with exchange pooling enabled. If exchange pooling is turned off (default), then the diagram should have been as below:
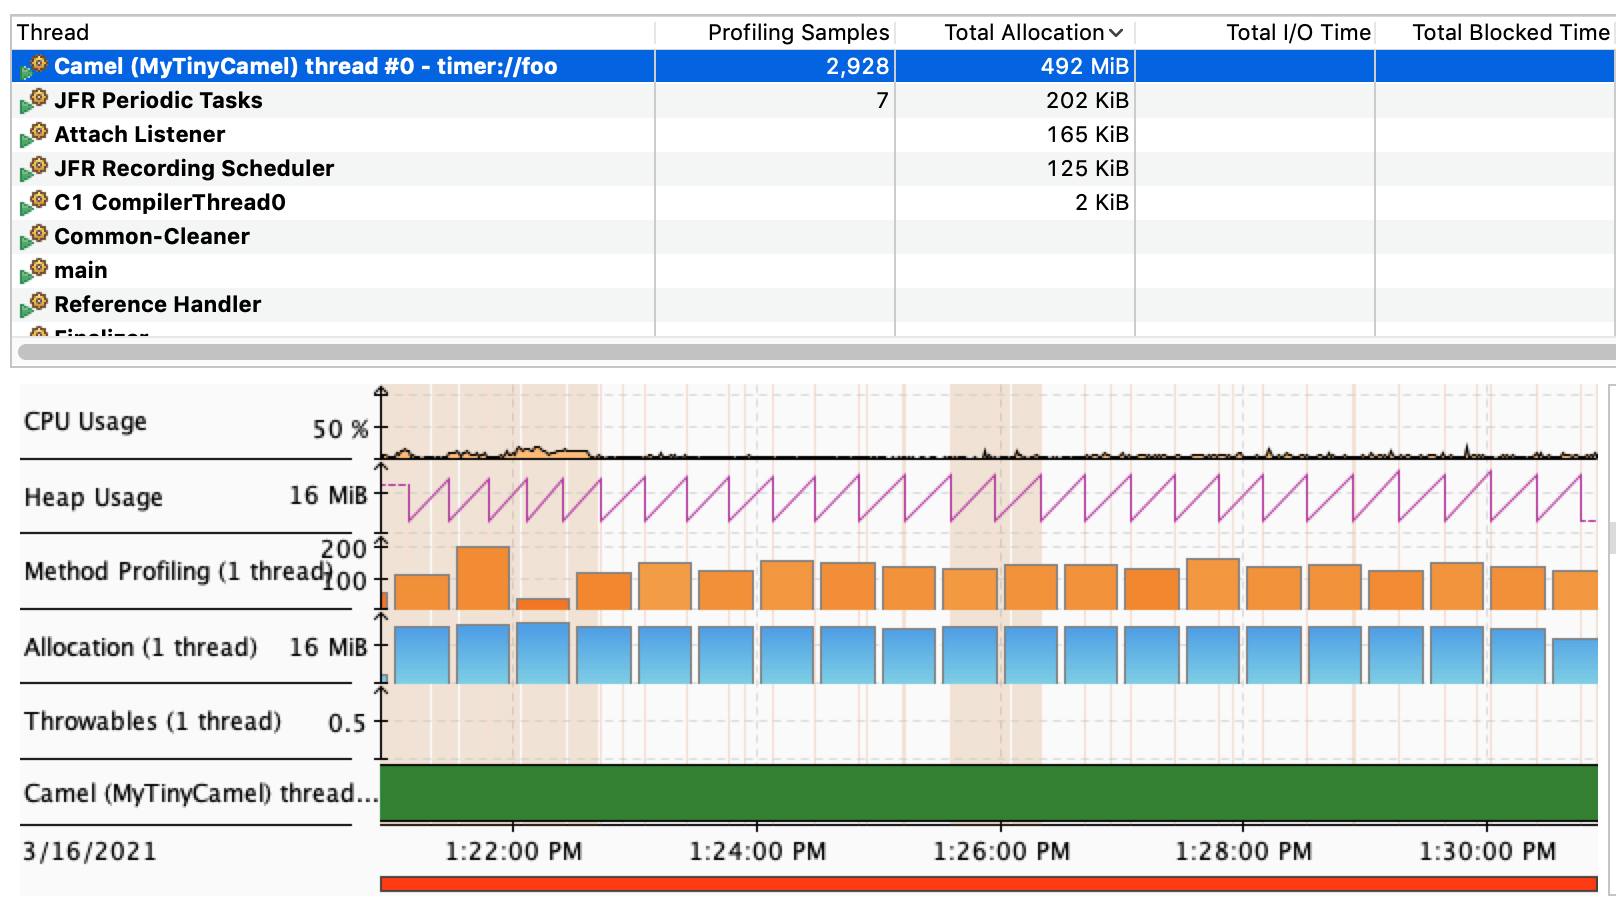
As you can see there is saw-tooth graph. However the total object allocation is gone down from 597mb to 492mb (18% reduction).
Awesome this is fantastic. And yes indeed it is. However when using anything there are both pros and cons, and so with object pooling. There is tiny tiny overhead of Camel to manage the object pools, and to “scrub” objects before they can be recused. That is a possibly a very very tiny CPU overhead compared to the JVM allocate and initialise new objects; instead of pool reuse. The biggest con is object leaks .. if objects are no returned back in the pool. Therefore you can turn on statistics which will report a WARN if a leak is detected when you stop Camel. The objects must be manually returned back into the pool, which we have coded in all the Camel components, and of course in core Camel. Now object leaks in this situation is not severe as you just have a situation as if there are no pooling, the JVM will create a new object – so the object allocations goes up, but its not severe like a database pool leaking TCP network connections.
Upcoming work
There are a few very complex EIP patterns and Camel component which does not yet support object pooling. We have this on the roadmap for Camel 3.10.
Camel 3.9 is planned for release in March 2021.
Published on Java Code Geeks with permission by Claus Ibsen, partner at our JCG program. See the original article here: Apache Camel 3.9 – No more saw tooth JVM garbage collection Opinions expressed by Java Code Geeks contributors are their own. |
