In the upcoming Apache Camel 3.8 release we have a new Camel component to integrate with Java Flight Recorder.
Camel is now capable of capturing “work steps” during startup that can be recorded with Java Flight Recorder. This can be used to better diagnose and find where your Camel applications may be slow to startup, for example due to a misbehaving component or custom user code.
The screenshot below shows a recording that has captured a Camel application that takes about 3 seconds to startup. Its a very tiny application so we expected it to be faster.
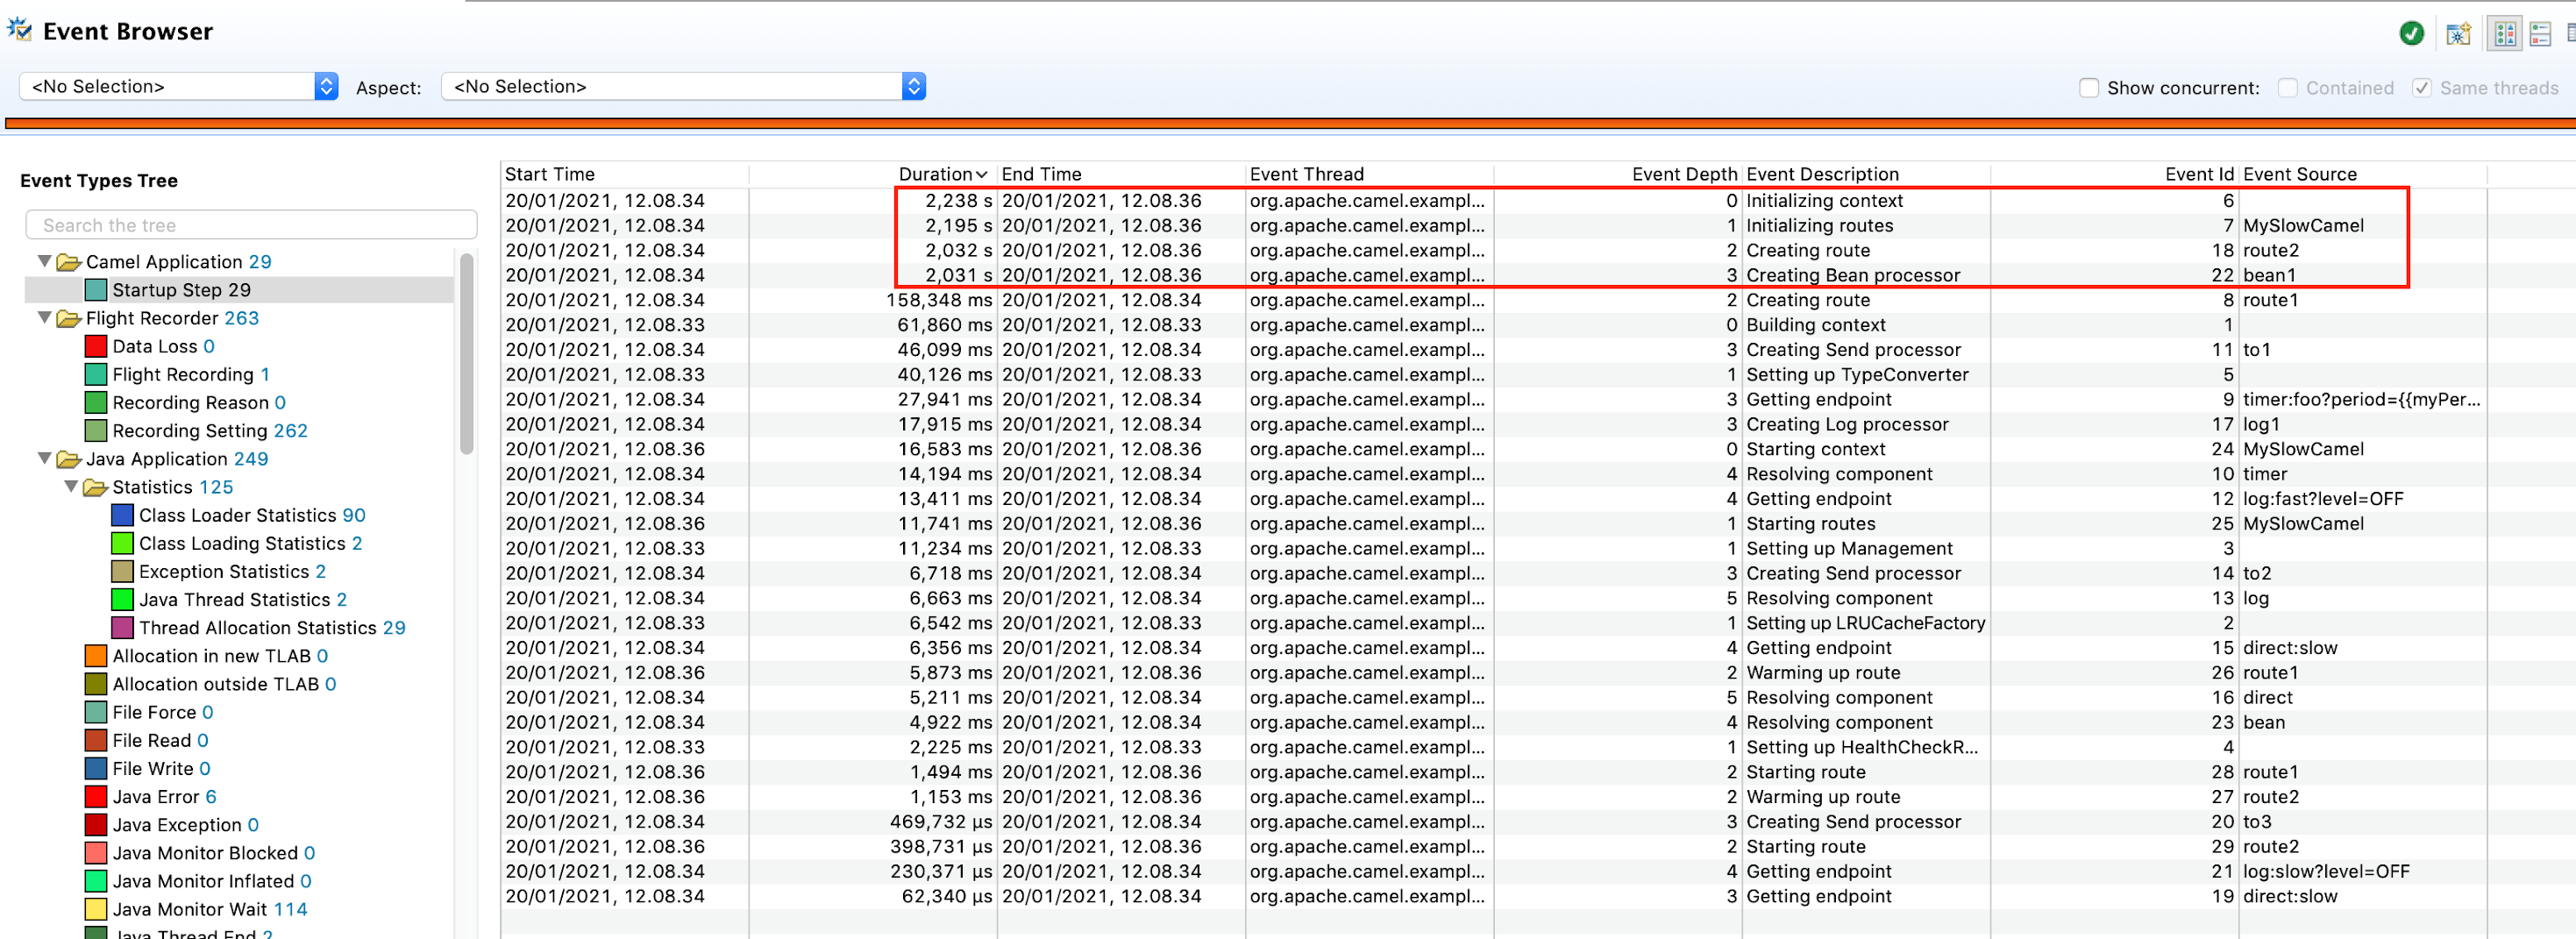
If we sort the events by duration in the JDK mission control, we can see that there are 4 events that take over 2 seconds.
The sequence is a sequence of the following step (sub step):
Initializing context -> Initializing routes -> Creating route (route2) -> Creating Bean processor (bean1)
What we can see is that the step with the highest depth is “Creating Bean processor” which takes about 2 seconds. This is the culprit of the bottleneck.
If we check the Camel route for where bean1 is in use, its in route2 at:
from(“direct:slow”)
.to(“log:slow?level=OFF”)
.bean(MyBean.class, “hello”);
Here we can see the bean is using MyBean class, which we can then look at next:
public MyBean() {
// force slow startup
try {
LOG.warn(“Forcing 2 sec delay to have slow startup”);
Thread.sleep(2000);
} catch (Exception e) {
// ignore
}
}
Ah okay here is the problem. The bean is sleeping for 2 seconds. Yes of course this is a made up example, but it does affect the recording and allow us to find it via the JDK mission control tool.
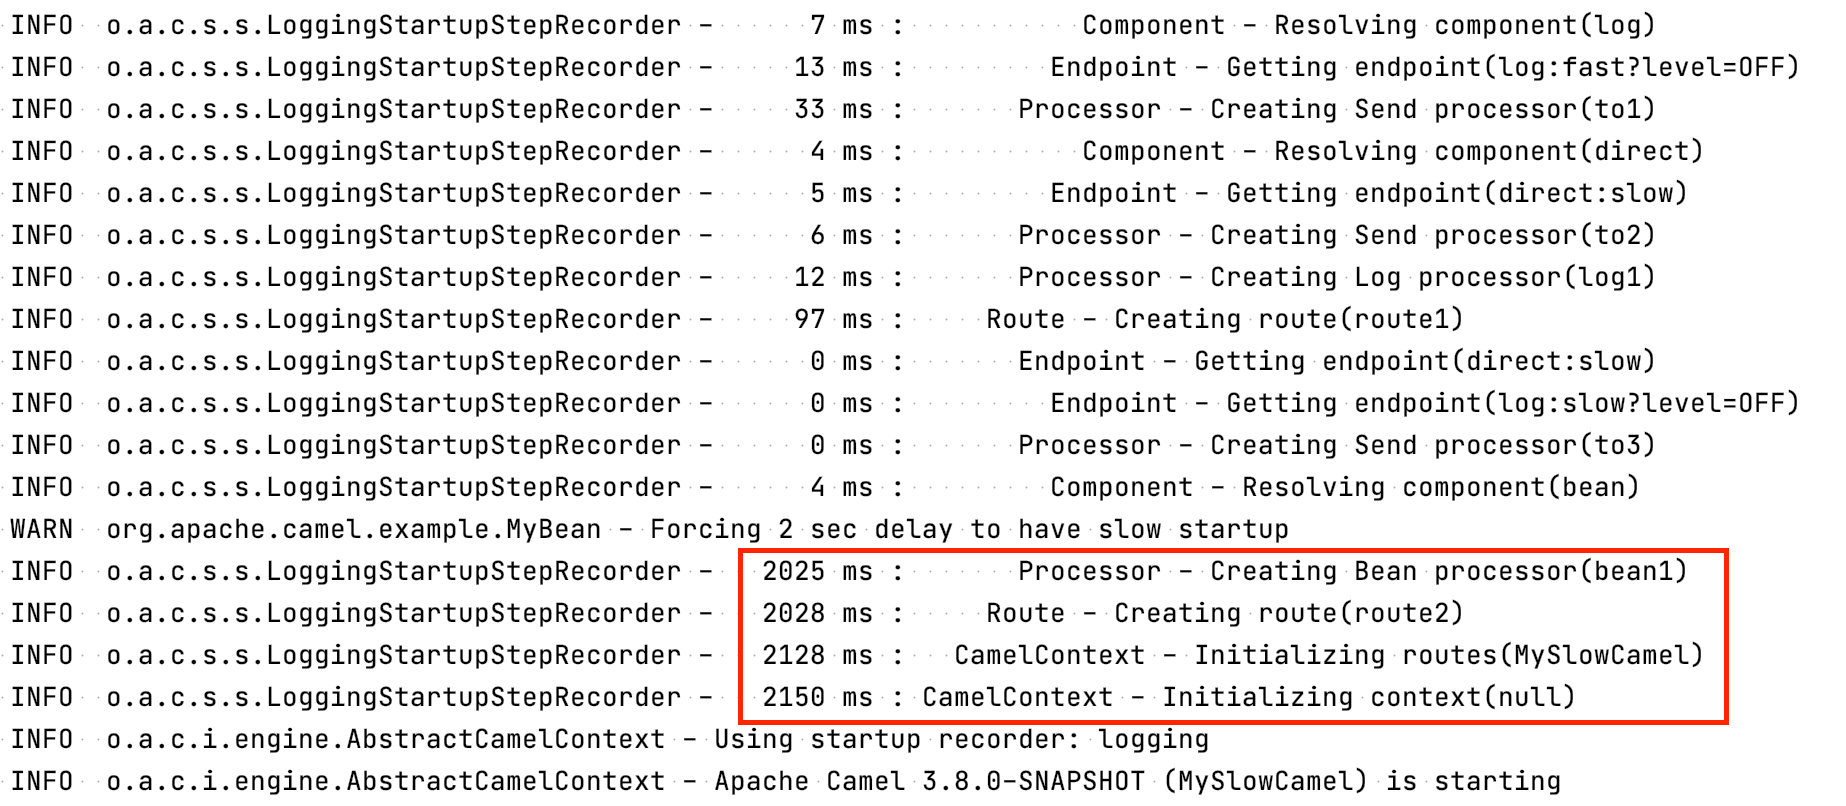
We also offer a logging recorder where you can “see” some of the same information as in JDK mission control. However when using JDK mission control, you have the entire JFR recording that also captures alot of JVM information about CPU and memory use and whatnot.
To use Java Flight Recorder with Camel, all you have to do is to add camel-jfr on the classpath. Then Camel will auto-detect this and enable it. You can configure the recorder with various options which will be documented as part of the common options.
But for quickly finding startup bottlenecks for Camel applications then the logging recorder is a good start. The screenshot below shows the logging output, and as you can see from the red square we have identified where the “2 second” problem is.
The logging recorder comes out of the box in camel-core, and you can just use it by configuring:
camel.main.startup-recorder = logging
If you are using Camel Main, Camel Quarkus etc. And for Spring Boot, you can enable it with
camel.springboot.startup-recorder = logging
You can also set a custom recorder, or one of the out of the box implementation via Java code:
camelContext.adapt(ExtendedCamelContext.class)
.setStartupStepRecorder(…);
You can try this example (camel-example-flight-recorder) from the Camel Examples git repository. From command line you can run
mvn camel:run
And Camel will automatic capture a JFR recording and save to disk. The output of the file is shown in the log, which you can then open from JDK mission control.
Published on Java Code Geeks with permission by Claus Ibsen, partner at our JCG program. See the original article here: Apache Camel 3.8 and Java Flight Recorder Opinions expressed by Java Code Geeks contributors are their own. |
