Hi, my name is Ray, and I’m a software architect.
According to my old boss Jeroen van Rotterdam, this means that I draw boxes and lines. In practice, it’s only a small part of what I do, but I do think it’s an important part.
Some people may wonder why, in the age of working software over comprehensive documentation, one would still spend time on creating pretty pictures. Didn’t we leave all this up front, non-code fluff behind? Well, I do value working software more than comprehensive documentation, but that doesn’t mean there is no value in documentation.
I work with several “central” teams that provide shared services to “local” teams. In such discussions, it’s quite often useful to be able to point to a high-level architecture of the system. Something like the context diagram of the C4 model. Such context diagrams were also of great value during the due diligence phase of the recently announced sale of our division. Drawing a context diagram takes very little time, provides clear benefits, and requires little maintenance, so it’s really a no-brainer.
What about other types of diagrams?
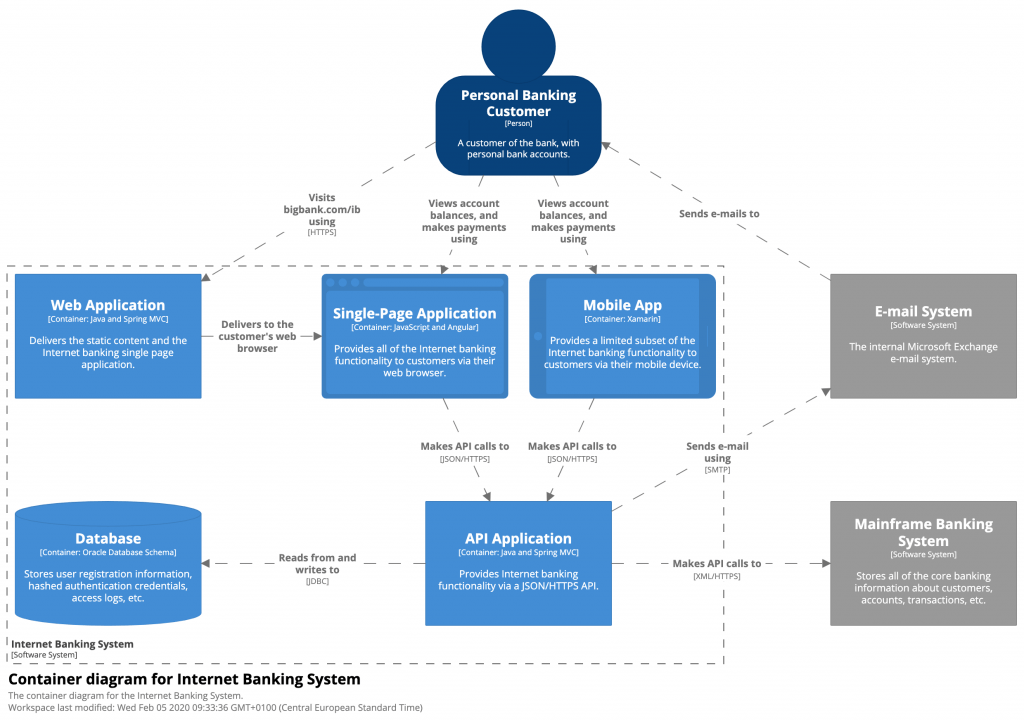
The C4 model has several other diagrams. Which ones you need depends on your context. If all your code goes into a single war that you deploy to an application server, for instance, there is little point in creating a container diagram, but a component diagram may be useful. If, on the other hand, your system consists of quite a few microservices, then a container diagram that shows how they are connected may be very valuable, but a component diagram would probably be overkill.
If you work in a larger organization, with lots of teams building lots of systems, then having a diagram standard in place like the C4 model is a great way to reduce the time needed to explain a system to others and to prevent misunderstandings.
You will probably want to “personalize” that standard to make it more expressive for your particular context. For instance, we use color coding of elements on container diagrams to indicate their status: red for things we are ready to remove, orange for things we want to migrate away from, yellow for things we want to review, green for things we’re happy with, and blue for things we’re planning to build in the future.
Such an adaptation of the C4 standard doesn’t reduce the value of the standard if most or all of you communication is within your organization where everyone uses the same adaptation. If, however, you routinely use diagrams in communication with outsiders, you may want to minimize your adaptations, or at the very least provide a legend with your diagrams.

The standard should be used everywhere you draw visual representations of your systems, like in whiteboard sessions and in Architecture Decision Records. Consistent use of the standard turns it into a ubiquitous language for visually representing your systems, eliminating ambiguities.
If you have a standard that all your diagrams must adhere to, then you can build tooling around that. For instance, you could write a tool that generates a diagram from a simple YAML file that describes your system. This way, you bring the diagram closer to the code, improve consistency, and reduce the maintenance burden. I’ll come back to tooling in a later post.
There are other types of diagrams besides those in the C4 model that are useful in certain situations. For instance, sequence diagrams are great for showing complex interactions between systems. I’ll talk about some other diagram types in future posts.
Do you use C4 model diagrams? Are they worth the investment? Please leave a comment.
Published on Java Code Geeks with permission by Remon Sinnema, partner at our JCG program. See the original article here: Architecture Diagrams Opinions expressed by Java Code Geeks contributors are their own. |
