I’m fortunate enough to work for a large organization which supports its engineering efforts with excellent, albeit expensive tooling. One of the tools that I have at my disposal to monitor and troubleshoot my applications is New Relic. New Relic offers a variety of monitoring products, but chief among them is its application performance monitoring or APM solution.
In this article, I’d like to share what I found when comparing the features and usability of New Relic with AppOptics. AppOptics is an APM solution offered by SolarWinds. My objective in comparing these products was to find a comparable and lower-cost alternative to New Relic. I’ll be comparing features of both tools to see how they stack up with one another.
Features I’ll Be Comparing
It would be easy to pick features that both products have and compare them, but I wanted to take a different approach and list out the features I use with New Relic and see if those same features occur in AppOptics and how they measure up.
I use New Relic as a tool to view and analyze the performance of microservices which I have deployed into the AWS cloud. The New Relic client gathers a plethora of metrics from each node. It provides me with a view into performance data at an application level, and allows me to drill down into data from each instance. Typically, these are Java-based microservices, so in addition to application and system metrics, I’m interested in JVM metrics as well.
Some of the metrics which I’ve found most helpful for troubleshooting and optimizing performance are:
- Application Performance Metrics
- Transaction Times
- Request Counts/Throughput
- ApDex Score (Application Performance Index)
- Error Rate
- Hardware Metrics
- CPU Usage
- Memory
- Disk Utilization
- Network I/O
- JVM Metrics
- Heap and Non-heap memory usage
- Thread count
- Garbage collection
I’d also like to look at options available to automate the process of monitoring and notification of support personnel in cases where services might be experiencing high error rates.
Sign-up and Installation of the Client
Both New Relic and AppOptics offer a 14-day free trial, and neither require a credit card to sign up. I was able to sign up for both trial versions within a few minutes and found the process similar for both products. I decided to use the trial versions of both products to ensure a common baseline for comparison.
Both products require the installation of a client on the devices you would like to monitor. Before receiving instructions on how to install the client, you’ll be required to select both the language used for the application and the operating system on which it is running.
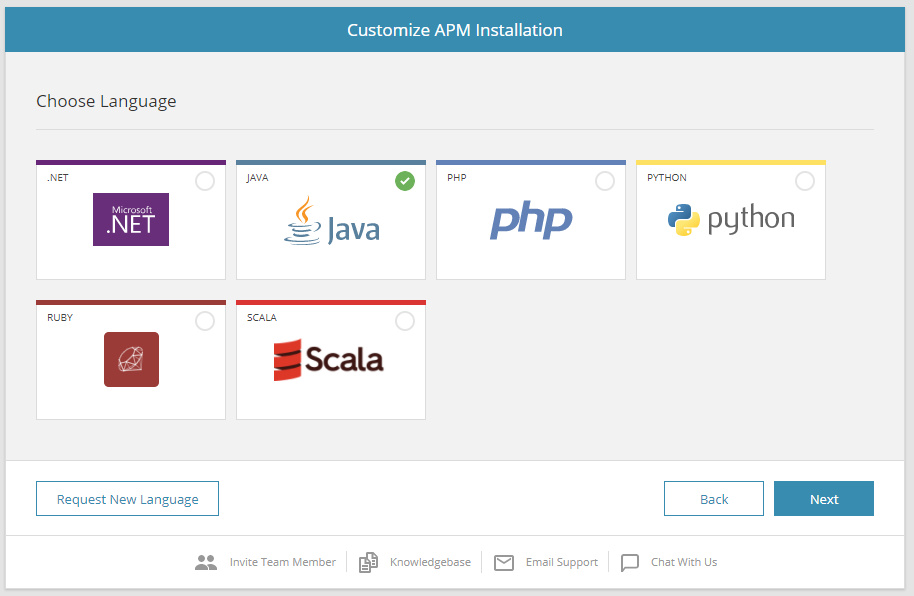
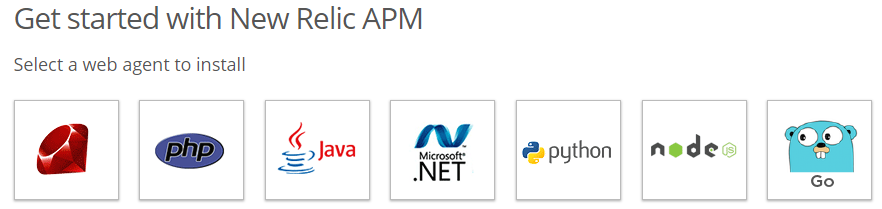
Except for New Relic’s support of Go, both offered the same selection of language and operating system support. Installation of both clients requires you to have root access to the target device, and instructions explaining how to download and install the clients were detailed and specific.
One difference between the two installation processes was that AppOptics allowed me to download the Java agent directly onto my host machine. The process involved execution of a pair of customized statements from the command line. Following that process, all I needed to do was include the Java agent as a parameter when starting my application, and data began to flow to AppOptics as soon as I restarted my app.
In my case, I was running a simple SpringBoot project, which was built using Gradle. I installed the AppOptics agent in /opt/appoptics and then added the following function to my build.gradle file.
bootRun {
        jvmArgs = ["-javaagent:/opt/appoptics/appoptics-agent.jar"]
}
The New Relic installation required me to download a zip file from the New Relic website to my development machine. I used SCP to upload the file to my EC2 instance. After that, the installation process was similar to that of AppOptics.
The New Relic agent did appear to support automatic installation into Tomcat, Glassfish and a couple of other application servers, but unfortunately, I wasn’t using an application server. I ended up unzipping the New Relic agent into /opt/newrelic and then added the following function to my build.gradle file.
bootRun {
        jvmArgs = ["-javaagent:/opt/newrelic/newrelic.jar"]
}
In both cases, it took a few minutes after I restarted the app for the agent to be connected and for the APM provider to display the dashboard.
Initial Impressions
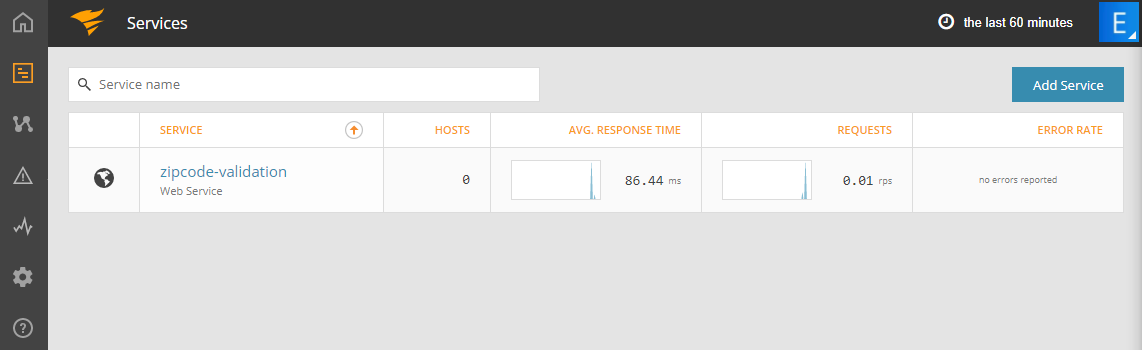
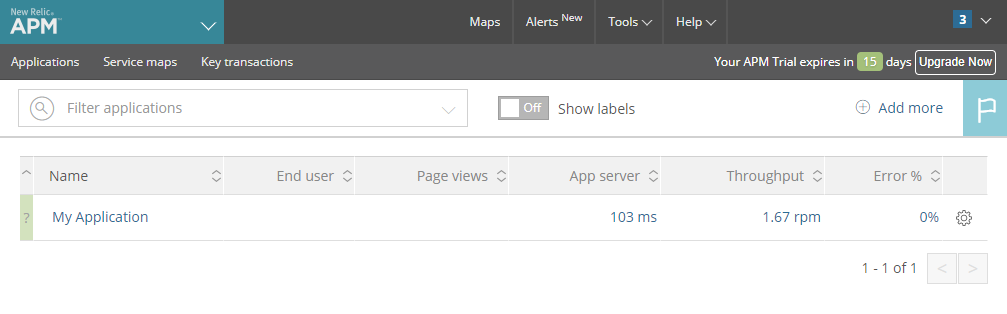
I’ve been using New Relic for three years, and when I first pulled up the Service Overview dashboard on AppOptics, it felt very familiar. Let’s start out at the main page looking at the list of available services for each tool.
I honestly preferred the AppOptics home screen a little more. When adding a new service, you select the name as the first step, whereas New Relic assigned a default name which you can later edit. Both services showed essential metrics next to the name of the application. AppOptics included graphics, and I noted that requests are measured by second, instead of by minute.
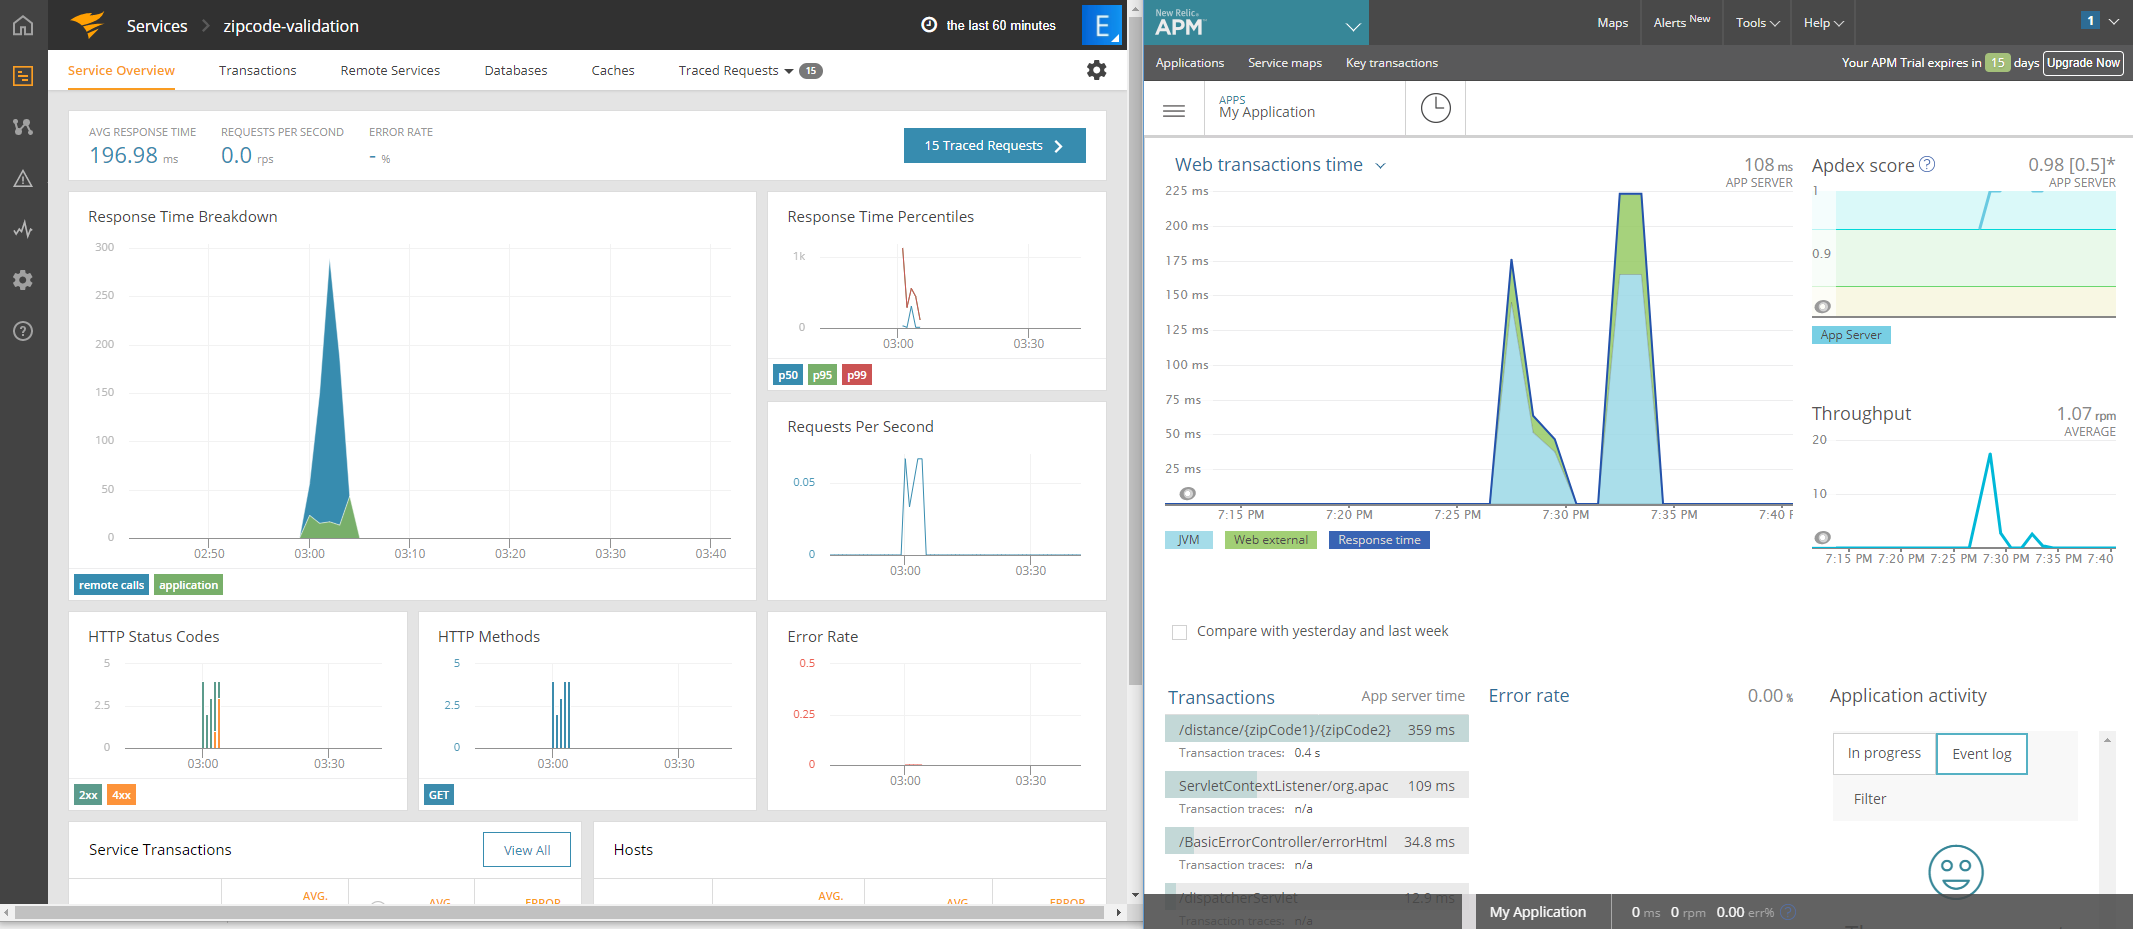
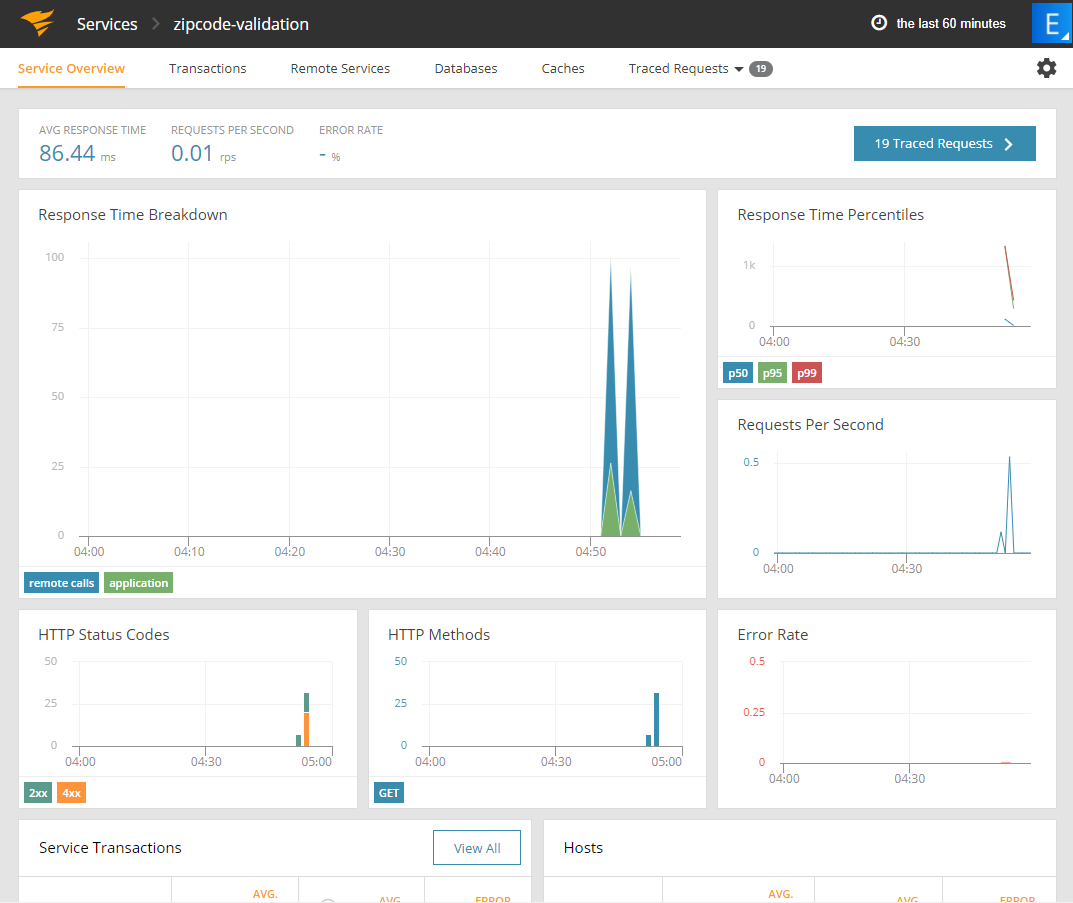
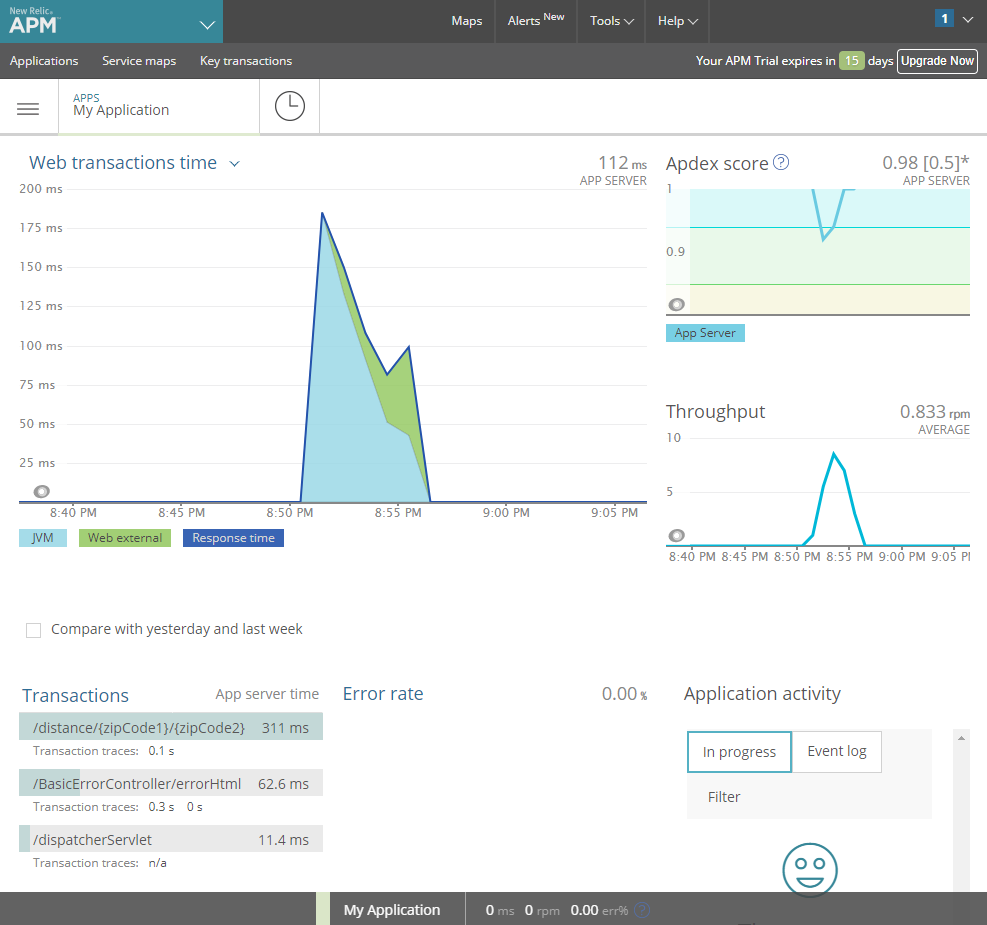
On the dashboard for the service, response time is shown prominently in both tools. The AppOptics dashboard included a summary at the top of the dashboard, specifying average response time, requests per second, and error rate. These are key metrics when determining the health of your service.
Both tools take a mostly graphical approach to their dashboards, with AppOptics presenting all of the data in a graphical or tabular form. From an aesthetic and ease of interpretation perspective, I much preferred the presentation provided by AppOptics. Clear boundaries and consistent data formats between all of the main elements made it easier to transition between data elements mentally.
While AppOptics appeared more straightforward to view, New Relic did seem to provide more access to my data. We’ll look at Infrastructure monitoring next, but I was able to jump directly to the infrastructure dashboard for each of my hosts directly from the primary dashboard.
Both tools allow the user to specify the time window for the data and provide some additional links—located at the top of the dashboard in the case of AppOptics, and from the left-hand navigation menu for New Relic. Both offer a detailed view into transactions processed by the service, remote service calls, and database metrics among others. I wasn’t able to locate any JVM data from the AppOptics dashboard. According to what I found online, JVM performance metrics are offered by AppOptics, but perhaps I needed to install the agent on an application server like Tomcat or Jetty.
Infrastructure Monitoring
With both tools, infrastructure monitoring required steps in addition to the initial installation of the client. AppOptics required an additional command to execute from the command line, and New Relic needed enrollment in a free trial of their Infrastructure product. New Relic also used a slightly different installation process, which required the installation of an additional yum repository. Each step was provided clearly in the instructions.
As with the application listing, the Infrastructure tab for AppOptics lists the hosts available and presents essential metrics with small graphs alongside each.
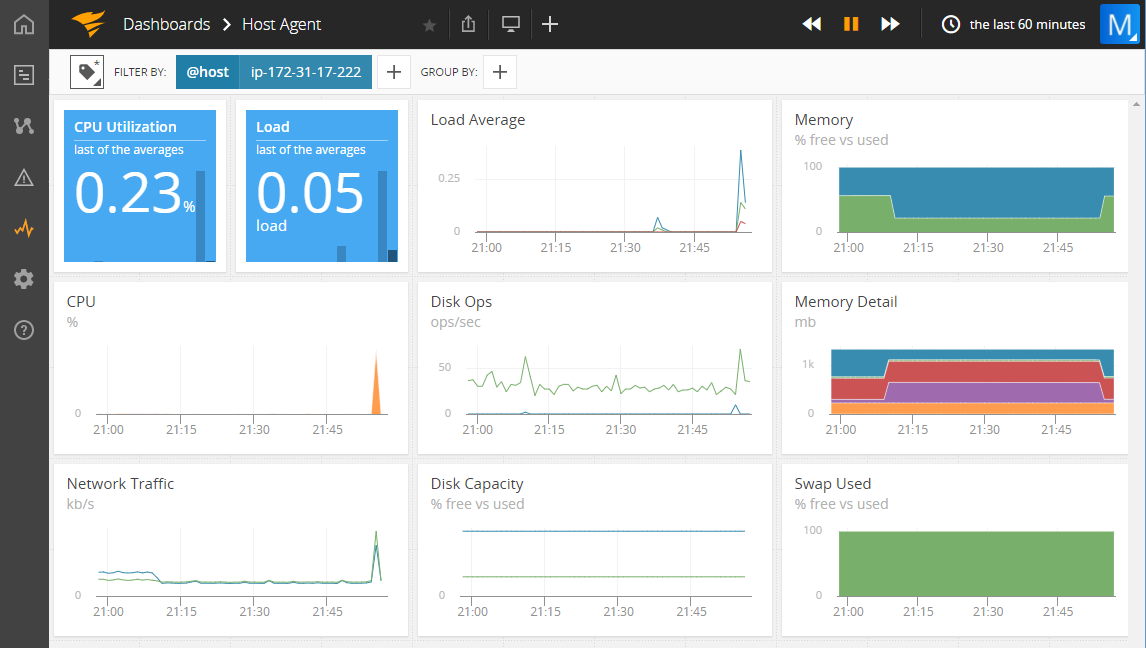
In New Relic, you can navigate to the hosts for each application from the application dashboard, and I wasn’t able to find a listing of all monitored hosts. Looking at a single instance for this comparison, I liked the ability to see the status of my instance in summary form. I was unable to find a connection between the host and a specific application. In a situation where a team may be supporting more than 10 or 20 instances, the approach taken by New Relic may make it easier to navigate to specific instances.
The specific dashboards for each host were presented similarly to the application data. AppOptics employed mostly graphics panels in a very clean and symmetrical layout, while the New Relic dashboard used a variety of display types to view the data—and while more data was available, it required navigation to different tabs to view all of it.
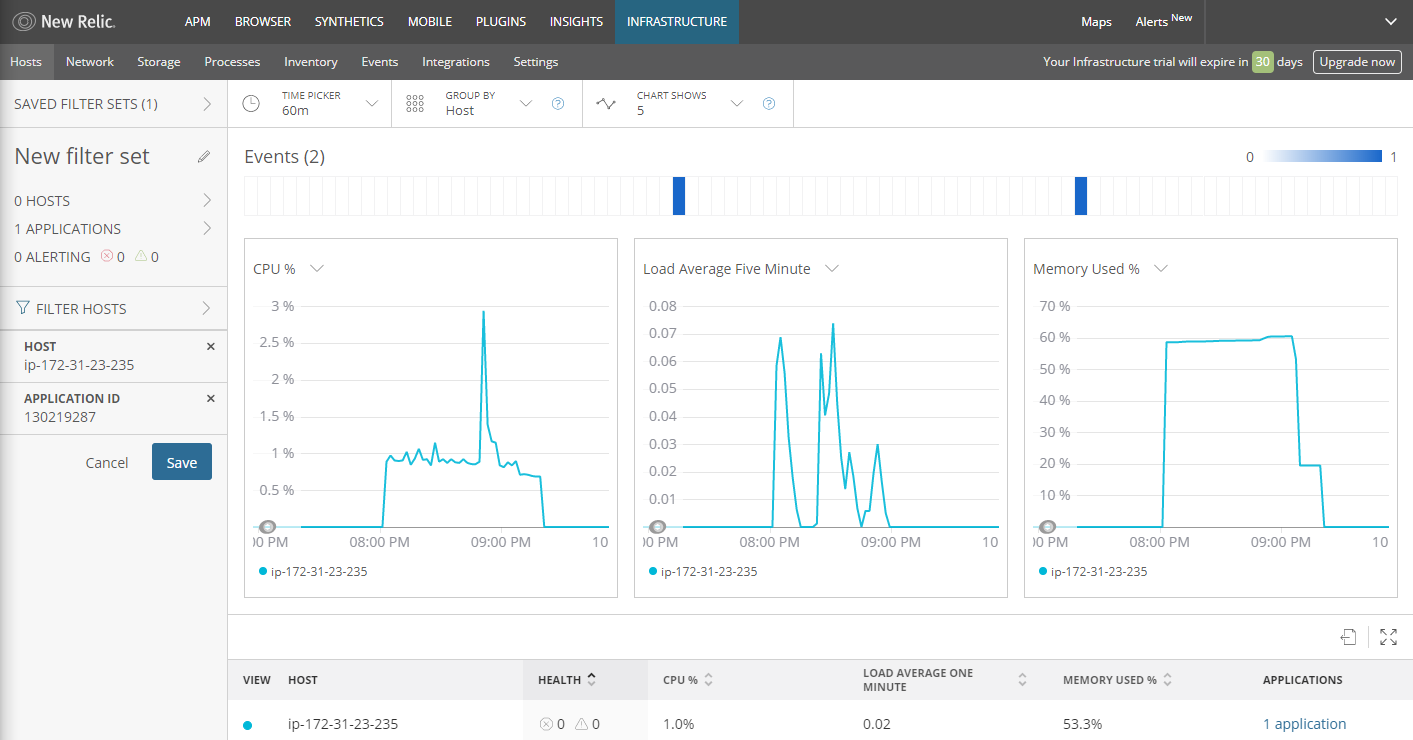
Both tools provide the ability to explore the data in each graph by clicking on a link in the top right of each graphic. New Relic also had the option to create an alert from each metric. We’ll look at alerts next.
Automated Monitoring with Alerts
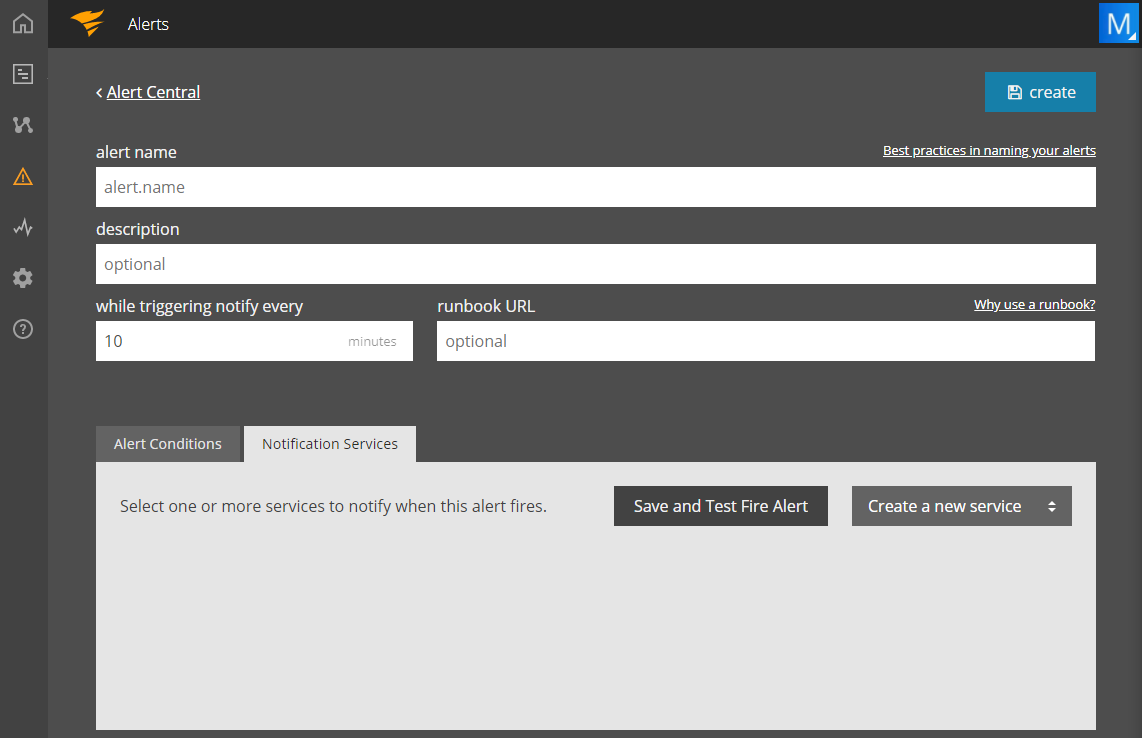
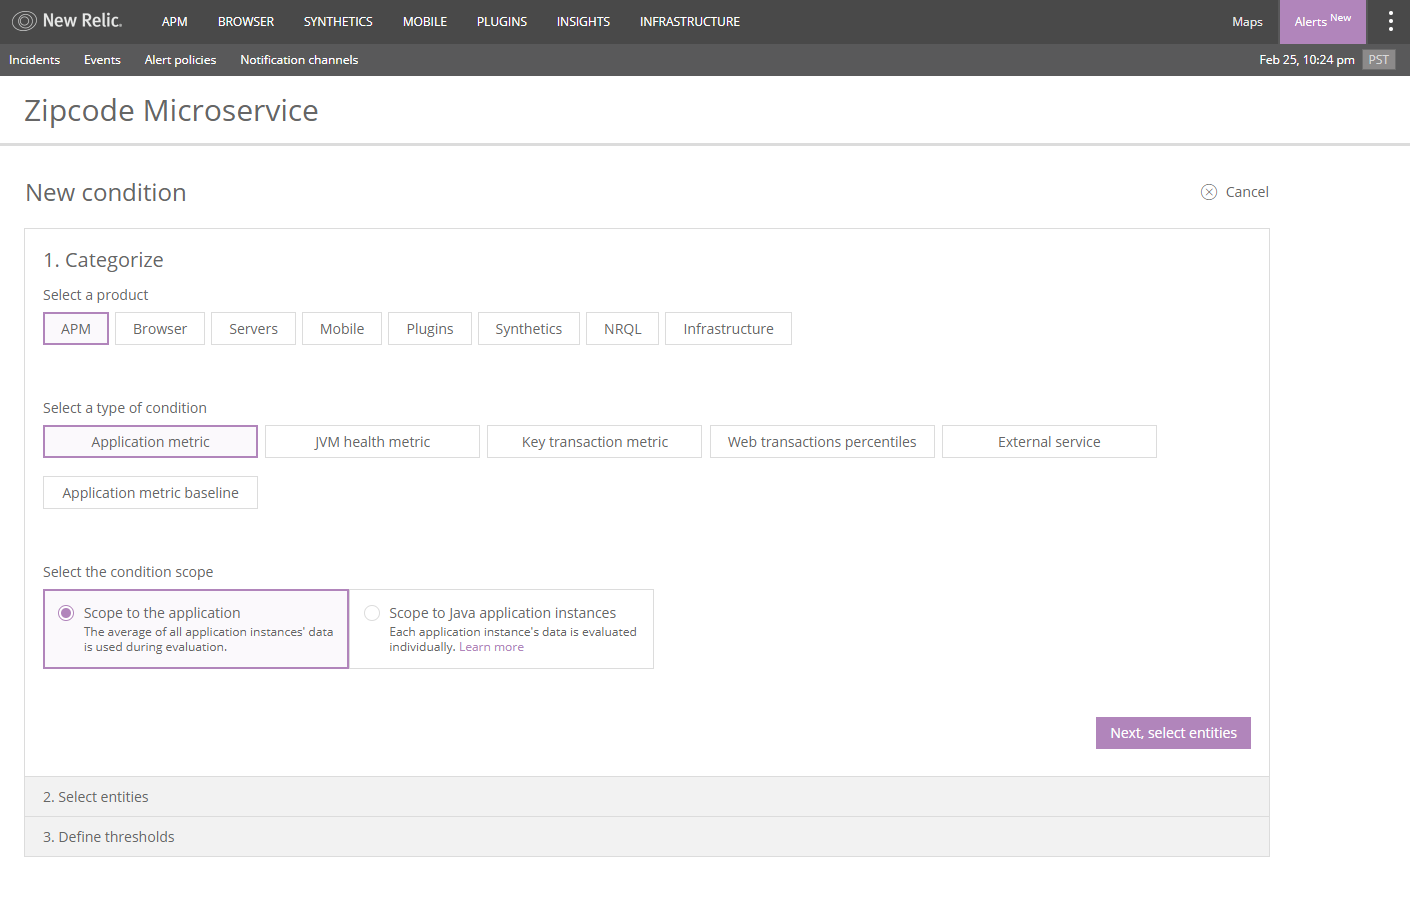
New Relic and AppOptics both provide the ability to add alerts. I found the process of setting up an alert on AppOptics more straightforward than the process on New Relic. New Relic provides the ability to create alerts on all of its products, with additional options. AppOptics did not (such as the ability to define the scope of the alert), either across all instances, or targets at individual instances.
Both tools offer alert integrations with a sizable collection of notification services, from email to Slack, and while AppOptics appeared to have more integrations, both services listed the primary services which I see on a regular basis in our industry.
Conclusions
Overall, I found both tools to be remarkably comparable based on my initial criteria. Both tools provide the tools necessary to perform routine monitoring of applications and services and assist in alerting support staff when problems arise, providing essential data to help in the resolution of those problems.
New Relic offers additional products such as New Relic Synthetics and Insights which may provide organizations with additional monitoring options. The tool seems to offer more data points. However, I found it wasn’t always intuitive as to where that data was located, and the data was not necessarily provided in an easily viewed format.
New Relic may be better suited to larger enterprises which support a large number of devices concurrently and have the necessary support staff to customize and configure the tool to meet the needs of the organization.
Compared to New Relic’s modular approach in available functionality, I felt that AppOptics provided a more holistic solution that was marginally easier to install and begin viewing and analyzing data. AppOptics would likely require a shorter learning curve for new users of the system, due to its intuitive navigation and more consistent presentation of the data.
All things being equal, there isn’t a wrong choice you can make in selecting between the two.
However, if you are concerned about budget, and are asking whether AppOptics is a comparable low-cost alternative To New Relic, I would have to respond with a resounding yes. AppOptics offers a lower cost, both for the tool itself and in the training needed to be proficient—all without sacrificing functionality when compared with New Relic.
