The Modern Java Monitoring Stack: How to Reverse Engineer the Ideal Setup for Your Production Environment
How can you build the ideal Java production monitoring stack? A decision maker’s guide to the tooling ecosystem
Over the last couple of years we’ve had the opportunity to talk with hundreds, if not thousands, of engineering teams. Throughout those discussions and our engineering team’s own pains, a few similarities started to surface and we thought it would be a good idea to put this new-found knowledge into writing.
It all comes down to this. Monitoring is a tough job to get done right, and a big part of it lies in the tools and processes you build around it. Choosing the right tool for the job has a huge importance here, and we’ve identified 3 tool categories that most companies can’t do without.
In this post, we’ll share these findings and suggest a new framework for choosing what to focus on when planning your production monitoring stack. We will talk about:
- The Importance of Planning for Observability
- Observability in the Context of Production Environments
- The Symptoms of not Planning for Observability
- How to Reverse Engineer Root Cause Detection
- Core Use Cases for Popular Monitoring Stacks
1. The Importance of Planning for Observability
First, let’s talk about what we’re trying to achieve with monitoring. Let’s talk about Observability.
Testing and pre-production environments are great for making sure your application is ready to be deployed, but they never cover 100% of the errors that your user will experience. On the other hand, you can’t rely on users to report every issue they encounter. And when they do report it, you can’t rely on their report to reproduce the error. That’s where the importance of planning for Observability kicks in.
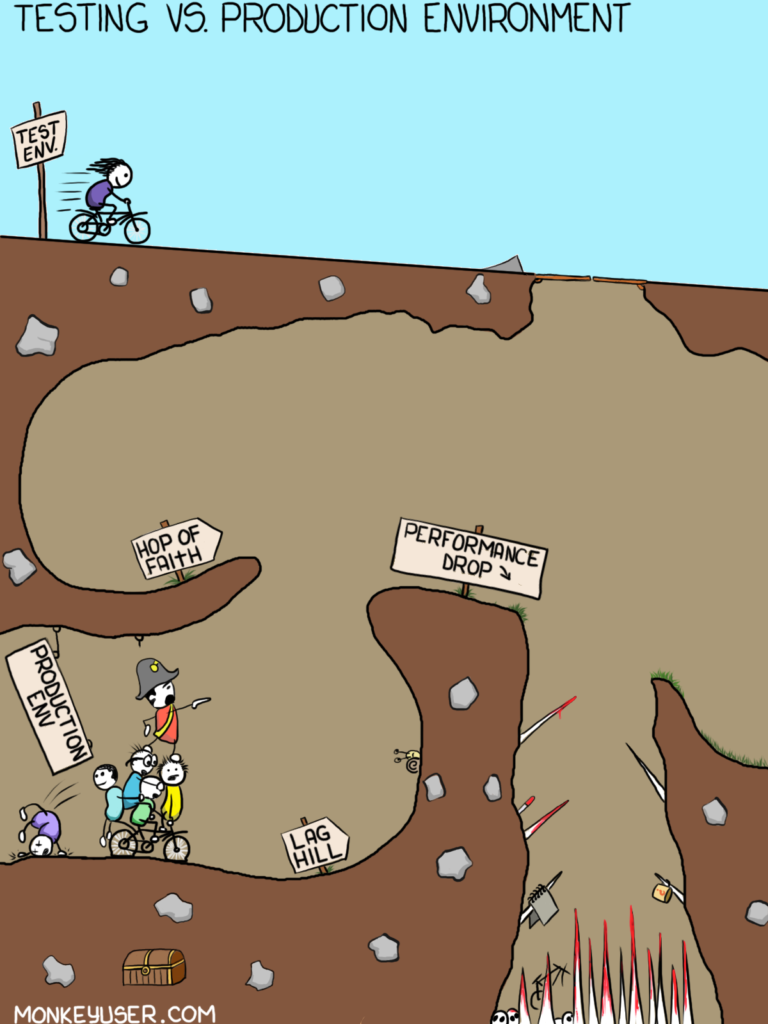
Testing vs. Production Environment via monkeyuser.com
This comic strip from monkeyuser.com illustrates the concept pretty well. In your testing environment, the horizon is clear and you’re covering the obstacles you’re planning ahead for, but in the underground environment of production, things can get pretty dark. The obstacles are different and you can’t see that far ahead.
It’s amazing how even today, the question…
“How do you know a new deployment introduced errors into your system?”
…is usually answered by saying:
“Well, we deploy our code, and then, we wait. If a day or two pass by and no one starts screaming about something, we know that we’re in the clear.”
The good news is that it doesn’t have to be like this. Enter Observability.
2. So What Is This Observability Thing You Keep Mentioning?
The term Observability comes from the field of control theory. An interdisciplinary branch of engineering and computational mathematics. It’s a measure for how well internal states of a system can be inferred by knowledge of its external outputs.
Adapted to operating complex applications in production, we can think of it as a measure for how well we understand what’s going on under the hood of an application once it leaves the safe and warm dev or testing environment and real data is thrown at it at scale. And a lot does happen there. This is a topic that we frequently explore and covered extensively in an eBook which you can read right here.
The bottom line is that we’re only as knowledgeable as the external outputs of the application we monitor. We need to architect for Observability and plan ahead in order to make informed decisions on the issues we need to tackle next, and how to tackle them, without wasting time on troubleshooting errors.
Observability is how you know, WHEN, WHERE, and most importantly WHY code breaks in production. It’s easy in development where you’re basically Neo after he figured out how to manipulate the matrix. Everything is under control, and you have debugger to step through the code. In production, the situation is different.
3. The Symptoms of not Planning for Observability
When you don’t have the necessary tooling in place to help you understand what happens in production, this lack of foresight leads you to a lack of Observability which then leads to a lack of knowledge of what’s happening with your application.
Kind of like the famous quote from Yoda in Star Wars about the path to the darkside.
Not planning for Observability makes you reactive, rather than proactive. You can’t assert how your application is doing without relying on manual user reports and other manual processes like debugging with logs, that take days or weeks to complete.
And that kind of sucks. It’s actually one of the top 10 causes for unhappiness in developers, which we recently covered on the blog.
Let’s see what we can do to gain better Observability for our applications.
4. How to Reverse Engineer Root Cause Detection
We talked with engineering teams in companies like Fox, Comcast, Intuit, Zynga and others, and took a closer look into what they’re doing to maximize the Observability of their applications in production.
What they are finding is that their tooling and processes were not giving them sufficient Observability. They were often late to detect critical issues. There is just too much noise out there and when a new or critical error is introduced into staging or production, it is not detected amidst thousands, if not millions, of noisy events.
Frequently, as much as 75% of the time or more, it is the end user or customer that first detects the problem when the application or service is no longer acting reliably or is no longer available. They’re drowning in a sea of noise, that more often than not, is missing the actual root cause of the errors that they’re investigating.
Rather than accepting the current state as it is, we tried to find the ideal monitoring stack by reverse engineering it from the top sources for application failure. To do so, we asked engineering teams what those top sources are for them.
It turns out there’s actually a pretty definitive answer to that question.
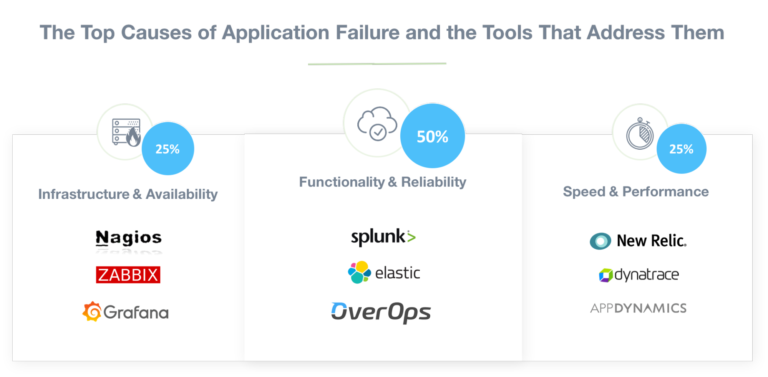
We found out that when production applications experience failure of any kind, the root causes behind these failures are derived from 3 possible sources:
1. In one bucket, there is a whole set of application failure problems that are due to infrastructure issues. And developer teams are seeing that this bucket is responsible for approximately 25% of their application problems.
2. In another bucket, there is a set of application failures that are due to speed and performance. And if they would have pulled their tickets and examined them, they would see that approximately 25% of application failures are due to this particular problem area.
3. And finally, there is a third bucket, the area of functionality and reliability, or in other words, “bugs” that is responsible for the largest amount of failures, approximately 50% of them. It is in this third bucket, the one that is responsible for the largest amount of application failures, that OverOps plays in.
We feel that this space is ripe for disruption and we have a technology that can radically improve the standard approach today. Additionally, it is important to note, that our technology can also complement the efforts in resolving speed and performance issues. A personal walkthrough of the technology is available right here.
Please don’t take our word for granted. Examine your own ticketing systems, and try to see how this distribution looks like for your own applications. That’s the best way to make an informed decision on where you should invest next.
5. Core Use Cases for Popular Monitoring Stacks
To wrap up the introduction of this approach for building a monitoring stack, let’s briefly cover some examples and use cases in each of the buckets we just introduced. While these tools have many features, we see that they’re mainly used for specific problems.
Infrastructure & Availability – 25% of Production Errors
This category includes tools to monitor the infrastructure and availability of your servers. Think of things like network health checks, response time, and uptime. Things like CPU, disk space, and memory utilization also fit in here.

Speed & Performance – 25% of Production Errors
Application Performance Monitoring (APM) tools fit in this bucket. We also published an in-depth eBook that covers the most popular ones, like AppDynamics, New Relic and Dynatrace, together with open-source alternatives. You can check it out right here.
The core use case for APMs is identifying performance bottlenecks, identifying transactions that take longer than usual to execute, and showing which methods within them are to blame.

Functionality & Reliability – 50% of Production Errors
In this bucket we have log management tools, and this is also where we chose to focus most of the efforts with OverOps.
Logs have been around for so long without much real change and innovation. We have log management tools that help make them searchable, but they’re only as good as the information that was printed to them in the first place. If something is missing, you need to add additional logging statements, deploy the code, and hope that the situation you’re trying to remedy will actually happen again! That’s a bit paradoxical.

In discussions we had, RJ Lim, a Senior Software Engineer at Zynga, told us “some problems are very hard to debug even if you have logs, and on some occasions they might not be debuggable at all. We needed something that could help us debug in production.”
And Dmitry Erman, Executive Director, Development and Architecture at Fox, told us: “As opposed to having developers search through logs or attach debuggers to the production or pre-production environment, OverOps gives us the exact conditions behind each error. We can see why it happened and if it’s critical for us.”
That’s basically the new thing OverOps offers in a nutshell, that’s what makes it unique. It enhances and complements your existing log analyzers and performance management tools, by automatically showing you the variable state behind all of your errors in staging and production. OverOps gives your team the complete source code and variable state needed to fix errors 90% faster.
Click here to watch a live demo.

Final Thoughts
Building a monitoring strategy is a tough job to get done right. Yet, we believe that this approach can help make things simple. Do you feel the same way? Which steps have you taken to choose the monitoring tools for your team? Let us know in the comments section below!
| Reference: | The Modern Java Monitoring Stack: How to Reverse Engineer the Ideal Setup for Your Production Environment from our JCG partner Alex Zhitnitsky at the OverOps blog. |
