Observability is not just about monitoring your system, it’s about understanding it
Monitoring your production environment is essential. Performance issues, errors and exceptions happen all the time and we have to know what’s going on. But how can we see when and why certain issues happen? That’s where the concept of Observability comes in, to help us gain an in depth view of the system and understand what exactly happened.
In the following post we’ll cover why it’s important to promote Observability within the company and how it can help you have better control on how it behaves in production.
Watch and learn from inside the system
The concept of Observability was introduced by American-Hungarian engineer Rudolf E. Kalman for linear dynamic systems. In control theory, it’s a measure for how well internal states of a system can be inferred by knowledge of its external outputs.
In order to simplify it, we can compare it to National Geographic. What’s the one thing nature documentaries have in common? During the episode we observe the animals in their natural habitat, so we can learn new things about them.
This learning is made possible via external outputs, in this case it’s the the film crew and their tools that watch and document every moment. Inside our company, we are the ones who’ll have to set up the tools to document our production environment and get the information we need in order to improve it.
Building Observability from scratch
Cory Watson, software engineer and head of the Observability team at Stripe, talked about Observability during the latest Monitorama conference. He spoke about his first day at work, and a question he asked that might sound basic to some: “How do I know that it works after I ship it?”.
After getting the (pretty terrifying) answer of “It’s fine, just ship the website” he understood that it’s time to bring the Observability concept into the company.
While most companies have some level of Observability, sometimes there’s not enough information to understand what’s going on. In most cases we’re not even aware of the data we actually need until it’s too late and the user is affected.
So what can we do? The go-to solution is creating a dashboard or using a tool to identify patterns or issues that we’ve already encountered in the past, hoping they’ll happen again and this time we’ll catch them. Instead, the focus should be on a proactive approach, that will allow catching unknown issues in time and understand how to handle them.
This mean that we have to shift our way of thought. Sure, we need to handle the current issues on hand but what about things that have yet to happen? Do we think that a user might not complete a certain transaction? Will the system be able to handle the user load? And what about everything we didn’t think of in advance?
Instead of waiting for these scenarios and then try to figure out how to monitor and solve them, our line of thought should be around how to catch them as soon as they happen.
It’s one of the key elements Cory talked about: “It’s not about a specific technology, this is about people”. Meaning that it doesn’t actually matter if we’re using one tool or another, we have to build an engineering culture that cares about these issues..
How can we do that? Cory introduced a negative feedback loop, in which an output is compared to the desired value and changed accordingly:
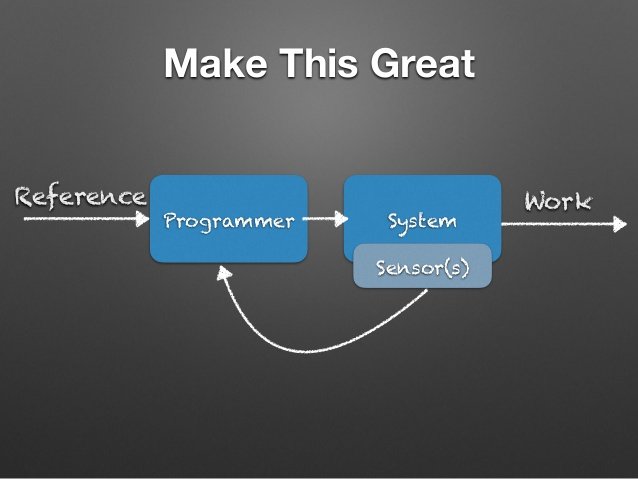
In Cory’s words: “If the internal state goes bad, the work goes bad. We need to add sensors”. The main goal is to make this diagram work well, by providing the tools needed to send the right signals back to the engineers, and show them what needs to change. This leads us to the hardest part of this process:
Getting the team on board
As we all know, it’s hard to break a habit or change the way we do certain things, and it’s even harder when you’re trying to convince others to do it as well. The process of implementing a new culture is a challenging task, and it should be handled with care.
Cory’s approach is thinking about this as a culture change, expanding our line of thought and offering a way to help others being be great at their jobs. In order to do that, we need to lay the foundation and understand what we’re trying to accomplish.
It’ll be easier to break it down to 3 main questions:
- What am I trying to improve?
- How can I measure it?
- Is this the best solution for what I’m trying to solve?
Now it’s time to get the team involved. We need to go to our colleagues to get some feedback and ask them how they think we can improve the fields we choose to focus on.
Cory’s advice is that if we’re planning on making a change, we should find the power users in our organization and ask them to participate in the thinking process, as well as in the testing process. By empowering them, they will empower other team members, and help build the company’s engineering culture.
The first steps
Now that we know what Observability is and understand how it can help us, it’s time to get down to business. While Cory mentioned that it’s not about the technology, we can’t ignore the variety of tools available for all of our measuring needs.
To get better at Observability, we’ve collected some of the most popular solutions for different issues that you can proactively track:
Logging
One of the key sources of data for production environments are log files who often grow by GBs per day. This means a whole lot of information that we’ll have to go through each time we want to know what happened in our system.
On the bright side, there are many choices available that will help you gain better Observability and see beyond the pale lines of bare logfiles. If you’re just getting started with log management tool, here are the top 7 tools you should know.
If you’re already familiar with these tools and you want to find the right one for you, you can check out our comparisons of the big names dominating this field. We checked out Splunk vs ELK (and hosted options for ELK), and did a bigger log management face off between Splunk, Logstash and Sumo Logic.
Performance Monitoring
Application Performance Management tools (APM) are helping you time how long it takes to execute different areas in the code and complete transactions.
The two main tools that appear on most enterprise APM would probably be AppDynamics and Dynatrace, while New Relic is seen as a more modern choice for developers.
Debugging in Production
When something bad happens in development, the debugger of the IDE is right there to help you understand what went wrong. Fast forward a few steps, when the code is out there in production – the training wheels are off and you’re left alone with a stack trace, and maybe a few more log events as hints if you’re lucky.
With Takipi, you’re able to automatically reproduce each production error and display the code and variables that caused it – even across multiple servers.
Final thoughts
No doubt better monitoring and Observability are important for understanding what’s going on in production and make it work better for our users. But… change isn’t easy.
The hardest step is getting started, and if you aim to establish a culture of Observability in your company it’s better to start with small steps first. Think what’s the value you’re looking for, measure effectiveness and seek feedback.
Do you have any other tips for better Observability? We’d love to hear about them in the comments below.
| Reference: | System Observability: How to Make Your Production Environment Great Again from our JCG partner Henn Idan at the Takipi blog. |
