What are some of the most useful methods to monitor Java applications in Docker containers?
Running applications in containers is an increasingly popular way of maintaining large, distributed stacks that change based on demand. The Java VM heritage makes it an ideal language for container-based infrastructures. With many moving parts and components, monitoring Java applications in containers requires planning and choosing the right tools to monitor the aspects that matter to you.
There are five components of a monitoring stack worth considering. I’ll briefly cover the first two and point you in the direction of useful resources that cover them, and then I will focus on the last three in detail.
Table of Contents
1. Making Logs Useful
Of course Java generates it’s own application logs, but often you need extra tools to make them more readable and usable. There are big, well-established players like Splunk and the Elastic stack, or smaller (but no less capable) tools like Sumo Logic, Graylog, Loggly, PaperTrail, Logentries and Stackify.
The main factor to consider is how well the log management tool you’re using or considering integrates with Docker. For most, integrating with Docker is becoming just another basic step in the installation without too many hoops to jump through.
A shortcoming that remains is that logs are only as good as the information you choose to include in them, and that’s where other tools can fill in any gaps.
2. Performance Monitoring
Application performance monitoring (APM) tools help with identifying performance bottlenecks in code or infrastructure, helping you know what needs improvement. This is a busy space, with well-known tools such as AppDynamics, Dynatrace and New Relic and a handful of open source options.
As with log management tools, the main issue to consider from the Docker angle, is how well their integrations work. Docker containers have matured enough to become a step in the APM installation process.
3. Error Tracking
Applications will generate errors, but with today’s complex interwoven and distributed code bases, it’s often hard to directly pinpoint a source. Error tracking tools aim to help you solve this by monitoring applications in production.
One tool that stands out, with a complete focus on JVM-based applications, is OverOps, a highly optimized native agent that adds a maximum of 1% to CPU overhead with little network or storage overhead. It’s perfect for container-based JVM applications where leanness and performance are key.
You can see real-time exceptions and logged errors or warnings and filter to specific errors such as those related to the JVM, database or network.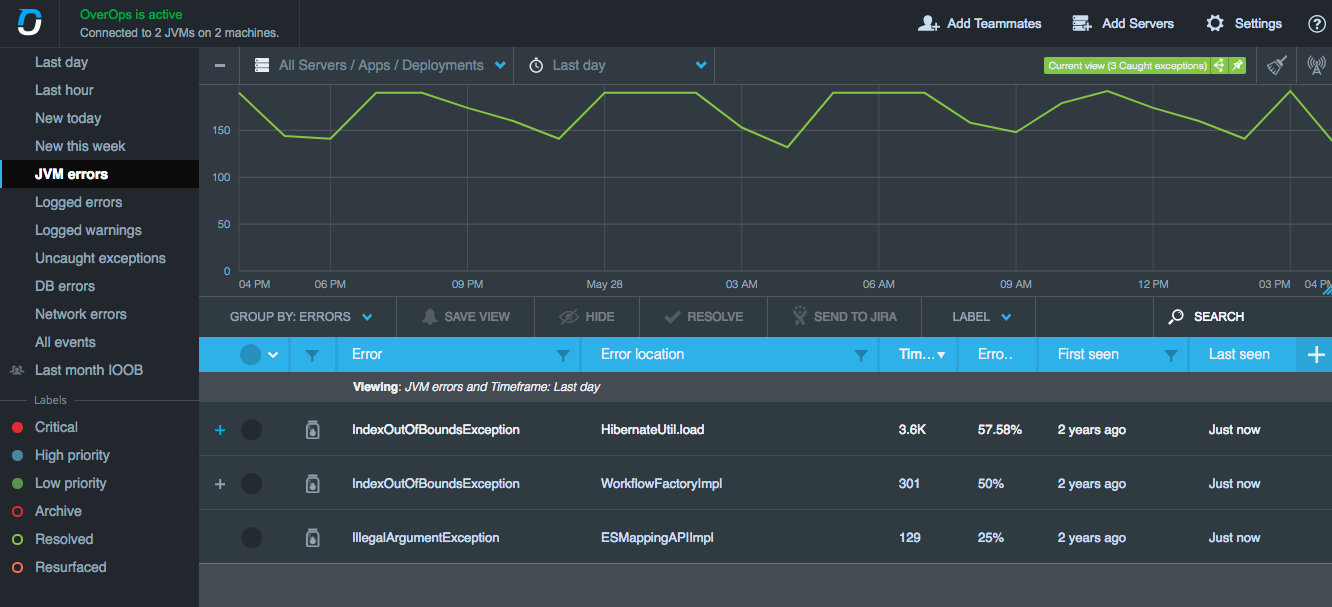
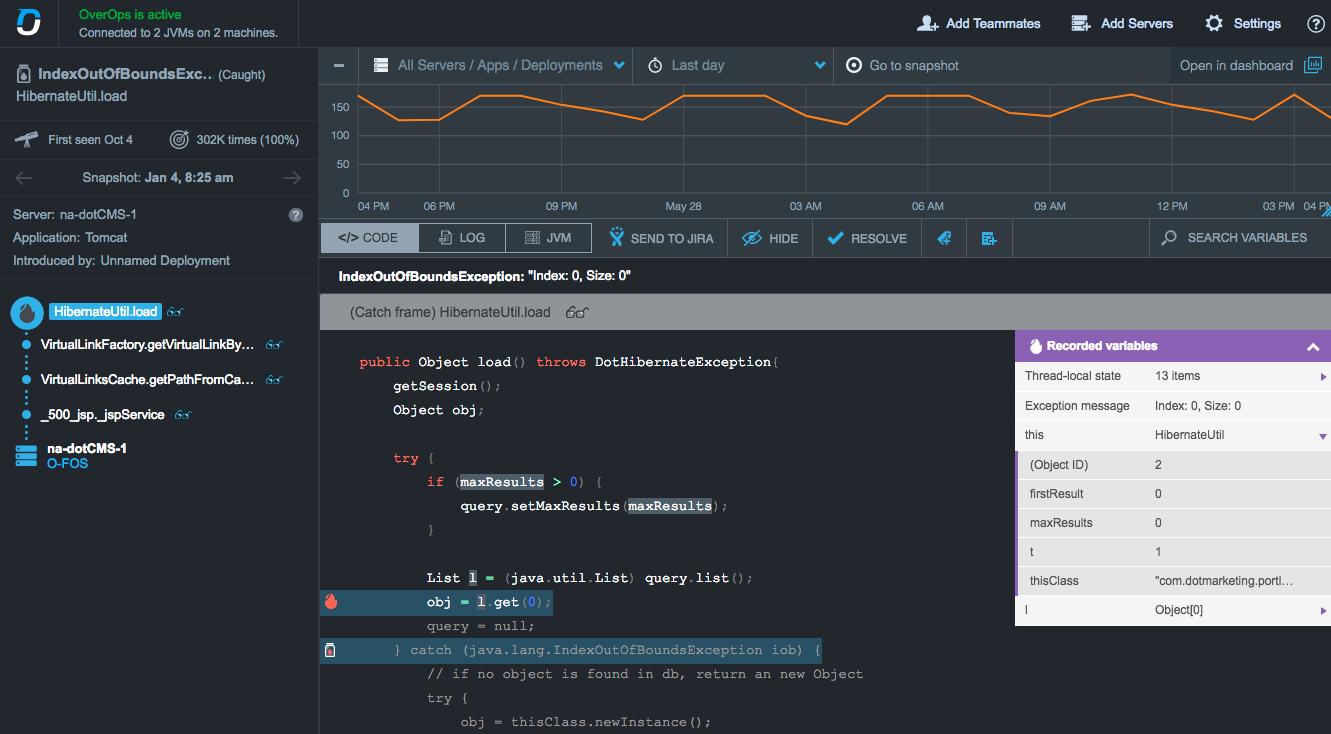
Once you’ve found the error you want more details on, you can click into it to find out more, including the line of code that triggered it and the exact variable state at the moment of error across the entire call stack.
OverOps has a specific release designed for containers that you can access and use by adding less than a handful of lines to your Dockerfile with releases for Debian/Ubuntu, CentOS/RedHat, and Alpine Linux.
Containers are typically used in constantly changing application environments, with new code introduced on a regular basis, and OverOps helps you quickly identify errors that are new and drill down into the cause. If you are running your application across a cluster of containers, then the setup process is the same and OverOps will detect the same application to aggregate errors from all instances.
4. Container Metrics
Containers are essentially small, self-contained machines, so similar metrics such as CPU and memory usage are still important to tracking down high level application issues. I will mostly cover Docker-based containers here but will mention if a tool supports other options.
Docker Stats
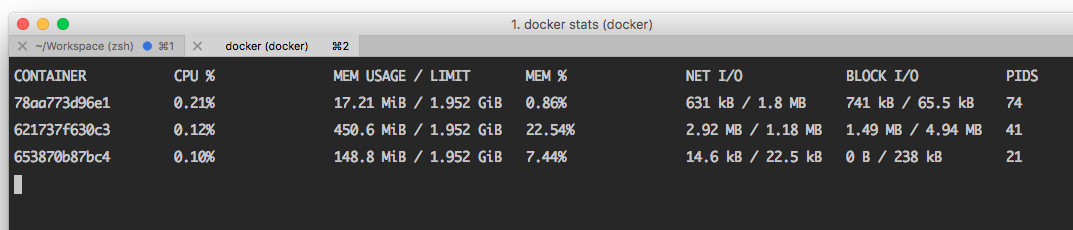
I will start with Docker’s own API as many of the other tools available and featured build upon the data it provides and add information from other sources. A simple docker stats command will provide you with an overview of containers and their CPU, memory and I/O usage. Other API endpoints will provide details on tasks, logs, events, and more.
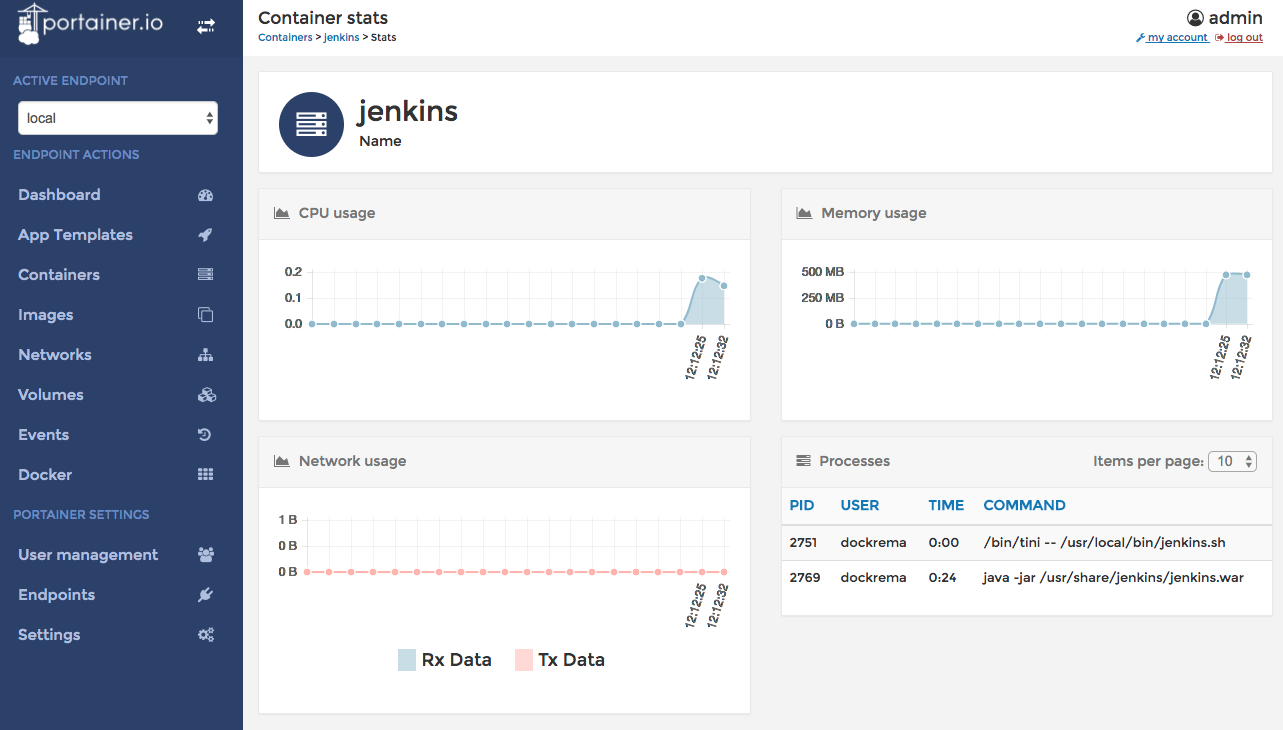
Portainer
I encountered the Portainer project at a Docker meetup. It’s a well-realized open source Docker management tool that runs in a container itself and sits behind two innocuous links on each container in your application. It provides well-visualized stats and logs details that may be sufficient for your purposes, and the simplicity and low cost of the project is an attractive factor.
Datadog
Datadog focuses on providing detailed metrics of your entire stack. You can arrange all monitored points into customized dashboards to suit your needs and trigger appropriate notifications depending on the issue and severity. When it flags a potential problem there are communication tools built into Datadog to annotate, discuss it and highlight any follow-up that occurred so that you can hopefully avoid it in the future.
For any aspect of your application that you want to monitor that Datadog lacks an official integration for, you can use their full-access API to capture events and feed them into the same dashboards, alerts and collaboration tools.
For JVM applications running in containers, there are several components reflecting the granular way that Datadog functions. You can add an agent for your host operating system, and then the Docker integration that monitors the performance of individual containers and the performance of the containers correlated with the applications they are running. Installation can be complicated depending on your host/Docker setup, as Datadog wants to monitor the performance of the host as well as the container engine and the application layer, again, giving you a fuller picture.
For example, the image below shows Docker running on my Mac with the layers important to Datadog:
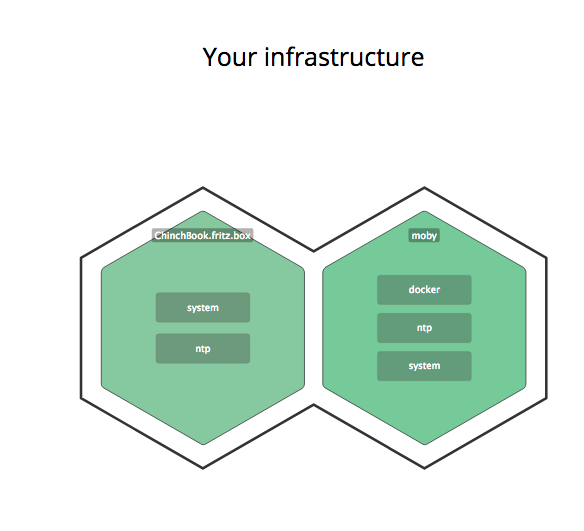
To monitor the containers and what’s happening inside them, you run the agent inside each container by adding it to your Dockerfile. To monitor the application, use the Java/JMX integration to monitor whichever aspects are important to you.
If these options aren’t enough for you, then Datadog also lets you send metrics via statsD, and they provide a Java library to help you do so.
SignalFX
Whilst it’s possible to configure any of the services mentioned in this article to work well with microservices, SignalFX makes it part of their main focus. The SignalFX service is based on the open source collectd stats daemon, which offers an established ecosystem and community, meaning that you can add collectd plugins to collect data not available in the default SignalFX offering.
For Docker containers, SignalFX will monitor metrics using the stats API to report on CPU, memory, and disk. A dashboard will first provide you with an aggregate view of metrics across all containers and let you drill down into each docker host and container to see where performance issues lie.
One of the features I like about SignalFX is that installing agents happens at a system level and is thus simpler. For example, to install the Java plugin on Ubuntu and Debian (other distributions are a two step process) all you need to do is install SignalFx’s main collectd agent and it includes Java support alongside other agents, by using JMX technology. You can add custom collection points in your Java applications with libraries from SignalFX.
Wavefront
Wavefront takes a different approach to other options in this article, instead of offering a particular logging solution, it instead aggregates time-series data from other logging services including collectd, statsd and JMX.
For Docker containers, Wavefront has cAdvisor, a lightweight agent that runs as a container and monitors low-level resource utilization such as CPU, memory and disk access. If you are using container services such as ECS, Kubernetes, Mesos or Docker Swarm, then Wavefront provides packaged integration options that offer aggregated metrics across clusters by default.
5. Orchestration
As your container infrastructure becomes more complex, you will need orchestration tools to construct your applications and manage them as demand changes and maintain consistency as containers and machines experience problems. There are a handful of major players in this space, and all offer a solution for metrics monitoring as it’s an essential component.
Prometheus
A Cloud Native Computing Foundation project, Prometheus is a systems and service monitoring system that can trigger alerts if it observes a condition to be true. It’s a popular open source tool, so you will need to spend time configuring it to suit your needs. If you use Mesos or Kubernetes to manage and schedule your containers, then Prometheus is a good option and a preferred one for many users of these tools.
Kubernetes Dashboard
Covering the options for monitoring a Kubernetes cluster is another article in itself, but it’s worth mentioning the default Kubernetes Dashboard option, in case you manage your containers with Kubernetes anyway. It provides an overview of resource usage for each ‘pod’ and a logs and jobs viewer.
Mesos Metrics
If you are using Mesos to manage your containers, then again it has its own inbuilt options for monitoring containers it runs. It’s not as visual as the Kubernetes dashboard, but offers a series of endpoints that you need to implement yourself or use one of the many tools that visualize the data for you.
Final Thoughts
Containers are just small, self-contained machines and, for the most part, offer the same level of monitoring as a ‘normal’ physical machine or virtual machine. The main difference is the number of containers that are likely to be a part of your application and their ephemeral nature, containers are not designed for long-running services. When assembling your monitoring stack, make sure you pick solutions that make it easy for the number of instances to change and that the metrics provide a consistent overview of your application over time.
| Reference: | Docker Monitoring: 5 Methods for Monitoring Java Applications in Docker from our JCG partner Chris Ward at the OverOps blog. |
