In this part we look at putting a micro service together as a collection of services, and consider how we can evaluate the performance of these services. We introduce JLBH (Java Latency Benchmark Harness) to test these services.
Building a Service Wrapper.
For more complex services, we use an EventLoop in Chronicle Threads to manage multiple concurrent tasks. In this example we have only one task, so it is simpler to have a custom class to support it.
This class is available at ServiceWrapper.
public class ServiceWrapper<I extends ServiceHandler> implements Runnable, Closeable {
    private final ChronicleQueue inputQueue, outputQueue;
    private final MethodReader serviceIn;
    private final Object serviceOut;
    private final Thread thread;
    private final Pauser pauser = new LongPauser(1, 100, 500, 10_000, TimeUnit.MICROSECONDS); (1)

    private volatile boolean closed = false;

    public ServiceWrapper(String inputPath, String outputPath, I serviceImpl) {
        Class outClass = ObjectUtils.getTypeFor(serviceImpl.getClass(), ServiceHandler.class); (2)

        outputQueue = SingleChronicleQueueBuilder.binary(outputPath).build(); (3)
        serviceOut = outputQueue.createAppender().methodWriter(outClass);
        serviceImpl.init(serviceOut); (4)

        inputQueue = SingleChronicleQueueBuilder.binary(inputPath).build();
        serviceIn = inputQueue.createTailer().methodReader(serviceImpl); (5)

        thread = new Thread(this, new File(inputPath).getName() + " to " + new File(outputPath).getName());
        thread.setDaemon(true);
        thread.start(); (6)
    }

    @Override
    public void run() {
        AffinityLock lock = AffinityLock.acquireLock(); (7)
        try {
            while (!closed) {
                if (serviceIn.readOne()) { (8)
                    pauser.reset(); (9)
                } else {
                    pauser.pause(); (9)
                }
            }
        } finally {
            lock.release();
        }
    }

    @Override
    public void close() {
        closed = true;
    }

    @Override
    public boolean isClosed() {
        return closed;
    }
}
This Pauser controls the back off strategy in which no events are coming through. It will retry once, yield 100 times, then start sleeping from half a millisecond to 10 milliseconds.
Obtain the type of the parameter for the ServiceHandler and in this case it is a Service. Create an output queue. And pass it to the implementation so it can write to it’s output queue. Create a reader for the input queue. Start a thread which will read from the serviceIn reader. Bind this thread to an isolated CPU where possible. Read and process one message. reset() the pauser if a message came, otherwise call it for a possible pause.
Timing our service.
A simple service can time itself. This could be implmented as a wrapper, however for a more complex service you can use the builing in history recording and only examine the result at the end.
class ServiceImpl implements Service, ServiceHandler<Service> {
    private final NanoSampler nanoSampler;
    private final NanoSampler endToEnd;
    private Service output;

    public ServiceImpl(NanoSampler nanoSampler) {
        this(nanoSampler, t -> {
        });
    }

    public ServiceImpl(NanoSampler nanoSampler, NanoSampler endToEnd) {
        this.nanoSampler = nanoSampler;
        this.endToEnd = endToEnd;
    }

    @Override
    public void init(Service output) {
        this.output = output;
    }

    @Override
    public void simpleCall(SimpleData data) {
        data.number *= 10; // do something.

        long time = System.nanoTime();
        nanoSampler.sampleNanos(time - data.ts); (1)
        data.ts = time; // the start time for the next stage.

        output.simpleCall(data); // pass the data to the next stage.

        endToEnd.sampleNanos(System.nanoTime() - data.ts0); (2)
    }
}
Take the timing since the last stage Take the timing from the start
Using JLBH Java Latency Benchamrk Harness
This tool is based on JMH (Java Microbenchmark Harness) where the main difference is support for testing asynchronous processes where you want to examine the timings at different stages, possibly in different theads.
JLBHOptions jlbhOptions = new JLBHOptions()
        .warmUpIterations(50_000)
        .iterations(MESSAGE_COUNT)
        .throughput(THROUGHPUT) (1)
        .runs(6)
        .recordOSJitter(true) (2)
        .pauseAfterWarmupMS(500)
        .accountForCoordinatedOmmission(ACCOUNT_FOR_COORDINATED_OMMISSION) (3)
        .jlbhTask(new MultiThreadedMainTask());
new JLBH(jlbhOptions).start();
Benchmark for a target throughput. Add a thread to record the OS jitter over the interval. Turn on correction for coordinated ommission.
To set up the test, we create three services. This models a gateway which accepting data from external systems such as aweb service or FIX Engine. This is picked up by one service, which passes a message to a second service and finally this is written to a gateway service which can pass the data to an external system.
UUID uuid = UUID.randomUUID();
String queueIn = OS.TMP + "/MultiThreadedMain/" + uuid + "/pathIn";
String queue2 = OS.TMP + "/MultiThreadedMain/" + uuid + "/stage2";
String queue3 = OS.TMP + "/MultiThreadedMain/" + uuid + "/stage3";
String queueOut = OS.TMP + "/MultiThreadedMain/" + uuid + "/pathOut";

@Override
public void init(JLBH jlbh) {
    serviceIn = SingleChronicleQueueBuilder.binary(queueIn).build().createAppender().methodWriter(Service.class); (1)
    service2 = new ServiceWrapper<>(queueIn, queue2, new ServiceImpl(jlbh.addProbe("Service 2"))); (2)
    service3 = new ServiceWrapper<>(queue2, queue3, new ServiceImpl(jlbh.addProbe("Service 3"))); (3)
    serviceOut = new ServiceWrapper<>(queue3, queueOut, new ServiceImpl(jlbh.addProbe("Service Out"), jlbh)); (4) (5)
}
Just a writer Reads that message and writes to the third service Reads from the second service and writes to the outbound service. The output gateway reads from the third service and writes its result to a log/queue. The last service also sets the end to end timing.
Every message is being persisted at each stage and is available on restart. As there is one output message for every input pmessage you could restart by winding to the same index as the output. A more robust strategy would be to record te history in the output as covered in the previous post.
Running the tests
There are two important considerations when running performance tests
- what is the percentile that you care about?
- Typical,
- 99%tile (worst 1 in 100)
- 99.9%tile (worst 1 in 1000)
- 99.99%tile ( worst 1 in 10000)
- worst, ever
- what is the throughput you are looking to test.
It is important that you control the throughput for the test so you can see how your system behaves at different sustained throuhgputs. You system will run as fast as possible for short periods, however buffers and caches quickly fill up and cannot support this rate without getting large delays.
Looking at the typical performance.
In this test on a E5-2650 v2, the throughput it can achieve for this test is 600,000 messages/second. However, it wouldn’t be practical to do this for any long period of time as the system quickly gets to the point where it is behind with increasing delay the long this goes on. This is because there is no head room to deal with any jitter or delay in the system. Every delay accumulates as the system struggle to keeps up. So what is a more practical throughput for this mock system.
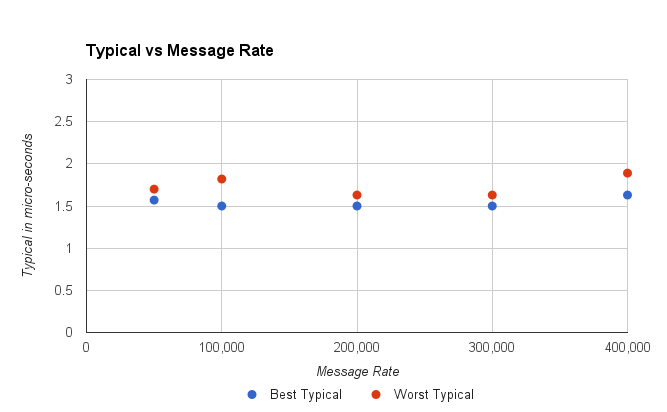
Figure 1. Worst Typical was the highest of 15, 2 minute runs.
This looks fine, for all the throughputs up to 400,000 messages per second, the typical performance is consistent. However, for a throughput of 450,000 messages per second, the service could get a delay which it would struggle to recover from and the typical latency would jump to 20 – 40 seconds.
In short, by looking at the typical performance our estimate of throughput we might prefer has dropped from 600K/s to 400K/s
Looking at the nines.
By looking at the higher percentiles (worst results) we can for a view as to what delays would be acceptable and how often. Typically, I would consider a 99%tile which 4x the typical and a 99.9%tile which 10x the typical latency. This is rule of thumb I use, however the results vary between systems.
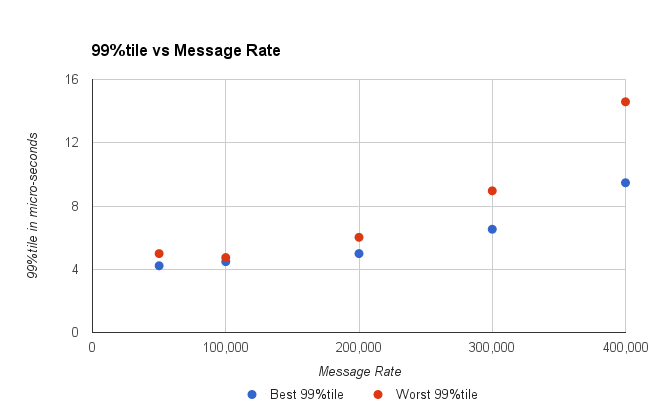
Figure 2. The worst 1 in 100 gets higher as the throughput increases.
You might take the view that the 99%tile should be under 10 micro-seconds, and conclude the system can handle 300K messages/second.
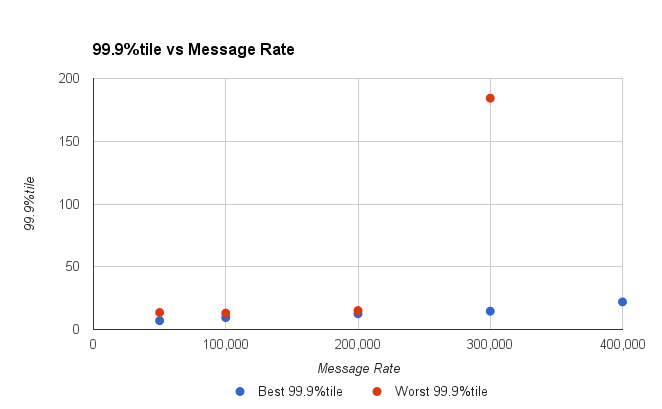
Figure 3. The worst 1 in 1000 gets higher as the throughput increases.
Looking at the 99.9%tile you can see that above 200K msg/second our latencies shoot up. Up to 200 K/s our system has very stable latencies.
Can we sustain 200 K msg/second?
The problem arises that we will not want to sustain this rate for long. Bursts are fine, but do this all day long and you generate a lot of data. If all the messages are recorded and they total say 1/2 KB for each inbound message, this will be producing 200 MB/s, and while an SSD can do this easily it will run out of space pretty fast. 200 MB/s is 9 TB per day. Nine TB of usable high performance SSD is still pretty pricy.
Lets say we wanted to record less than 2 TB per day. A few high capacity HDD could persist all your messages for a week. This is 23 MB/s sustained. At 512 bytes per message (total) you are looking at a more modest 50K message/second sustained, but with burst of up to 200K/s – 600K/s depending on your requirements.
In summary
We have a test harness for multi-threaded asynchronous processes and it can help you explore how your service might behave under various throughput loads. While your system might be able to support high throughputs for very short periods of time, how sustained throughput impacts the latency of your system.
| Reference: | Microservices in the Chronicle World – Part 5 from our JCG partner Peter Lawrey at the Vanilla Java blog. |
