Why can’t production logs help you find the real root cause of your errors?
Asking if you’re using log files to monitor your application is almost like asking… do you drink water. We all use logs, but HOW we use them is a whole different question.
In the following post we’ll take a deeper look into logs and see how they are used and what’s written to them. Let’s go.
Big shout out to Aviv Danziger from our R&D team for his huge help pulling and crunching the data for us.
The Groundwork
Our quest for answers requires a large amount of data, and that’s why we turned to Google BigQuery. A few months ago we used it for the first time to see how GitHub’s top Java projects use logs.
For our current post, we took the top 400,000 Java repositories on GitHub, ranked by number of stars they were given in 2016. Out of those repositories we filtered out Android, sample projects and simple testers, which left us with 15,797 repositories.
Then, we extracted the repositories that had over 100 logging statements, which left us with 1,463 repos to work on. Now, it’s time for the fun part of finding the answers for all those questions that kept us awake at night.
TL;DR: Main Takeaways
If you’re not into pie, column or bar charts and want to skip the main course and head straight for the dessert, here are the 5 key points we learned about logging and how it’s really done:
1. Logs don’t really have as much information as we think, even though they can add up to hundreds of GBs per day. Over 50% of statements have no information about the variable state of the application
2. In production, 64% of overall logging statements are deactivated
3. The logging statements that do reach production have 35% less variables than the average development level logging statement
4. “This should never happen” always happens
5. There’s a better way to troubleshoot errors in production
Now let’s back up these points with some data.
1. How Many Logging Statements Actually Contain Variables?
The first thing we wanted to check is how many variables are sent out in each statement. We chose to slice the data on a scale from 0 variables up to 5 and above, in each repository. We then took the total count, and got a sense of the average breakdown over all of the projects in the research.
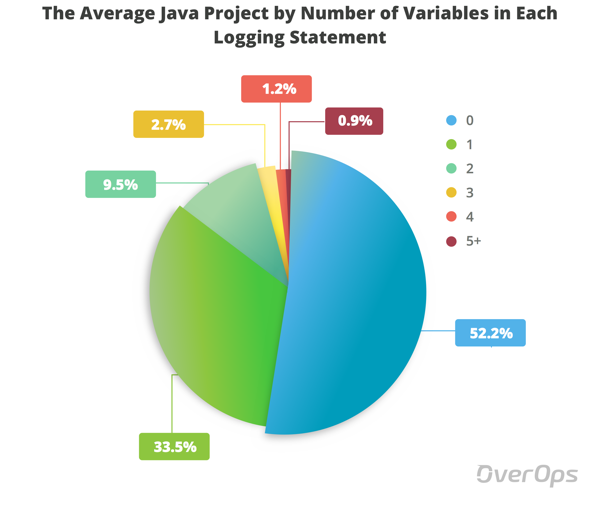
As you can see, the average Java project doesn’t log any variables in over 50% of its logging statements. We can also see that only 0.95% of logging statements send out 5 variables or more.
This means that there’s limited information about the application that is captured by the log, and finding out what actually happened might feel like searching for a needle in a log file.
2. How Many Logging Statements Are Activated in Production?
Development and production environments are different for many reasons, one of them is their relation to logging. In development, all log levels are activated. However, in production only ERROR and WARN are activated. Let’s see how this breakdown looks like.
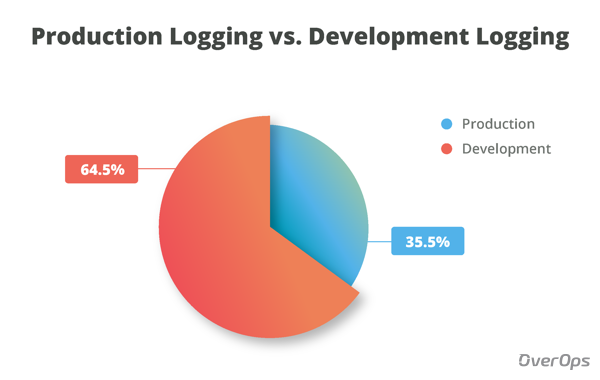
The chart shows that the average Java application has 35.5% unique logging statements that have the potential to be activated in production (ERROR, WARN), and 64.5% statements that are only activated in development (TRACE, INFO, DEBUG).
Most information is lost. Ouch.
3. What’s the Average Number of Variables per Each Log Level?
So, not only do developers skimp on variables in their statements, the average Java application doesn’t send out that much statements to production logs in the first place.
Now, we’ve decided to look at each log level individually and calculate the average number of variables in the corresponding statements.
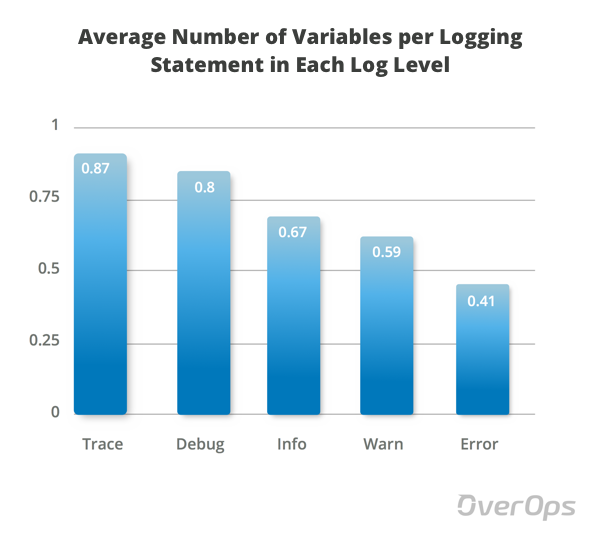
The average shows that TRACE, DEBUG and INFO statements contain more variables than WARN and ERROR. “More” is a polite word, considering the average number of variables in the first three is 0.78, and 0.5 in the last 2.
That means that production logging statements hold 35% less variables than development logging statements. In addition, as we’ve seen earlier, their overall number is also much lower.
If you’re searching the log for clues as to what happened to your application, but come up blank – this is why it happens. Not to worry, there’s a better way.
OverOps lets you see the variables behind any exception, logged error or warning, without relying on the information that was actually logged. You’ll be able to see the complete source code and variable state across the entire call stack of the event. Even if it wasn’t printed to the log file. OverOps also shows you the 250 DEBUG, TRACE and INFO level statements that were logged prior to the error, in production, even if they’re turned off and never reach the log file.
We’d be happy to show you how it works, click here to schedule a demo.
4. This Should Never Happen
Since we already have information about all of those logging statements, we’ve decided to have a little fun. We found 58 mentions to “This should never happen”.
All we can say is that if it should never happen, at least have the decency to print out a variable or 2, so you’ll be able to see why it happened anyway ��
How we did it?
As we mentioned, to get this data we first had to filter out irrelevant Java repositories and focus on those which had over 100 logging statements, which left us with 1,463 repos that made the cut.
Then, we added some regex magic and pulled out all of the log lines:
SELECT *
  FROM [java-log-levels-usage:java_log_level_usage.top_repos_java_contents_lines_no_android_no_arduino]
 WHERE REGEXP_MATCH(line, r'.*((LOGGER|Logger|logger|LOG|Log|log)[.](trace|info|debug|warn|warning|error|fatal|severe|config|fine|finer|finest)).*')
    OR REGEXP_MATCH(line, r'.*((Level|Priority)[.](TRACE|TRACE_INT|X_TRACE_INT|INFO|INFO_INT|DEBUG|DEBUG_INT|WARN|WARN_INT|WARNING|WARNING_INT|ERROR|ERROR_INT)).*')
    OR REGEXP_MATCH(line, r'.*((Level|Priority)[.](FATAL|FATAL_INT|SEVERE|SEVERE_INT|CONFIG|CONFIG_INT|FINE|FINE_INT|FINER|FINER_INT|FINEST|FINEST_INT|ALL|OFF)).*')
Now that we had the data, we started slicing it up. First we filtered out the number of variables per log level:
SELECT sample_repo_name
      ,log_level
      ,CASE WHEN parametersCount + concatenationCount = 0  THEN "0"
            WHEN parametersCount + concatenationCount = 1  THEN "1"
            WHEN parametersCount + concatenationCount = 2  THEN "2"
            WHEN parametersCount + concatenationCount = 3  THEN "3"
            WHEN parametersCount + concatenationCount = 4  THEN "4"
            WHEN parametersCount + concatenationCount >= 5 THEN "5+"
        END total_params_tier
      ,SUM(parametersCount + concatenationCount) total_params
      ,SUM(CASE WHEN parametersCount > 0 THEN 1 ELSE 0 END) has_parameters
      ,SUM(CASE WHEN concatenationCount > 0 THEN 1 ELSE 0 END) has_concatenation
      ,SUM(CASE WHEN parametersCount = 0 AND concatenationCount = 0 THEN 1 ELSE 0 END) has_none
      ,SUM(CASE WHEN parametersCount > 0 AND concatenationCount > 0 THEN 1 ELSE 0 END) has_both
      ,COUNT(1) logging_statements
      ,SUM(parametersCount) parameters_count
      ,SUM(concatenationCount) concatenation_count
      ,SUM(CASE WHEN isComment = true THEN 1 ELSE 0 END) comment_count
      ,SUM(CASE WHEN shouldNeverHappen = true THEN 1 ELSE 0 END) should_never_happen_count
  FROM [java-log-levels-usage:java_log_level_usage.top_repos_java_log_lines_no_android_no_arduino_attributes]
 GROUP BY sample_repo_name
         ,log_level
         ,total_params_tier
Then calculated the average use of each tier. That’s how we got the average percent of total repositories statements.
SELECT total_params_tier
      ,AVG(logging_statements / total_repo_logging_statements) percent_out_of_total_repo_statements
      ,SUM(total_params) total_params
      ,SUM(logging_statements) logging_statements
      ,SUM(has_parameters) has_parameters
      ,SUM(has_concatenation) has_concatenation
      ,SUM(has_none) has_none
      ,SUM(has_both) has_both
      ,SUM(parameters_count) parameters_count
      ,SUM(concatenation_count) concatenation_count
      ,SUM(comment_count) comment_count
      ,SUM(should_never_happen_count) should_never_happen_count
  FROM (SELECT sample_repo_name
              ,total_params_tier
              ,SUM(total_params) total_params
              ,SUM(logging_statements) logging_statements
              ,SUM(logging_statements) OVER (PARTITION BY sample_repo_name) total_repo_logging_statements
              ,SUM(has_parameters) has_parameters
              ,SUM(has_concatenation) has_concatenation
              ,SUM(has_none) has_none
              ,SUM(has_both) has_both
              ,SUM(parameters_count) parameters_count
              ,SUM(concatenation_count) concatenation_count
              ,SUM(comment_count) comment_count
              ,SUM(should_never_happen_count) should_never_happen_count
          FROM [java-log-levels-usage:java_log_level_usage.top_repos_java_log_lines_no_android_no_arduino_attributes_counters_with_params_count]
         GROUP BY sample_repo_name
                 ,total_params_tier)
 WHERE total_repo_logging_statements >= 100
 GROUP BY total_params_tier
 ORDER BY 1,2
You can check out the calculations in our raw data file.
Final Thoughts
We all use log files, but it seems that most of us take them for granted. With the numerous log management tools out there we forget to take control of our own code – and make it meaningful for us to understand, debug and fix.
| Reference: | GitHub Research: Over 50% of Java Logging Statements Are Written Wrong from our JCG partner Henn Idan at the OverOps blog. |
