Real-time Smart City Traffic Monitoring Using Microservices-based Streaming Architecture (Part 2)
Modern Open Source Complex Event Processing For IoT
This series of blog posts details my findings as I bring to production a fully modern take on Complex Event Processing, or CEP for short. In many applications, ranging from financials to retail and IoT applications, there is tremendous value in automating tasks that require to take action in real time. Putting aside the IT system and frameworks that would support this capability, this is clearly a useful capability.
In the first post of the series, I explain how CEP has evolved to meet this requirement and how the requirements for CEP can be met in a modern big data context. In short, I present an approach based on the best practices of modern architecture, microservices, and Kafka-style stream messaging, with an up-to-date open source business rule engine.
In this second part, I’ll get more concrete and work through a working example using the system I propose. Let’s get started.
Smart City Traffic Monitoring
We made a working demo for which the code will be released on the MapR GitHub. It is made to work on either the MapR Sandbox or using a real MapR cluster. Our demo is planned to be released, so please stay tuned and check www.mapr.com for an annoucement.
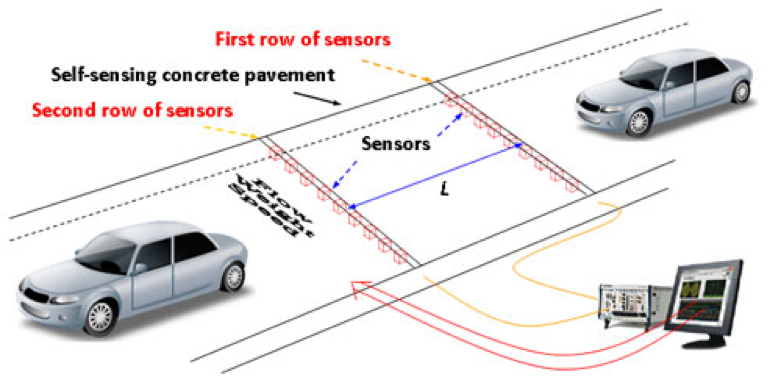
For this example, we’ll use a very simple “smart city” use case for traffic monitoring. In this case, we’ll model a single sensor that can measure the speed of cars that pass on it. Using such sensor data, it would be fairly easy to detect traffic jams in real time, and thus notify the police to take action much more quickly than they otherwise could.
Some other types of use cases are easy to envision. We can add data from a public, real-time weather feed and connect to information panels along the roads and show an advisory to drivers without any human intervention. By combining road condition sensors with the weather data, we can provide advisory feedback to drivers about road conditions and warn the public very quickly. Furthermore, by adding historical accident data and using predictive analytics, we can imagine road safety measures that can be deployed in real time to areas with a higher probability of accidents.
To be honest, I’m only scratching the surface of what this kind of smart road could do to make a commuter’s life both easier and safer while saving money for the city. But how would we build a prototype of such a system without it being hugely complicated and expensive?
How to Build a Rule-Engine Based CEP System
So we now have a proper, concrete target in mind. It turns out that if we decide to base our system around reading our data from a Kafka-style stream (i.e., persistent, scalable, and high performance), then we will naturally end up with a pretty cool, modern CEP microservice.
The important point here is not to show how to build a super complicated enterprise architecture, but rather that by making some simple technology choices and building our demo in a reasonable way, we naturally end up with this elegant, modern, and simple architecture.
For simplicity’s sake, I have decided to implement my prototype on a MapR Sandbox (get it free here). This is because it will include the stream messaging system, MapR Streams, which I can use through the Kafka 0.9 API with very little configuration and know it will work the same on a production MapR 5.1+ cluster.
Finally, it should be noted that an Apache Kafka cluster could be used as well with the same design and code, just with some additional work to get it up and running.
High-Level Architecture View
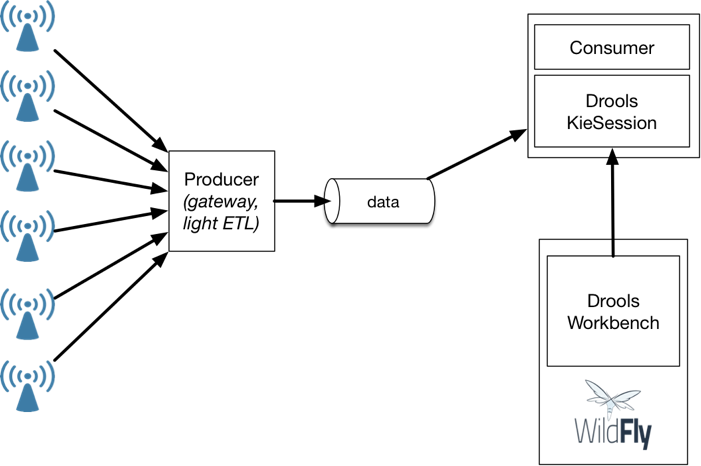
As shown in the diagram above, the flow is to have sensor data get aggregated to a producer gateway, which will forward the data to the stream with topic named “data.” The data will be in JSON format so it is easy to manipulate, human readable, and easily sent to Elasticsearch as-is for monitoring with a Kibana dashboard.
The consumer side will have two tasks: to read the data from the stream and host an instance of a KieSession where the rule engine can apply rules on the facts as they are added to it.
Rules are edited in the Workbench GUI, a Java webapp which can be run on a Java application server such as WildFly or Tomcat.
Rules are fetched from the workbench by the consumer application using the appropriate methods provided by the Drools framework, which are entirely based on Maven Repository.
We can now look at the proposed system in more detail in the following sections.
List of Technologies Used
The technology we’re going to use is as follows:
- MapR Sandbox 5.2
- The Java programming language (any JVM language is fine)
- The Jackson 2 library to convert to and from JSON
- MapR Streams or Apache Kafka stream messaging system
- Wildfly 10 application server to host the Workbench
- JBoss Drools as our choice of OSS business rule engine
- Log Synth to generate some synthetic data for our prototype
- Streamsets 1.6 to connect MapR Streams and Elasticsearch
- Elasticsearch 2.4 and Kibana 4 for monitoring
Traffic Monitoring Prototype Architecture
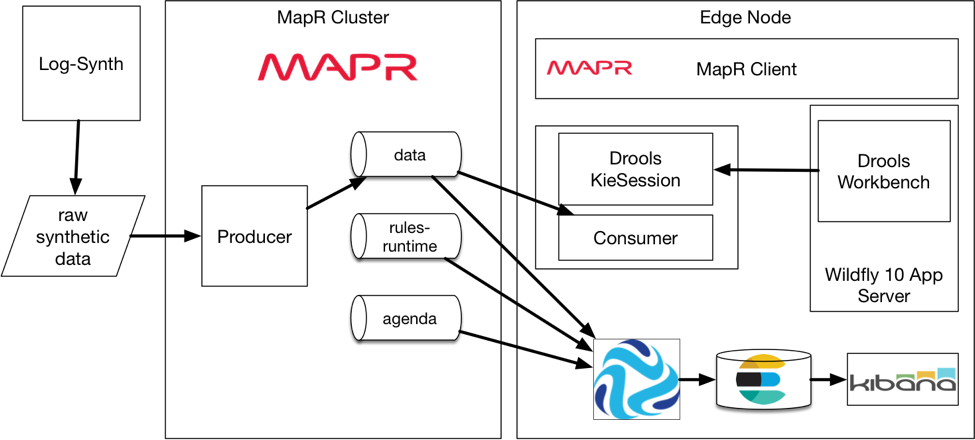
As I built this demo to run on the MapR Sandbox, I’m using instructions for CentOS 6.X, an open source version of RHEL 6.X. Instructions for CentOS 7 are almost identical, and finding similar instructions for Ubuntu would be pretty straightforward and left up to the reader.
To build the core of the traffic monitoring system, we’re going to need two basic parts:
- A program to feed sensor data into MapR Streams/Kafka. This part will be using fake data modeled by a vehicle simulation coded with Log Synth. We’ll use the MapR Kafka-rest proxy implementation (just introduced with MEP 2.0) to add the data with Python.
- A JVM-language application that will read data from the stream and pass it to a KieSession. The minimal code to get this working is surprisingly small.
To edit the rules, we deploy the Workbench on Wildfly 10, which is a fairly straightforward process. Check this blog post for instructions, or read the Drools Documentation. Installing Wildfly is pretty simple; see this blog for great instructions on how to install it as a service on Centos/RHEL (it’s for Wildfly, but the same instructions work for 9 and 10).
We made a single configuration change to Wildfly. We changed the port to 28080 instead of 8080, as it is already used by the sandbox. Wildfly runs in standalone mode, so the configuration file is in WILDFLY_HOME/standalone/configuration/standalone.xml.
For monitoring, we let the streaming architecture work for us. We use the open source Streamset Data collector to easily redirect the sensor data to Elasticsearch so that we can actually monitor the system with a nice dashboard with Kibana. To set up Streamsets with MapR Streams requires some work with version 1.6 (great blog post about it here, or from the official Streamsets documentation).
Finally, installation and setup of Elasticsearch and Kibana is well documented on Centos/RHEL.
For production, all those parts can be readily separated to run on separate servers. They can be run on either cluster nodes or edge nodes. If it’s a MapR cluster, installing the MapR Client and pointing it to the cluster CLDB nodes will be all the configuration needed for full access to the streams. For an Apache Kafka cluster, refer to the official Kafka documentation.
Traffic Monitoring Prototype – How To
Creating the Streams with maprcli
The first task is to create streams and topics for our application. To do this, it’s a best practice to create a volume for streams first. As user mapr, type from the command line:
maprcli volume create -name streams -path /streams

maprcli stream create -path /streams/traffic -produceperm p -consumerperm p

maprcli stream topic create -path /streams/traffic -topic data

maprcli stream topic create -path /streams/traffic -topic agenda

maprcli stream topic create -path /streams/traffic -topic rule-runtime
Note: MapR Streams is more of a superset of Kafka than simply a clone. In addition to being faster, MapR Streams can use all the advantages of the MapR File System, such as volumes (with permissions and quotas and so on) and replication. A cluster is not limited to just defining topics, but can define several streams which each can have several topics. Therefore, instead of a topic name, a MapR Stream has a path:topic notation. Here, our data stream’s full name is “/streams/traffic:data”. You can read more about the advantages of MapR Streams vs. Kafka in this whiteboard walkthrough by Jim Scott.
Generating Fake Data
I used the Log-Synth tool to generate data for this prototype. Log-Synth uses a schema combined with a Sampler class to generate data in a very flexible and simple manner.
My Schema:
[
{"name":"traffic", "class":"cars", "speed": "70 kph", "variance": "10 kph", "arrival": "25/min", "sensors": {"locations":[1, 2, 3, 4, 5, 6, 7,8,9,10], "unit":"km"},
"slowdown":[{"speed":"11 kph", "location":"2.9 km - 5.1 km", "time": "5min - 60min"}]}
]
The command to generate the data is:
synth -count 10K -schema my-schema.json >> output.json
Data is generated one car at a time, and each data point is a reading at a sensor. The data will model a flow of cars driving at 70 km/h, arriving at a rate of 25 cars per minute. A slowdown will happen between km 2.9 and 5.1 where speed will be reduced to 11km/h 5 minutes to 60 minutes after the start of the simulation. This will be the traffic jam we wish to detect using our CEP system.
The generated data is a file where each line is the resulting list of sensor measurements for a single car:
[{"id":"s01-b648b87c-848d131","time":52.565782936267404,"speed":19.62484385513174},{"id":"s02-4ec04b36-2dc4a6c0","time":103.5216023752337,"speed":19.62484385513174},{"id":"s03-e06eb821-cda86389","time":154.4774218142,"speed":19.62484385513174},{"id":"s04-c44b23f0-3f3e0b9e","time":205.43324125316627,"speed":19.62484385513174},{"id":"s05-f57b9004-9f884721","time":256.38906069213255,"speed":19.62484385513174},{"id":"s06-567ebda7-f3d1013b","time":307.3448801310988,"speed":19.62484385513174},{"id":"s07-3dd6ca94-81ca8132","time":358.3006995700651,"speed":19.62484385513174},{"id":"s08-2d1ca66f-65696817","time":409.25651900903136,"speed":19.62484385513174},{"id":"s09-d3eded13-cf6294d6","time":460.21233844799764,"speed":19.62484385513174},{"id":"s0a-1cbe97e8-3fc279c0","time":511.1681578869639,"speed":19.62484385513174}]A reading has a sensor ID, a speed in meters per second, and a time delta from time 0 (the moment the simulation starts) in seconds.
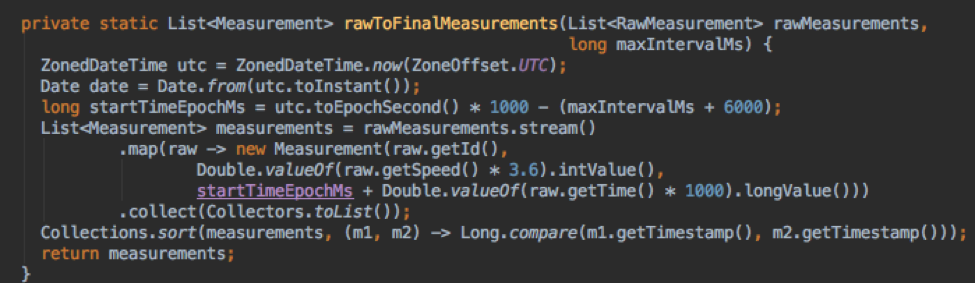
My producer code simply translates the readings into a list of sensor readings ordered by time, and I transform the speed into km/s and the time into a timestamp as milliseconds from epoch.
Sending to the code onto the stream can be done one line at a time using standard producer code. The code in the sample Java producer works just fine.
Another exciting new possibility is to use the brand new Kafka Rest Proxy, which is also available on MapR from MEP 2.0 (MapR Ecosystem Pack). This means sensors can connect directly to Kafka from any language since HTTP-based REST API is a global standard.
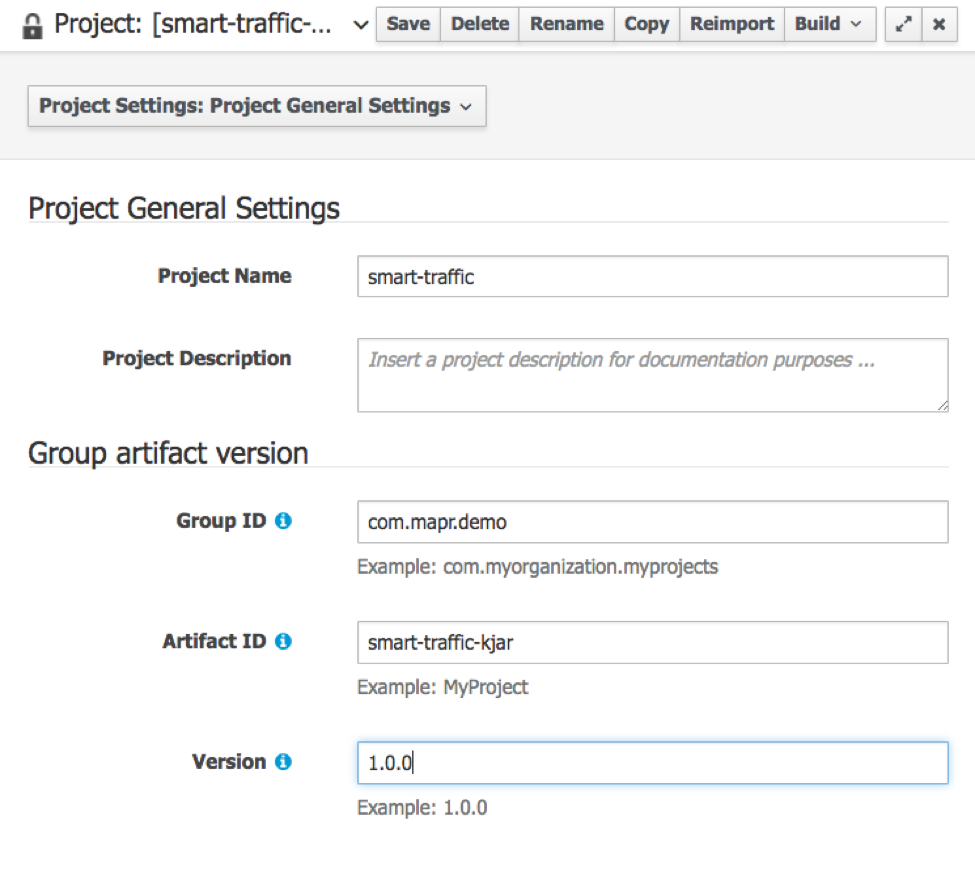
Using the Workbench
We can login to the Workbench and login with an admin user (a user with the role “admin”) created with the add-user.sh script from Wildfly.
Using the Workbench is beyond the scope of the article, but the general idea is to create an Organizational Unit and a Repository, and then create a project.
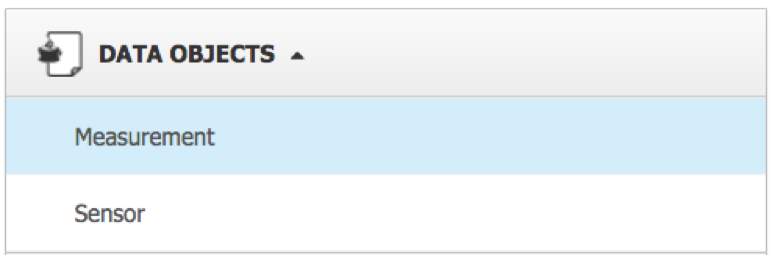
Data Objects
We will need to create facts for the rule engine to work with. Best practice for Drools is to use a separate Maven project for your data model. For the sake of simplicity, I created them right from the workbench.
The Measurement is a super generic bean which models the sensor speed measurements. For the prototype, I kept it as simple as the raw data with a timestamp, a sensor ID, and a speed.
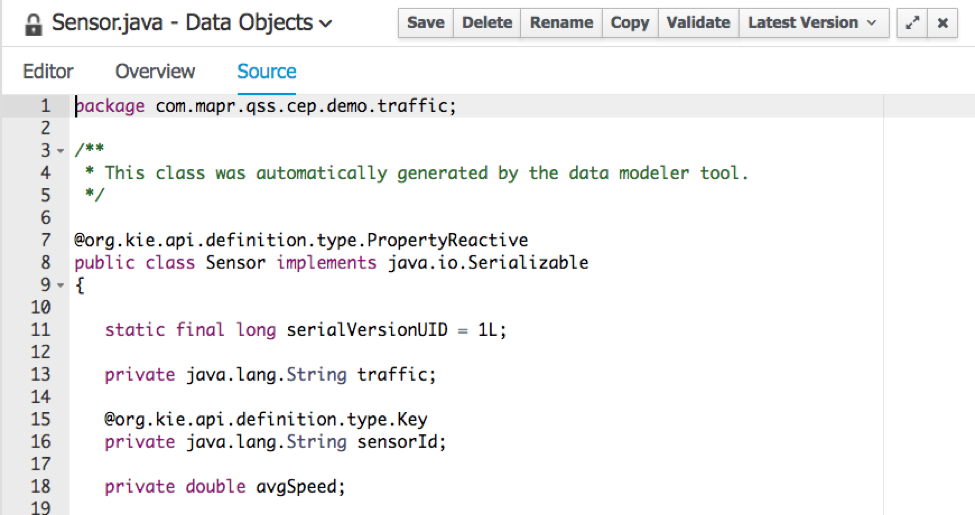
The Sen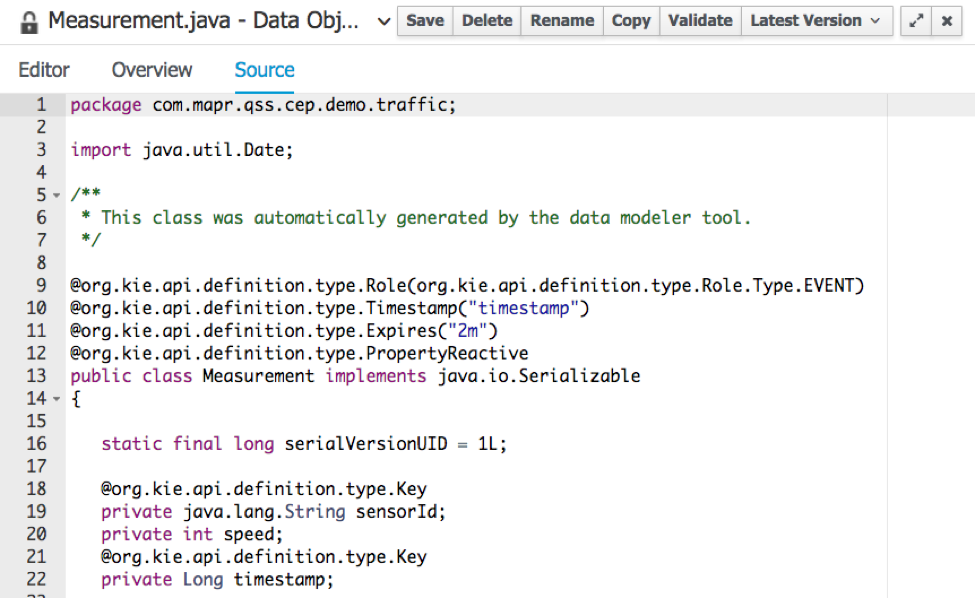 sor bean models the sensor itself and will have an ID and the average speed of all cars that it measures over a time window defined by our rules. This average speed will be used to trigger an alert for heavy traffic. The traffic String is to mark the current traffic level which can be “NONE”, “LIGHT” or “HEAVY.”
 The Traffic Monitoring Rules
- create sensors for new id
- detect heavy traffic
- detect light traffic
- detect normal traffic
- get average speed at sensor
The create sensors rule ensures that there are sensor objects available in memory. This is the fact we use to know the average speed at a certain sensor.
The detect heavy traffic is the key rule we want to use to send an alarm to the police if heavy traffic is detected at a certain sensor.
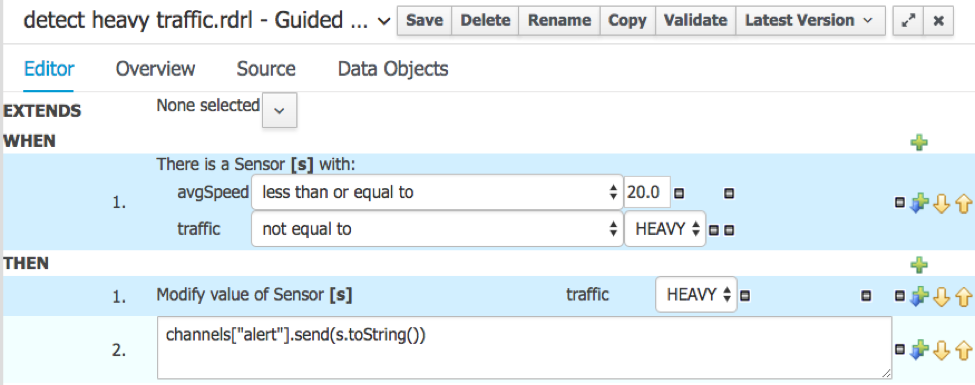
So when the average speed reaches 20 km/h or less, and the sensor isn’t already in the HEAVY traffic level, set the level to HEAVY and send an alert.
Which means we need to know the average speed. Here is the rule to compute it using the Drools rule DSL (domain specific language):
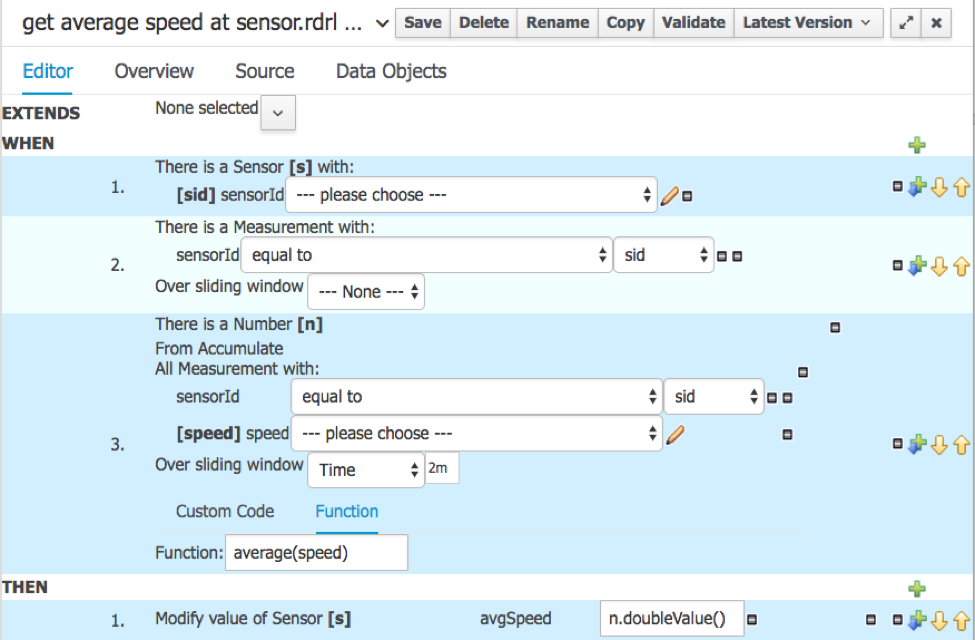
This is not rocket science! These rules illustrate rather clearly how making up simple but useful rules can be realistically left up to business analysts and developed separately from the whole stream and big data platform.
The Consumer Side
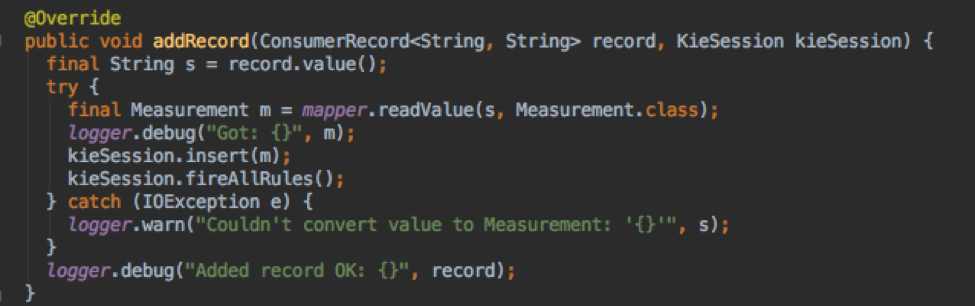
The consumer reads the data from the stream. The tutorial code in Java from the documentation is perfectly adequate. Jackson is used to convert the JSON to Measurement objects.
The consumer has an instance of the KieSession, and each measurement is added to the session using kieSession.insert(fact) and followed by a call to kieSession.fireAllRules(), which triggers the algorithm to check if any rules match with the new state of the session given the new data.
A channel, which is just a callback, is used to allow a rule to call a function “outside” of the KieSession. My Prototype uses this method to log the alert. In a production system, we could easily change the code to send an email, an SMS, or take some other action.
Importing the Rules into the Consumer Application
The way we get the rules into the running application is by fetching it from the Maven repository integrated into the Workbench.
KieServices kieServices = KieServices.Factory.get();
ReleaseId releaseId = kieServices.newReleaseId( "org.mapr.demo", "smart-traffic-kjar", "1.0.0" );
KieContainer kContainer = kieServices.newKieContainer( releaseId );

KieSession kieSession = kContainer.newKieSession();
So the question becomes, how does the call to newReleaseId know to fetch the artifact with our rules from the Maven repository in the Workbench?
The answer is with the ~/.m2/settings.xml file, where you add this information. We recommend to use the user mapr for everything in the sandbox, so the full path is: /home/mapr/.m2/settings.xml
[mapr@maprdemo .m2]$ cat settings.xml
<?xml version="1.0" encoding="UTF-8"?>
<settings>
<servers>
<server>
<id>guvnor-m2-repo</id>
<username>admin</username>
<password>admin</password>
</server>
</servers>
<profiles>
<profile>
<id>cep</id>
<repositories>
<repository>
<id>guvnor-m2-repo</id>
<name>Guvnor M2 Repo</name>
<url>http://127.0.0.1:28080/drools-wb-webapp/maven2/</url>
<releases>
<enabled>true</enabled>
<updatePolicy>interval:1</updatePolicy>
</releases>
<snapshots>
<enabled>true</enabled>
<updatePolicy>interval:1</updatePolicy>
</snapshots>
</repository>
</repositories>
</profile>
</profiles>
<activeProfiles>
<activeProfile>cep</activeProfile>
</activeProfiles>
</settings>
The key information is in bold, which corresponds to the URL of the maven2 repository of the Drools workbench. This information can be copied and pasted from the pom.xml which can be seen by using the repository view:
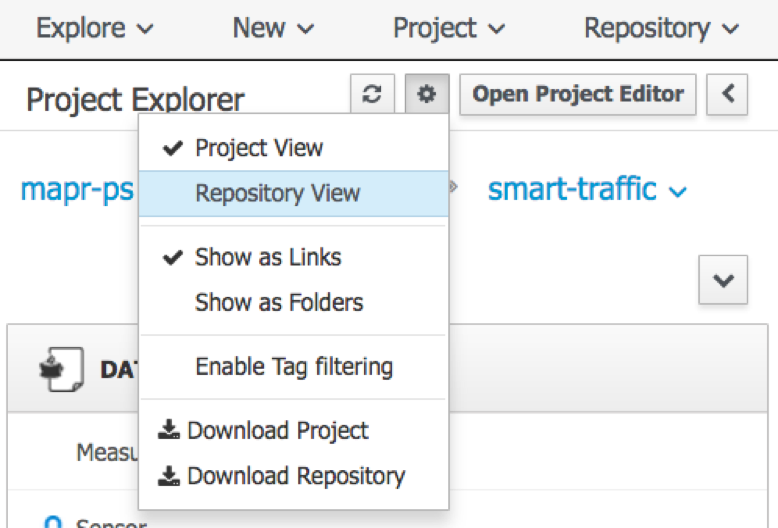
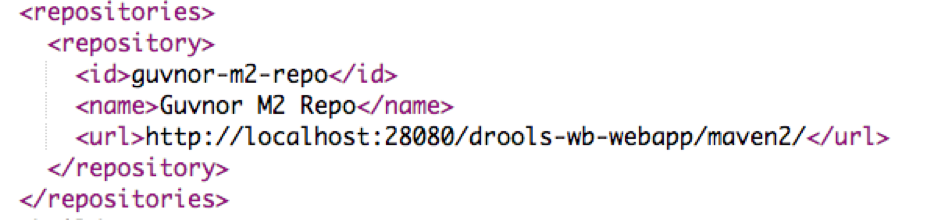
So I just copy-pasted that and now everything works like magic.
Monitoring the Smart Traffic Prototype
We have one stream with data, and two other streams to monitor the rule engine internals. This is very easy with Drools because it uses Java Listeners to report on its internal state. We simply provide a custom implementation of the listeners to produce the data to a stream, and then use Streamsets to redirect everybody to Elasticsearch.
Elasticsearch Mappings
The mappings are defined in a small script I created:
Streamsets for No-Code Stream To Elasticsearch Pipeline
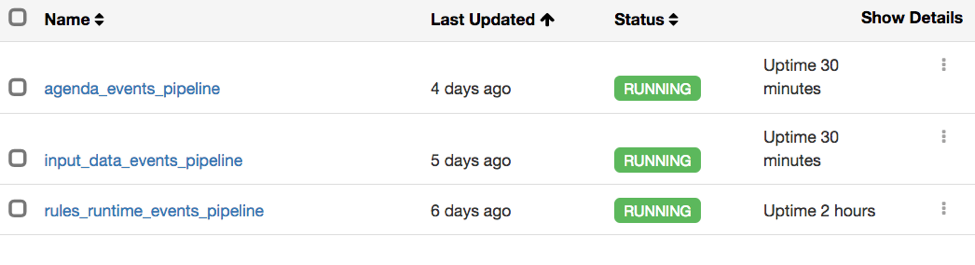
Each stream has its own pipeline, where each looks like this:
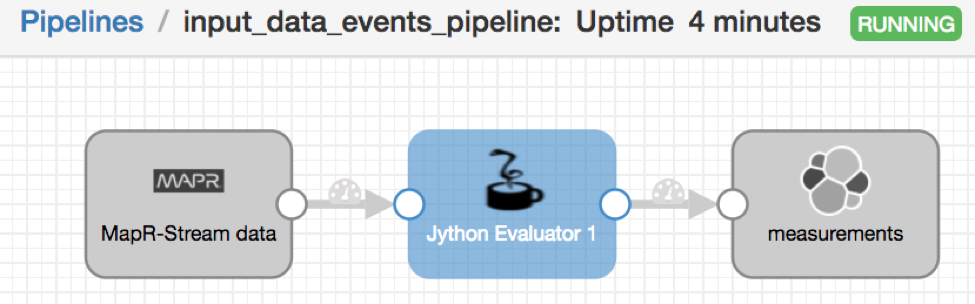
The Jython Evaluator adds timestamp information if necessary.
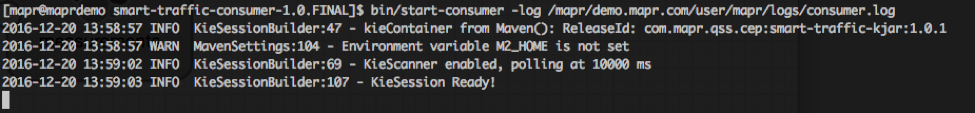
Running the Prototype
Start the consumer:
Then start the producer:

In my prototype, I added code to control the rate at which the data is sent to the stream to make the rules firing easier to see. 10,000 events are quite small for Drools and for MapR Streams/Kafka, and so the whole demo would be over in less than a second. This is the meaning of the “-r 25” for 25 events per second rate.
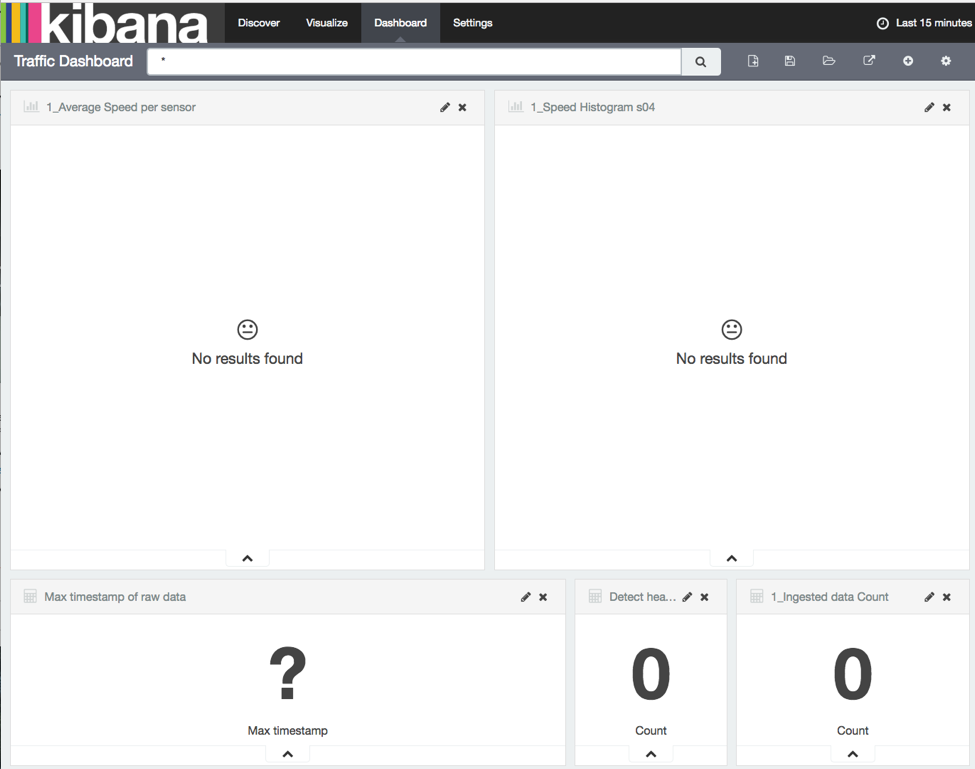
The dashboard looks like this:
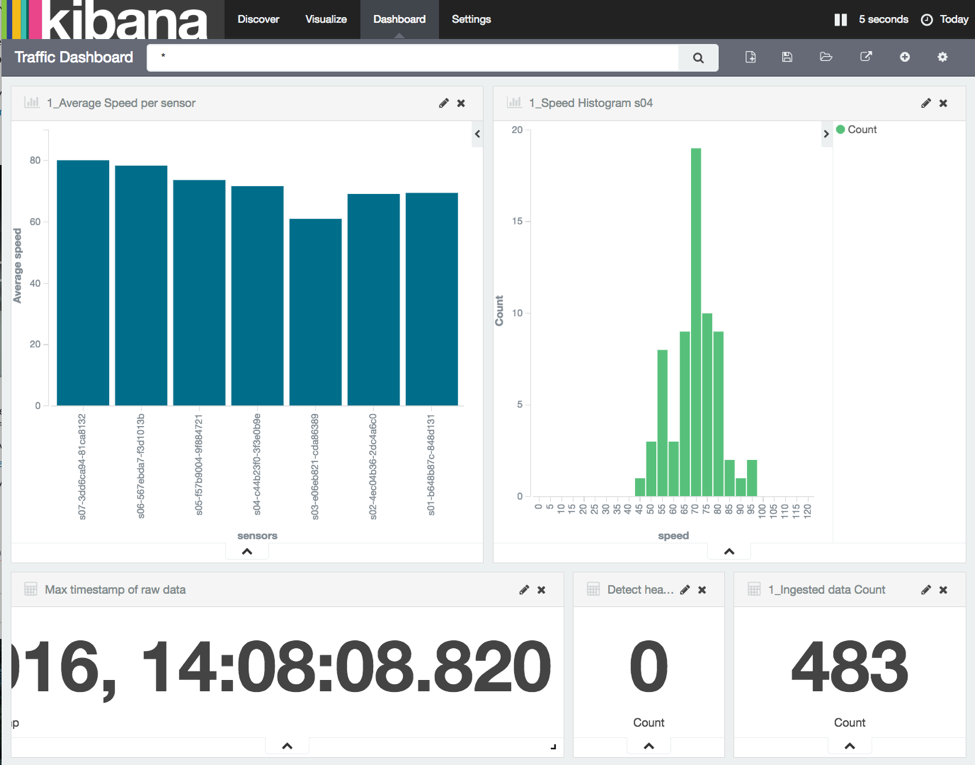
Once data starts to stream in:
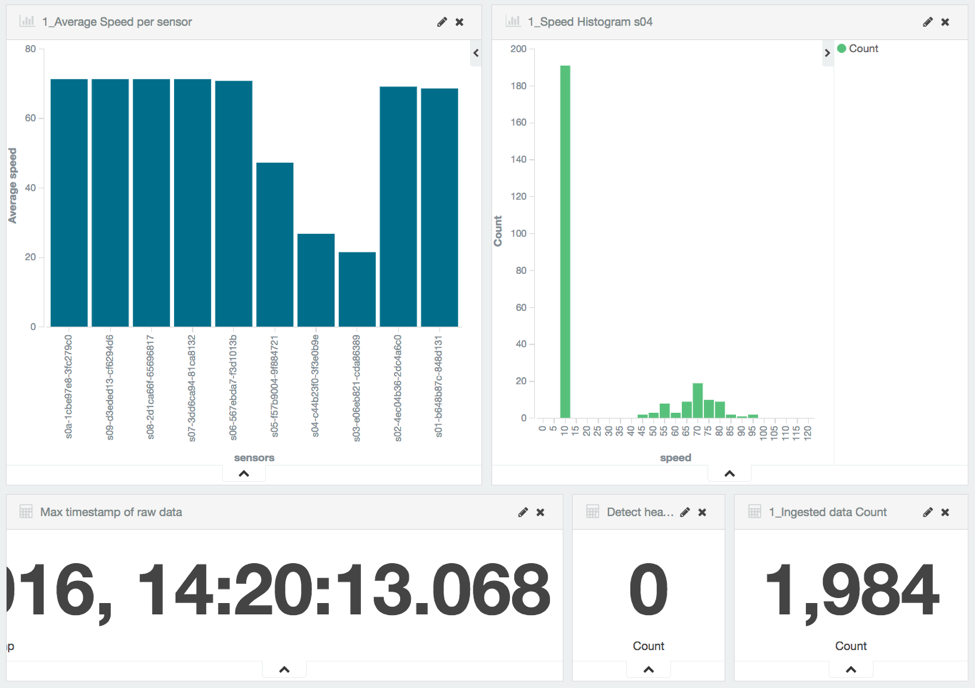
The traffic jam is quite visible now:
As soon as a sensor average speed drops below 20 km/h, an alarm is fired:
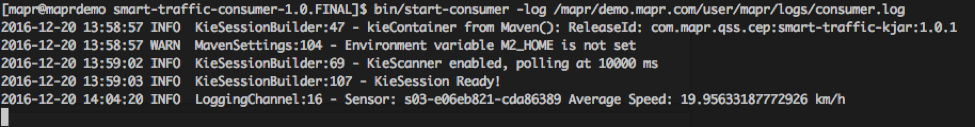
And the dashboard will display a count of “1”
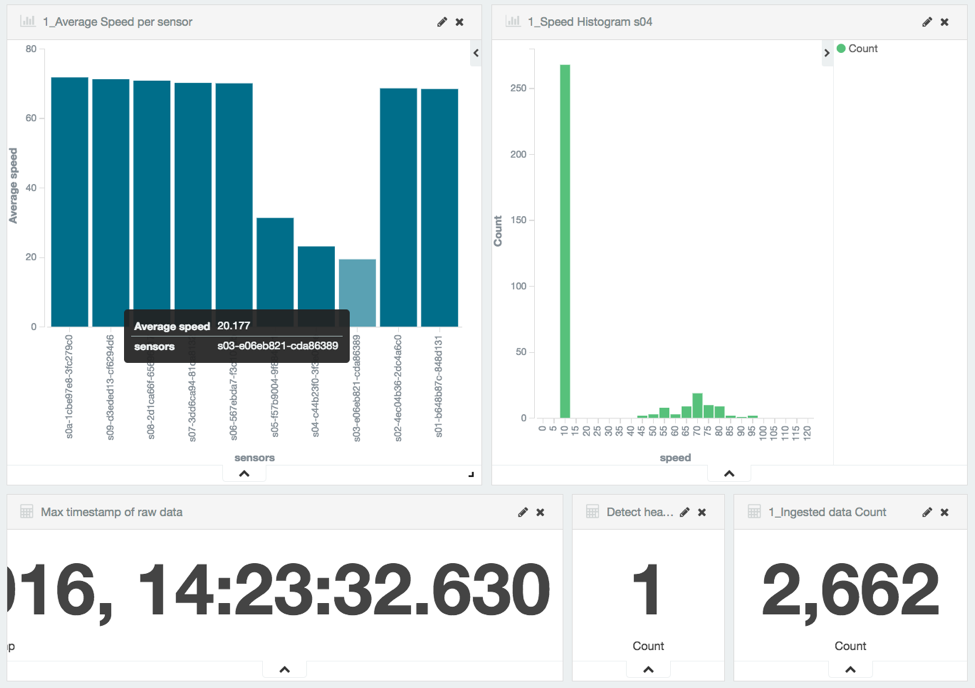
The simulation will continue and the two other sensors will go below 20 in turn for a total of 3 alarms fired.
In Conclusion
This project turned into a great illustration of the power and ease of streaming architectures using microservices. A common misconception of microservices is that they are limited to synchronous REST services. This is not the case at all. Our system is a backend system and so the microservices (the producer, the consumer, streamsets, and ES/Kibana) are all run asynchronously, dealing with the data as it comes off the stream.
The project was fairly easy to build technically because every part is totally independent of the others, and can therefore be tested in isolation. Once the producer can send data to the stream properly, it doesn’t need to be tested ever again for issues that concern other parts of the system. Also, each part was added one at a time, making it easy to identify issues and fix them.
In total, with very little original code, we could implement a working, useful system that would need very little change to be put into production. Only the producer needs to be customized for the particular sensor or data source.
Rules are the most time consuming and error-prone part. This is no different than if the project had been done using custom-coded Spark code. The win for an approach based on a rule engine such as Drools and the Drools Workbench is that the rules can be edited, tested, and improved independently of how the code runs on the cluster. The work in Workbench has no dependency on the system at all, as it is pulled in by the consumer application automatically.
From a business value point of view, all the value is in the rules, assuming a stable production system. There is no reason for organizations not to take advantage of this quick edition capability to become ever more agile and responsive to evolving conditions for the benefit of their customers… and the bottom line.
| Reference: | Real-time Smart City Traffic Monitoring Using Microservices-based Streaming Architecture (Part 2) from our JCG partner Mathieu Dumoulin at the Mapr blog. |
