Monitoring Real-Time Uber Data Using Spark Machine Learning, Streaming, and the Kafka API (Part 1)
According to Gartner, by 2020, a quarter of a billion connected cars will form a major element of the Internet of Things. Connected vehicles are projected to generate 25GB of data per hour, which can be analyzed to provide real-time monitoring and apps, and will lead to new concepts of mobility and vehicle usage. One of the 10 major areas in which big data is currently being used to excellent advantage is in improving cities. For example, the analysis of GPS car data can allow cities to optimize traffic flows based on real-time traffic information.
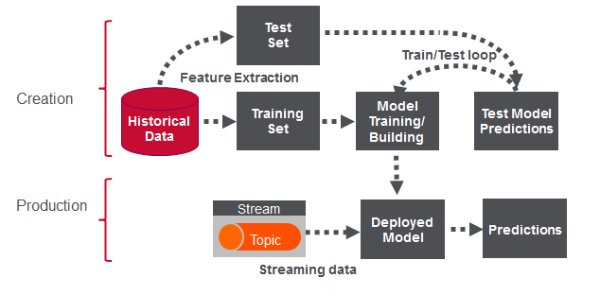
Uber is using big data to perfect its processes, from calculating Uber’s pricing, to finding the optimal positioning of cars to maximize profits. In this series of blog posts, we are going to use public Uber trip data to discuss building a real-time example for analysis and monitoring of car GPS data. There are typically two phases in machine learning with real-time data:
- Data Discovery: The first phase involves analysis on historical data to build the machine learning model.
- Analytics Using the Model: The second phase uses the model in production on live events. (Note that Spark does provide some streaming machine learning algorithms, but you still often need to do an analysis of historical data.)
In this first post, I’ll help you get started using Apache Spark’s machine learning K-means algorithm to cluster Uber data based on location.
Clustering
Google News uses a technique called clustering to group news articles into different categories, based on title and content. Clustering algorithms discover groupings that occur in collections of data.
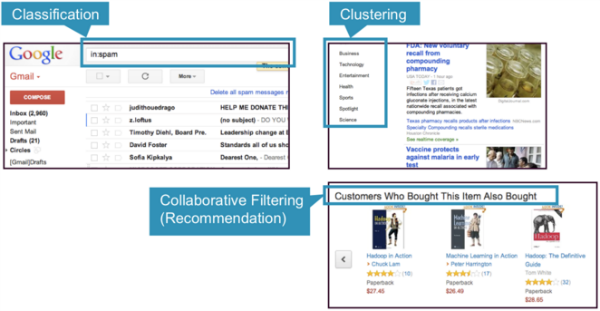
In clustering, an algorithm groups objects into categories by analyzing similarities between input examples. Examples of clustering uses include:
- Search results grouping
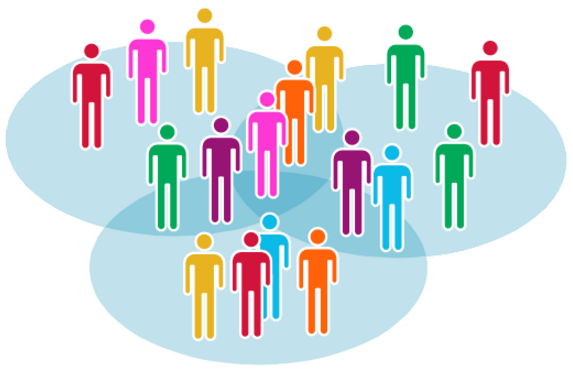
- Grouping of customers
- Anomaly detection
- Text categorization
Clustering uses unsupervised algorithms, which do not have the outputs (labeled data) in advance.
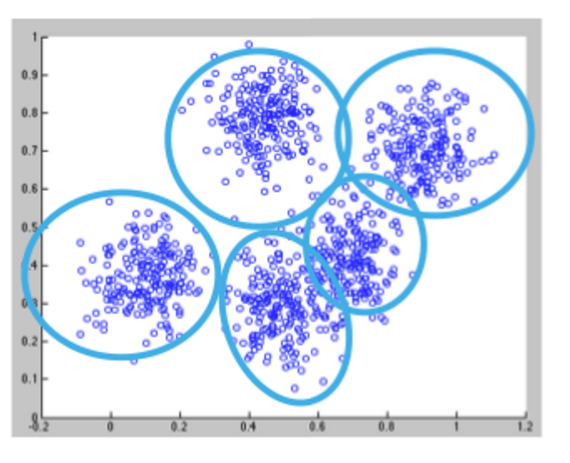
K-means is one of the most commonly used clustering algorithms that clusters the data points into a predefined number of clusters (k). Clustering using the K-means algorithm begins by initializing all the coordinates to k number of centroids. With every pass of the algorithm, each point is assigned to its nearest centroid based on some distance metric, which is usually Euclidean distance. The centroids are then updated to be the “centers” of all the points assigned to it in that pass. This repeats until there is a minimum change in the centers.
Example Use Case Data Set
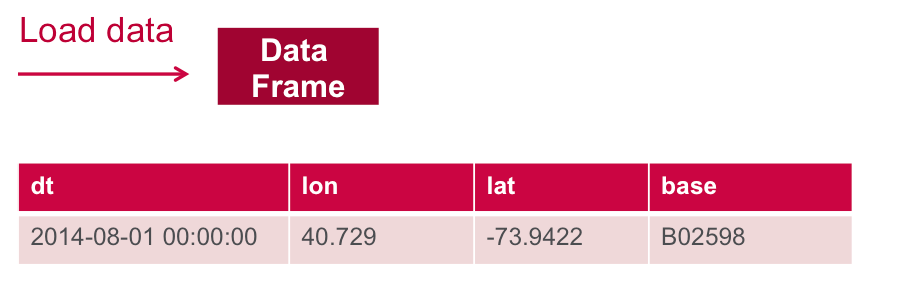
The example data set is Uber trip data, which FiveThirtyEight obtained from the NYC Taxi & Limousine Commission. In this example, we will discover the clusters of Uber data based on the longitude and latitude, then we will analyze the cluster centers by date/time. The data set has the following schema:
The Data Set Schema
- Date/Time: The date and time of the Uber pickup
- Lat: The latitude of the Uber pickup
- Lon: The longitude of the Uber pickup
- Base: The TLC base company affiliated with the Uber pickup
The Data Records are in CSV format. An example line is shown below:
2014-08-01 00:00:00,40.729,-73.9422,B02598
Example Use Case Code
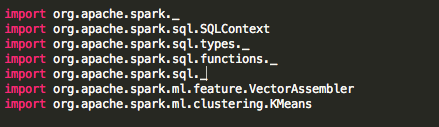
First, we import the packages needed for Spark ML K-means and SQL.
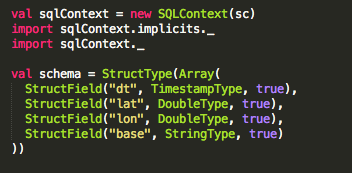
We specify the schema with a Spark Structype (Please note that if you are using a notebook, then you do not have to create the SQLContext).
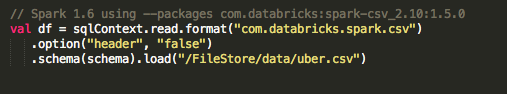
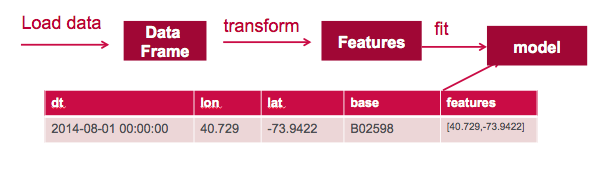
Next, we load the data from a CSV file into a Spark DataFrame.
Using Spark 1.6 and –packages com.databricks:spark-csv_2.10:1.5.0, we create a DataFrame from a CSV file data source and apply the schema.
Or using Spark 2.0, we can specify the data source and schema to load into a DataFrame, as shown below:
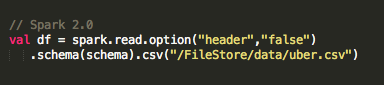
Note that with Spark 2.0, specifying the schema when loading data into a DataFrame will give better performance than schema inference.
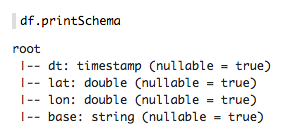
DataFrame printSchema() prints the schema to the console in a tree format, shown below after running in a Zeppelin notebook:
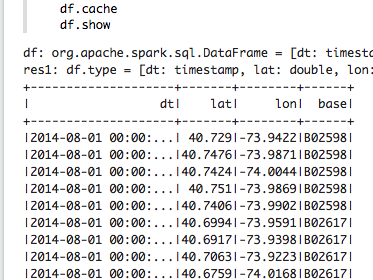
DataFrame show() displays the first 20 rows:
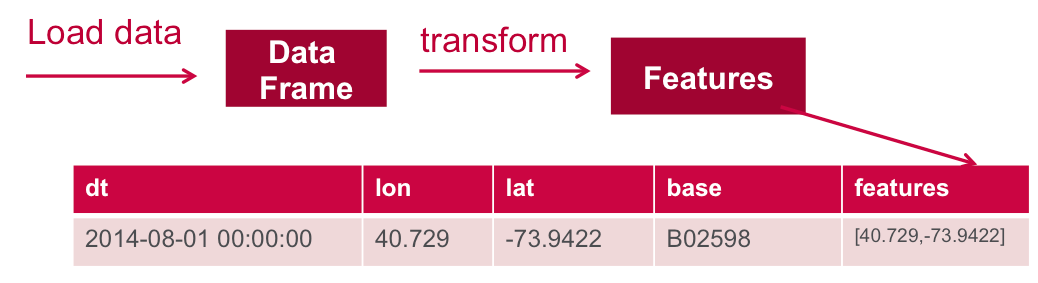
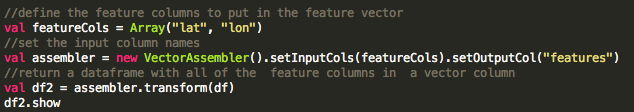
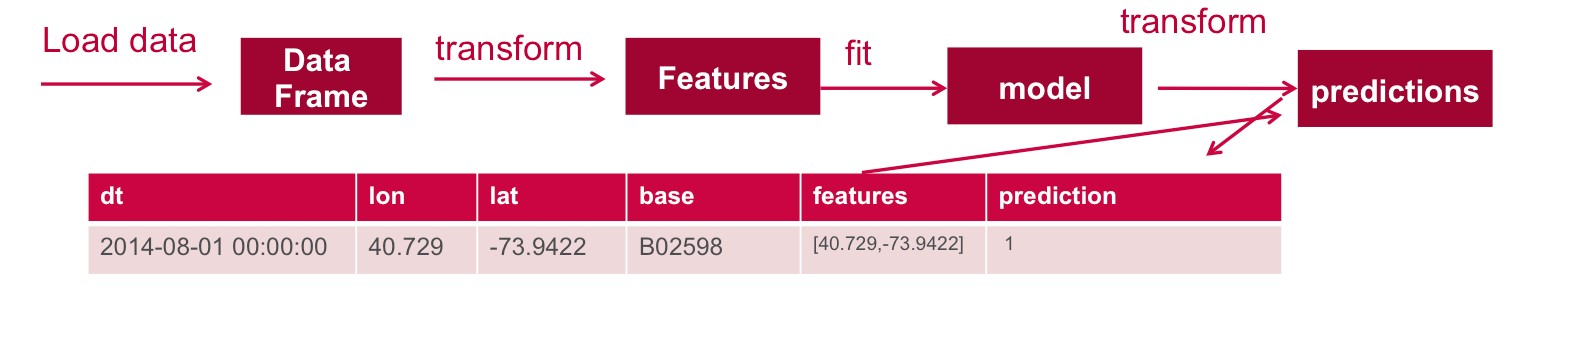
Define Features Array
In order for the features to be used by a machine learning algorithm, the features are transformed and put into Feature Vectors, which are vectors of numbers representing the value for each feature. Below, a VectorAssembler is used to transform and return a new DataFrame with all of the feature columns in a vector column.
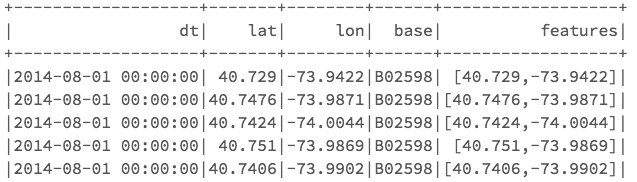
Output of df2.show:
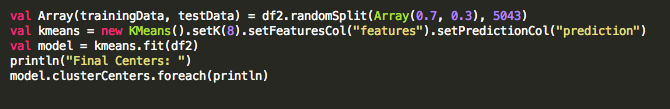
Next, we create a KMeans object, set the parameters to define the number of clusters and the maximum number of iterations to determine the clusters, and then we fit the model to the input data.
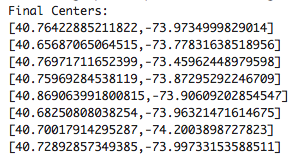
Output of model clusterCenters :
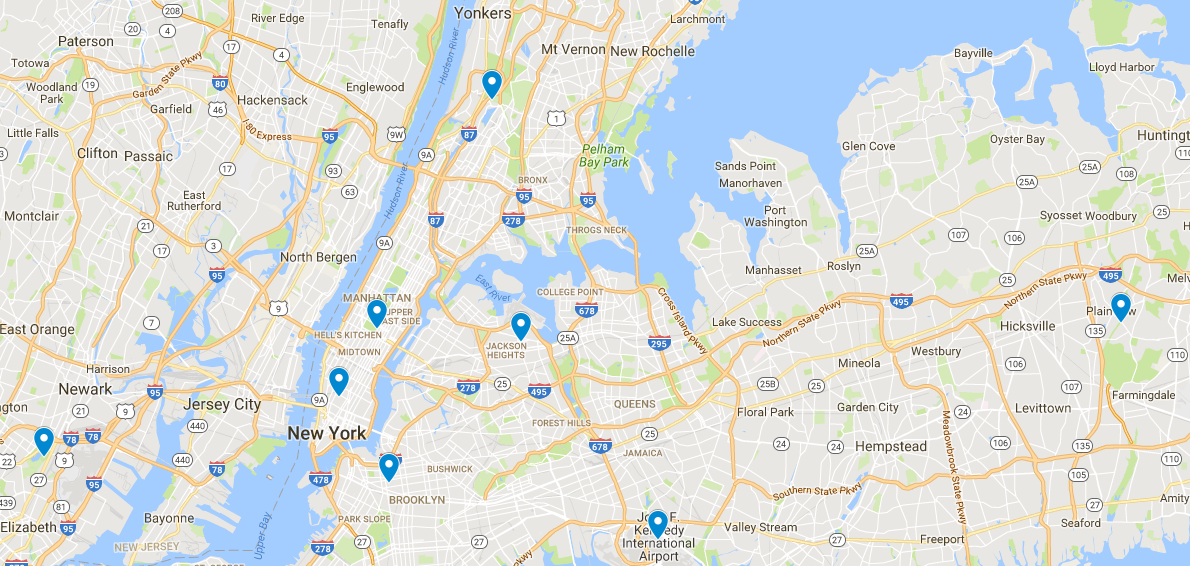
Below, the cluster centers are displayed on a Google map:
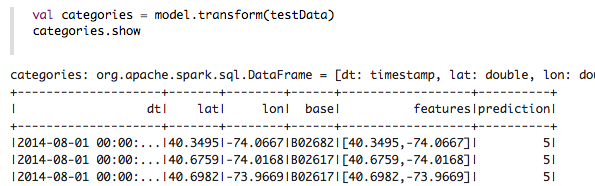
Next, we use the model to get the clusters for test data in order to further analyze the clustering.
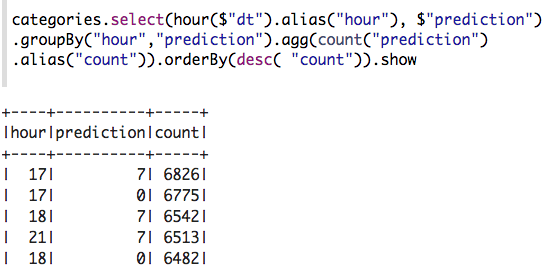
Now we can ask questions like, “Which hours of the day and which cluster had the highest number of pickups?”
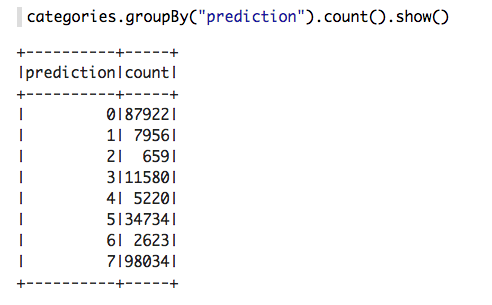
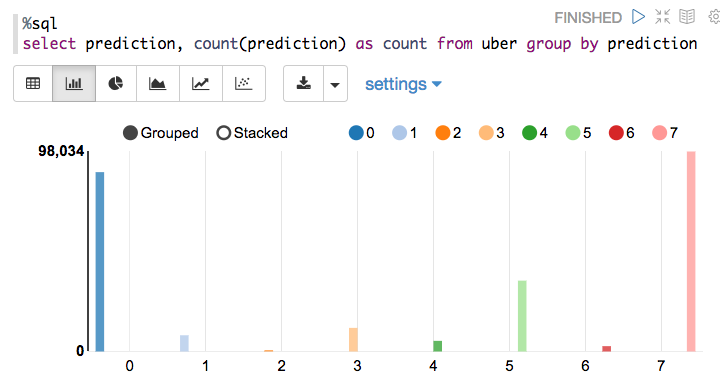
How many pickups occurred in each cluster?
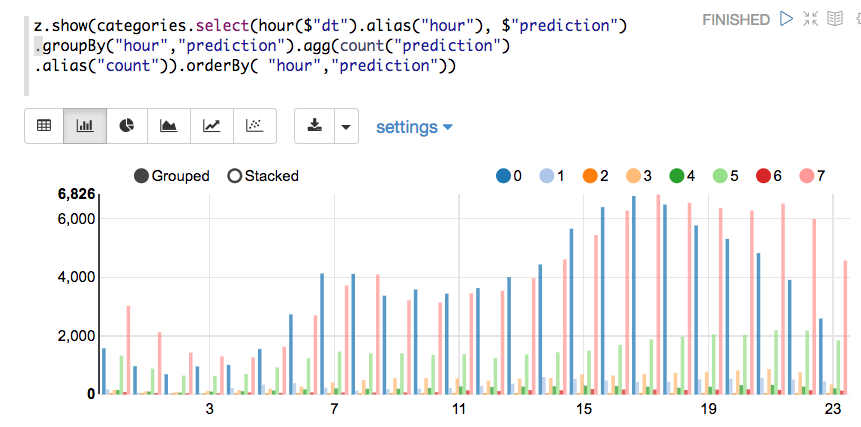
With a Zeppelin notebook, we can also display query results in bar charts or graphs. Below the x axis is the hour, the y axis the count, and the colors are the different clusters.
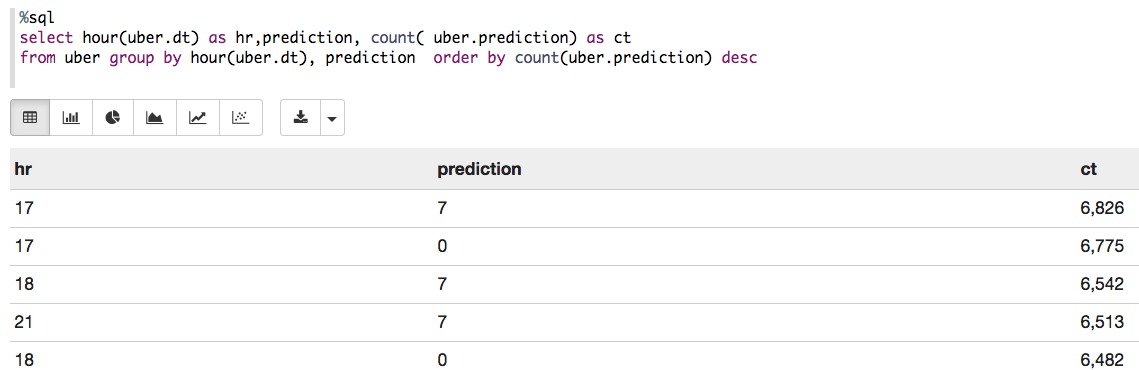
You can register a DataFrame as a temporary table using a given name, for example: df.registerTempTable(“uber”) , and then run SQL statements using the SQL methods provided by sqlContext. An example is shown below in a Zeppelin notebook.
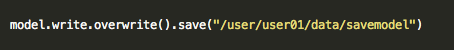
The model can be persisted to disk as shown below, in order to use later (for example, with Spark Streaming).
Software
This tutorial will run on Spark 1.6.1
- You can download the code, data, and readme to run this example from here: https://github.com/caroljmcdonald/spark-ml-kmeans-uber
- The example in this post can be run in the Spark shell, or in a Zeppelin notebook. Log into the MapR Sandbox, as explained in Getting Started with Spark on MapR Sandbox, using userid user01, password mapr. Copy the sample data file to your sandbox home directory /user/user01 using scp as explained in the readme.
- To run as a standalone application, copy the jar file to the cluster using scp, as explained in the readme, then run with the following command:
- $ spark-submit –class com.sparkml.uber.ClusterUber –master local[2] –packages com.databricks:spark-csv_2.10:1.5.0 spark-kmeans-1.0.jar
- To run in the Spark shell, start the Spark shell with: $spark-shell –master local[1]
- Then copy/paste the code from the ClusterUber.scala file
- To run in Zeppelin, install Zeppelin for MapR 5.2 as explained here https://www.mapr.com/blog/building-apache-zeppelin-mapr-using-spark-under-yarn or here https://community.mapr.com/docs/DOC-1493 (Note this requires a lot of space to build, I recommend building on your laptop, then copying the tar file) . After installing, import the notebook in the notebooks directory
In this blog post, we went over how to get started using Apache Spark’s machine learning K-means for clustering. In the next blog post, we’ll look at using the model in a Spark Streaming application.
Want to learn more?
- Free On-Demand Training: Apache Spark, MapR Streams with the Kafka API, HBase
- MapR and Spark
- Apache Spark ML overview
- Apache Spark Machine Learning Tutorial
- Real-Time Credit Card Fraud Detection with Apache Spark and Event Streaming
| Reference: | Monitoring Real-Time Uber Data Using Spark Machine Learning, Streaming, and the Kafka API (Part 1) from our JCG partner Carol McDonald at the Mapr blog. |
