In the Forwarding Logs From All Containers Running Anywhere Inside A Docker Swarm Cluster article, we managed to add centralized logging to our cluster. Logs from any container running inside any of the nodes are shipped to a central location. They are stored in ElasticSearch and available through Kibana. However, the fact that we have easy access to all the logs does not mean that we have all the information we would need to debug a problem or prevent it from happening in the first place. We need to complement our logs with the rest of the information about the system. We need much more than what logs alone can provide.
The Requirements Of a Cluster Monitoring System
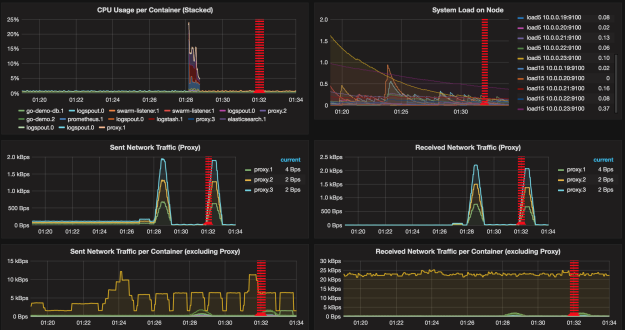
Grafana dashboard with network traffic graphs[/caption]By using cluster schedulers, we are, at the same time, decreasing and increasing the complexity of our system. Scaling a service is easier and less complex with Docker Swarm than it would be with containers alone. The fact is that Docker already simplified a lot the process we had before. Add to that the new networking with service discovery baked in, and the result is almost too simple to be true. On the other hand, there is complexity hidden below the surface. One of the ways such complexity manifests itself can be easily observed if we try to combine dynamic tools we used so far with those created in a different era.
Take Nagios as an example. I won’t say that we could not use it to monitor our system (we certainly can). What I will state is that it would clash with the new system’s architecture we are designing around containers running inside a cluster. Our system got much more complex than it was. The number of replicas is fluctuating. While today we have four instances of a service, tomorrow morning there could be six, only to fall to three in the afternoon. They are distributed across multiple nodes of the cluster and being moved around. Servers are being created and destroyed. Our cluster and everything inside it is truly dynamic and elastic.
Such a dynamic nature of the system we are building would not fit into Nagios which expects services and servers to be relatively static. It expects us to define things in advance. The problem with such an approach is that we do not have the information in advance. Swarm does. Even if we get the information we need, it will change soon.
The system we’re building is highly dynamic and the tools we should use to monitor such a system need to be able to cope with such a dynamism.
It’s more than that. Most of the “traditional” tools tend to treat the whole system as a black box. That, on the one hand, has a certain number of advantages. The main one is that it allows us to decouple our services from the rest of the system. In many (but not all) cases, white box monitoring means that we need to add to our services monitoring libraries and write some code around them so that they can expose the internals of our services.
Think twice before choosing to add something to your service that is not strictly its job. When we adopt microservices approach, we should strive towards services being functionally limited to their primary goal. If it’s a shopping cart, it should be about API that will allow us to add and remove items. Adding libraries and code that will extend such a service so that it can register itself in a service discovery store, or expose its metrics to the monitoring tool produces too much coupling. Once we do that, our future options will be very limited, and a change in the system might require a considerable time.
We already managed to avoid coupling service discovery with our services. The go-demo service does not have any knowledge of service discovery and, yet, our system has all the information it needs. There are many other examples when organizations fall into a trap and start coupling their services with the system around them. In this case, our main preoccupation is whether we can accomplish the same with monitoring. Can we avoid coupling creation of metrics with the code we write for our services?
Then again, being able to do white box monitoring provides a lot of benefits black box does not have. For one, understanding the internals of a service allows us to operate with much finer level of details. It gives us knowledge that we could not obtain if we would treat the system as a black box.
In a world of distributed systems designed for high availability and fast response time, it is not enough to be limited to health checks and CPU, memory, and disk usage monitoring. We already have Swarm that makes sure that the services are healthy and we could easily make scripts that check essential resource usage. We need much more than that. We need a white box monitoring that does not introduce unnecessary coupling. We need intelligent alerting that will notify us when something is wrong or even automatically fix the problem. Ideally, we would have alerts and automated corrections executed before the problems even happen.
Some of the requirements we’d need from a monitoring system would be as follows.
- A decentralized way of generating metrics that will be able to cope with the high dynamism of our cluster.
- A multi-dimensional data model that can be queried across as many dimensions as needed.
- An efficient query language that will allow us to exploit our monitoring data model and create effective alerting and visualization.
- Simplicity that will allow (almost) anyone to utilize the system without an extensive training
In this article, we’ll explore ways to export a different set of metrics, a way to collect them, query them, and expose them through dashboards.
Before we do all that, we should make some choices. Which tools shall we use for our monitoring solution?
Choosing The Right Database To Store System Metrics
In The DevOps 2.0 Toolkit, I argued against the “traditional” monitoring tools like Nagios and Icinga. Instead, we chose to use ElasticSearch for both the logs and the system metrics. In the Forwarding Logs From All Containers Running Anywhere Inside A Docker Swarm Cluster article, I reiterated the choice for using ElasticSearch as the logging solution. Can we extend its usage by storing metrics? Yes, we can. Should we do that? Should we use it as a place to store system metrics? Are there better solutions?
The biggest problem with ElasticSearch, if used as a database to store system metrics, is that it is not a time series type of database. Logs benefit greatly from ElasticSearch capability to perform free text search and store data in an unstructured way. However, for system metrics, we might take advantage of a different type of a data storage. We need a time series database.
Time series databases are designed around optimized ways to store and retrieve time series data. One of their greatest benefits is that they store information in a very compact format allowing them to host a vast amount of data. If you compare storage needs for time-based data in other types of databases (ElasticSearch included), you’ll discover that time series databases are much more efficient. In other words, if your data are time-based metrics, use a database designed for such data.
The biggest problem with most (if not all) time series databases is distributed storage. Running them with replication is not possible or a challenge at best. To put it bluntly, such databases are designed to run a single instance. Luckily we often do not need to store long term data in such databases and can clean them up periodically. If a long term storage is a must, the solution would be to export aggregated data into some other type of a database like ElasticSearch which, by the way, shines when it comes to replication and sharding. However, before you go “crazy” and start exporting data, make sure that you truly need to do something like that. Time series databases can easily store a vast amount of information in a single instance. The chances are that you won’t need to scale them for capacity reasons. On the other hand, if a database fails, Swarm will reschedule it, and you’ll loose only a few seconds of information. Such a scenario should not be a disaster since we are dealing with aggregated data, not individual transactions.
One of the most prominent time series databases is InfluxDB. Prometheus is a commonly used alternative. We’ll skip the comparison of those two products except noting that we’ll use the later. Both are worthy candidates for your monitoring solution with Prometheus having a potential advantage we should not ignore. The community plan is to expose Docker metrics natively in Prometheus format. At the time of this writing, there is no fixed date when that’ll happen, but we’ll do our best to design the system around that plan. If you’d like to monitor the progress yourself, please watch the Docker issue 27307.
The article you just finished reading is an (slightly modified) extract from the Collecting Metrics and Monitoring The Cluster chapter of The DevOps 2.1 Toolkit: Docker Swarm book.
The DevOps 2.1 Toolkit: Docker Swarm
If you liked this article, you might be interested in The DevOps 2.1 Toolkit: Docker Swarm book. Unlike the previous title in the series (The DevOps 2.0 Toolkit: Automating the Continuous Deployment Pipeline with Containerized Microservices) that provided a general overlook of some of the latest DevOps practices and tools, this book is dedicated entirely to Docker Swarm and the processes and tools we might need to build, test, deploy, and monitor services running inside a cluster.
The book is still under “development”. You can get a copy from LeanPub. It is also available as The DevOps Toolkit Series bundle. If you download it now, before it is fully finished, you will get frequent updates with new chapters and corrections. More importantly, you will be able to influence the direction of the book by sending me your feedback.
I choose the lean approach to book publishing because I believe that early feedback is the best way to produce a great product. Please help me make this book a reference to anyone wanting to adopt Docker Swarm for cluster orchestration and scheduling.
| Reference: | Collecting Metrics and Monitoring Docker Swarm Clusters from our JCG partner Viktor Farcic at the Technology conversations blog. |
