Sumo Logic vs Graylog vs Loggly vs PaperTrail vs Logentries vs Stackify
Everyone uses log files to search and understand errors, crashes and exceptions in their application. Some use the direct approach and sift through plain text log files, while others rely on log management tools to help them find the bug in the log-haystack.
In the following post we’ll go over some of the log management tools that are not always getting the attention they deserve, but definitely worth mentioning. Are you ready to tidy up your logs?
The answer is in the logs
If you had to take a wild guess, how much data would you think your log files accumulate each day? Will your answer be in GB? Or maybe TB?
Log files are the sand on top of our application’s dinosaur bones. Meaning we have to dust off a lot of sand to get to the actual data that will tell us what happened up until now. We sift through line after line in our logs, whether manually or through regex queries, trying to analyze what happened in the code that lead to an error or exceptions.
Log management tools help us get a better overview of our application’s data. Some tools gather similar errors together, some generate graphs and others try and give contextual data around the time of the event.
We’ve already covered the 2 big tools in the market that include Splunk and ELK. That’s why in this post we’ve collected other tools that might be relevant to you, each with its own special skill set.
Loggly
Loggly offers an agentless log collector, so you don’t need to install anything in order to collect information from your log files. The data is sent to Loggly via a token, or the standard syslog and HTTP or HTTPS, using the software you already have.
It accepts text based logs from any source – server or client and supports numerous languages and platforms such as Ruby, Java, Python, Javascript, PHP, Apache server, Tomcat, MySQL, syslog-ng, rsyslog, nxlog and others.
Dashboard and features
Loggy automatically detects and parses common log types, letting you to define custom parsing rules and add them to the log event. You can create custom tags to mark certain error messages, so you’ll be able to follow up on them.
You can create a custom overview of the dashboard using these tags, or view groups based on host, application and any other filtering option relevant to you. Graphs are used to show patterns in the log data, identifying anomalies and giving a better overview of the application’s current status.
Integrations
New Relic, Nagios, Slack and HipChat.
Pricing
The free lite version offers up to 200MB/day of data, which is around 6GB/month. The standard plan start at $49/month, 1 GB/ day, equivalent to 30 GB/ month.
The pro plan includes 1 GB – 1.5 TB/ day, equivalent to 30 GB – 45 TB/ month for $199/month and for enterprises the price starts at $349/month, with a plan detailed to each company needs.
Bottom line: The agentless approach means that it’s mainly for sending data from your application servers to Loggly.
PaperTrail
PaperTrail collects application logs, text logs files and syslog into one dashboard. It gives you an overview of current events and shows you insights from logs you’ve already collected.
It supports Android, C#, .NET, Docker, Java (through log4j and logback), JavaScript, MySQL, Node.js, PHP, Perl, Python, Ruby and systemd.
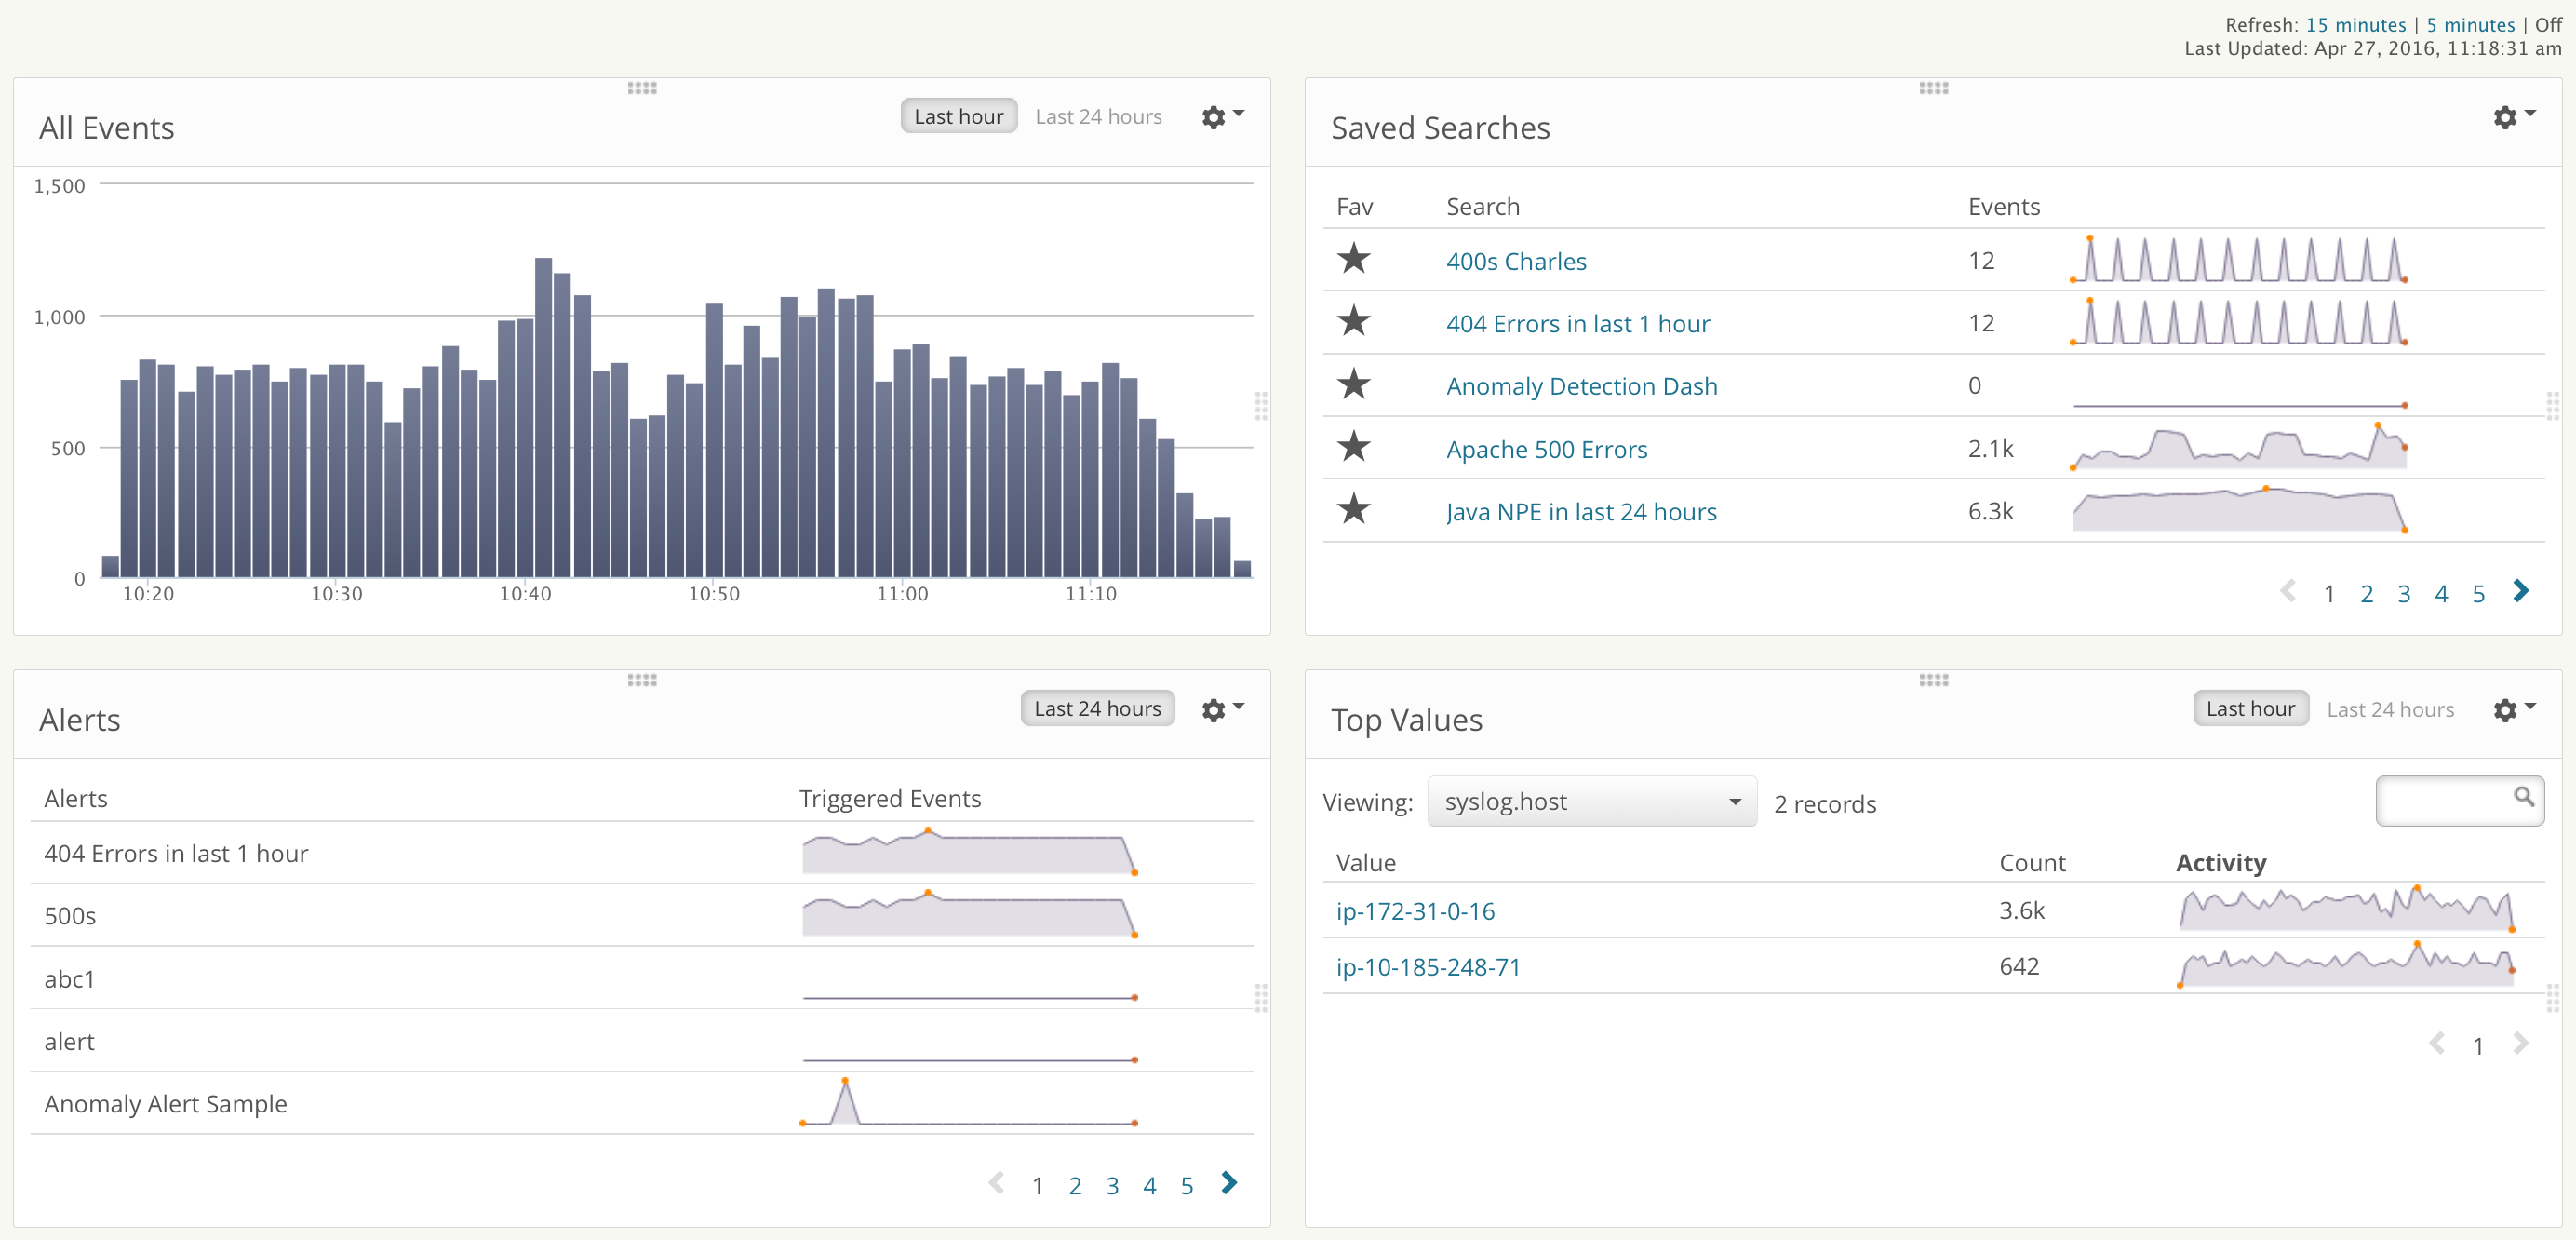
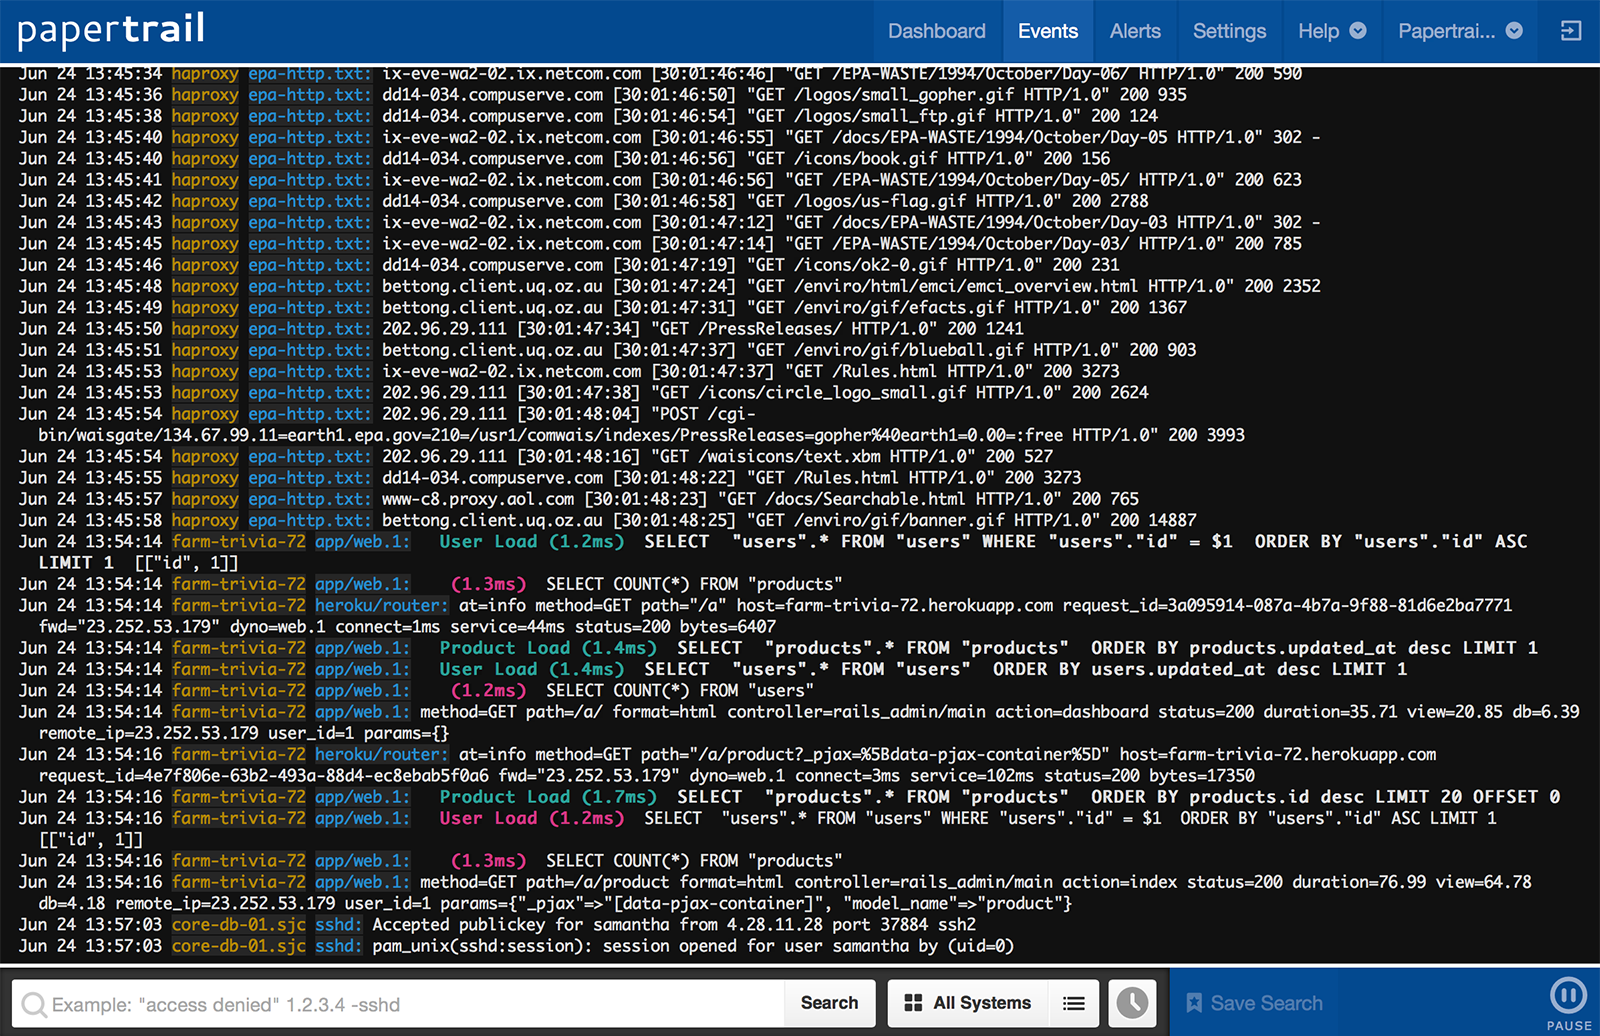
Dashboard and features
The dashboard collects various events which include customer problems, error messages, app requests, slow DB queries, config changes and other information the might be relevant. You can go through the events as they’re logged in real time, when relevant events are gathered together.
Real time logging also comes in handy when filtering and searching through events, showing results as soon as they enter the system. You can save the search queries, and create custom alerts for each one. That way you’ll be able to know when a certain error or exception is thrown via email or one of the supported tools.
Integrations
Campfire, Datadog, Geckoboard, Hipchat, Librato, New Relic, OpsGenie, PagerDuty, Slack, StatHat.
Pricing
The free plan offers 5GB for the first month, followed by 100MB/month for the rest of the plan, with a search duration of 48 hours and an archive of 7 days.
Paid plans start from $5/month and run through $35/month, $75/month, $150/month, $230/month and higher. You can customize the searchable duration in each plan to range from 1 day up to 4 weeks, which affects the price.
Bottom line: Real-time monitoring can be helpful in detecting issues as they occur, lowering the response time of the development team and identifying issues in time.
Logentries
Logentries display data from all of your log files in real time, letting you choose between an agent or go for the agentless approach, using syslog or LogStash. You can see an overview of how your application is currently doing, detecting errors, exceptions and other issues that might hurt your users.
The tools supports .NET, Android, GoLang, iOS, Java, Javascript/HTML5, node.js, PHP, Python and Ruby.
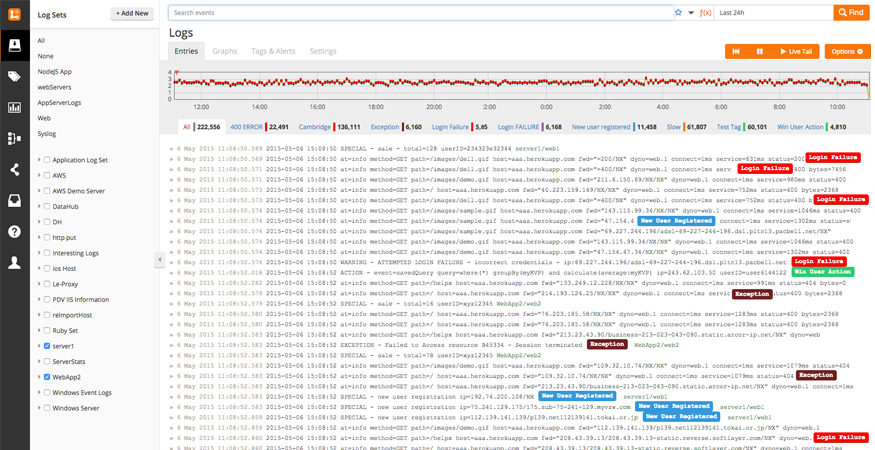
Dashboard and features
The dashboard displays logs from various servers, applications, databases, firewalls, load balancers, routers and anything else you’d like to follow up on in your application. There’s a wide range of visualization options, such as graphs, pie charts, bar charts, table view etc. You can also export it to Hosted Graphite and Geckoboard.
You can filter the logs in real time, searching through the events as they happen and create custom tags and alerts for each search. The alerts can be pattern based, anomaly detection or anything else you’d like to know as soon as it happens.
Logentries uses LEQL, their own query language based on SQL. This enables the ability to perform calculations like average, sum, min, max or percentile. You can also use it to sort the results, specify the view by timeslice or any other filter you’re interested in.
Integrations
REST API lets you automate reports, manage users or create custom integrations. Other than that, the tools works with Slack, HipChat, PagerDuty, OpsGenie, BigPanda, Campfire and Webhooks.
Pricing
The free plan lets you send up to 5GB/month with a 7 day retention. The paid plans start from $39/month for up to 30GB/month and a 14 day retention, and can go up to $329/month for up to 150GB/month and 30 day retention. The pricing range according to the amount of data you’re interested in, with special discounts for a yearly plan.
Bottom line: The unique search language is interesting, but it means you’ll have to re-adjust your search terms to match LEQL.
Stackify
Stackify offers a combined tool for log management along with error tracking and monitoring, built for developers to help them get a better overview of their applications. Of course, the tool includes a clear dashboard to know in a glance what’s going on inside the application.
It comes with an API that supports .NET, Java, PHP, Node.js, and Ruby, that collects all of your log messages and lets you view them along with contextual information. You can also use the REST API to build a custom library for other languages.
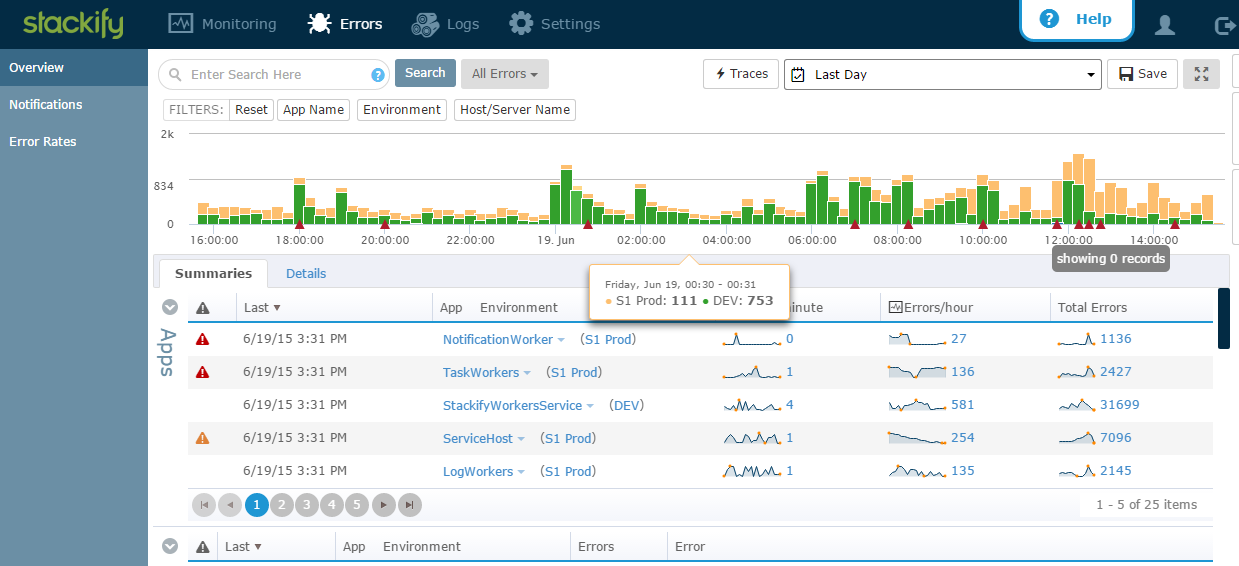
Dashboard and features
The dashboard collects and displays data from every exception across applications and environments, that includes the type of each error, where it was thrown and when it happened. You can apply filters to see error trends, view individual error instances with a count of occurrences or any other option that suits your needs.
There’s also a second dashboard that focuses on logs, which aggregates logs from across your applications. You can search across different servers, applications and environments to find certain events that need attention, or jump to a specific point at time to see the relevant logs.
Integrations
JIRA, Slack, TFS (Windows Team Foundation Server), Microsoft Azure.
Pricing
Stackify has a few products that include full monitoring and handling of applications. However, since we focus on log management tools, we’ve checked out the pricing for the standalone Errors & Logs tool.
The price starts at $15/month and it includes the errors and logs API without an agent, with up to 1,000 errors/logs per minute and 30 day retention.
Bottom line: There’s an option to purchase just the errors and logs tool, most of the value comes from the ability to use both tools together. So keep this in mind while evaluating this tool.
Sumo Logic
Sumo Logic is a full blown searching, analysing and monitoring SaaS log management tool, that is enterprise-focused. It focuses on reducing log events into groups of patterns, identifying anomalies and helping you detect when something’s not quite right in the code.
On the official website, Sumo Logic aggregated Github projects that are relevant to its tool. It has a Log4J 2 appender that sends data to Sumo Logic, Python collector management script, Fluentd plugin for Ruby users and additional tools for other languages.
Dashboard and features
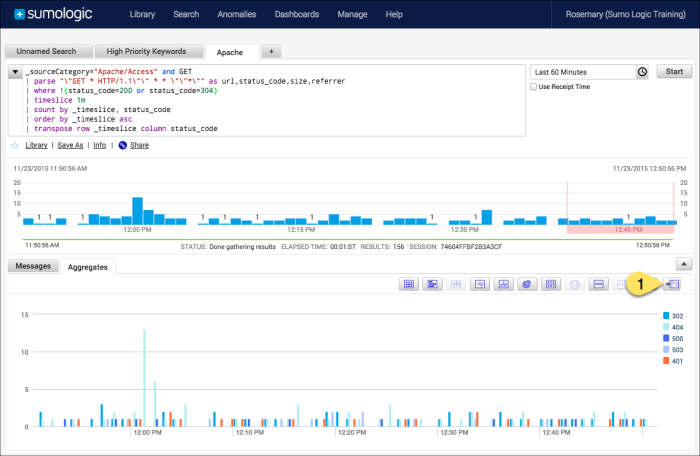
Sumo logic has 2 dashboards: Live dashboards and Interactive dashboards.
The live dashboard offers real-time data as soon as it’s logged by your system. It displays new data as it comes, but it doesn’t offer an option to look back on earlier events. That’s why you also have the interactive dashboard, that offers a full overview of events, trends and anything that happened up until now.
You can view the various events as graphs and identify spikes or irregular events that happened in the application. You can search for specific errors or exceptions you’d like to focus on, and generate them as a new view for future checks.
Integrations
PagerDuty, Slack, HipChat, Chef, MongoDB.
Pricing
The free version is available for up to 3 users, has a capacity of 500MB/day and offers 7 day data retention. The professional offer will cost you $90/month for 1GB/day and 30 day data retention, and the enterprise pricing plan starts at $150/month for 1GB/day, without limitation of users and multi-year data retention.
Bottom line: Since Sumo Logic is focused on enterprises it might be an overkill for what you’re looking for, so it’s worth checking out the full feature list during your free 30 day professional trial.
Graylog
Unlike the other tools on this list, Graylog is an open source log analyzer. You can parse logs from any data source, and view all of the data in a single dashboard.
There are a number of ways in which you can install Graylog, and it depends on MongoDB and Elasticsearch to operate.
Dashboard and features
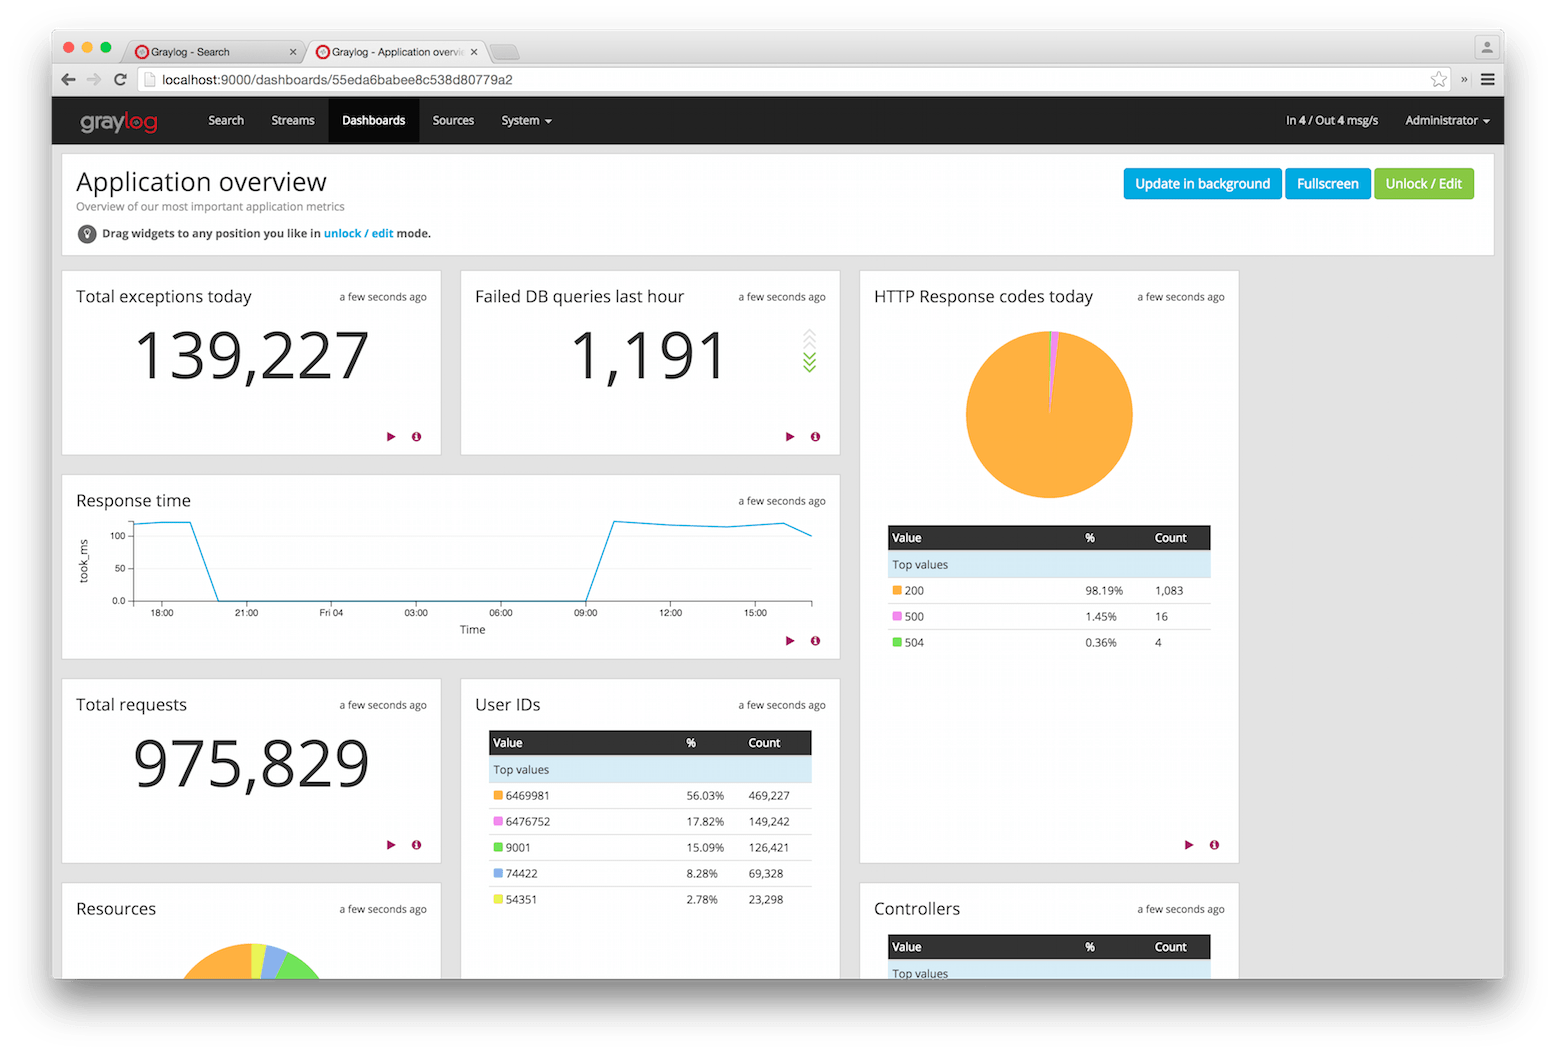
Graylog’s dashboard is composed of widgets, each made to give the needed information you’re looking for. You can add search value counts, histogram charts, or see stacked charts and create custom views to share with team members.
You can search through the events to find specific errors or exceptions, and add the search results to the dashboard. Among the different view options you’ll be able to see the number of events that occurred in a certain app, or on a certain day and any other metric that you might be interested in.
Integrations
Slack, Redis, PagerDuty, HipChat, Splunk.
Pricing
The tool is open source, so you can use it as you wish for free. In addition, Graylog offers enterprise licensing that cost around $1,500 per graylog-server instance in your Graylog cluster, that comes with a commercial support contract.
Bottom line: Open source tool might be the answer for you, but it will require some work on your end setting it up.
Hosted ELK
Hosting the ELK stack on your own can result in lots overhead for you and your team. To overcome that, you might want to check out some of the hosted ELK tools in the market. You’ll be able to get the same insights and data from structured and unstructured sources, letting the 3rd party tool do all the “heavy lifting” and configurations.
There are a number of tools in this market, such as Logsene by Sematext, Logz.io, FacetFlow and others. If you’re still not sure about moving to hosted ELK, we have a post that will help make a decision. Check it out.
Making logs better
We all know a log, is a log, is a log. It doesn’t matter if you consume it through Splunk, ElasticSearch, or through your notepad.
There’s a long list of log management tools, each made to help you read your log better, but most tools are based on the fact that the information you’re looking for is both easy to reach and actually in the log file. In most cases, the variables that you need in order to understand what happened weren’t even logged.
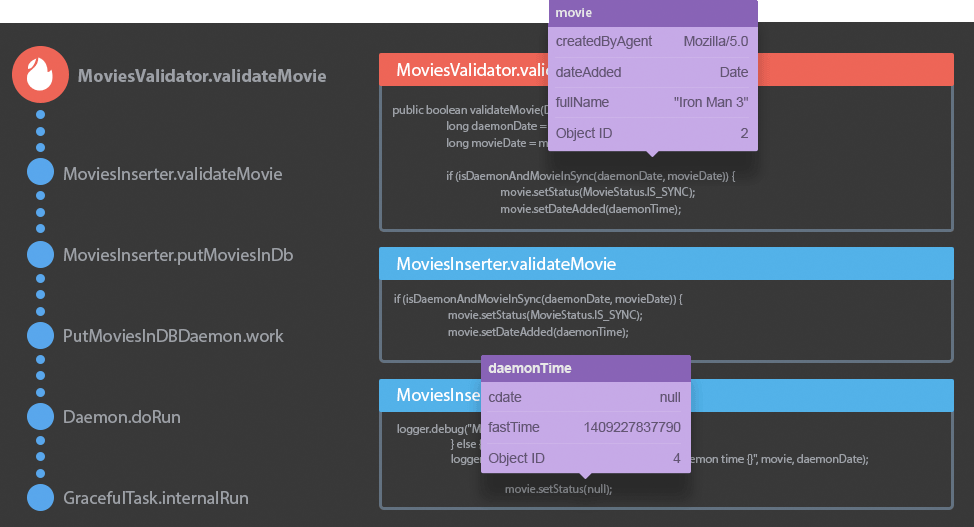
With OverOps you can see the complete source code and variable state across the entire call stack. Every parameter and every variable that were passed into a transaction or workflow that caused it to fail.
OverOps can work with your existing log management tool, making it better. It injects a hyperlink into the error or exception in the log, and clicking on it takes you directly into the error’s analysis.
That way, you enjoy maximum visibility and productivity, along with the set of capabilities you’ve learned to use and love in your existing tool. Check it out and get a free 14 day pro-trial.
Final thoughts
While each company has its own unique small features, all log management tools offer pretty much the same bundle: aggregate logs in one place, follow up on errors and exceptions and see everything in a nice dashboard. That’s why the search for the right tool is extremely hard, and you have to take a deep dive to understand the benefits of one tool or the other.
If you ask us, our approach is “try everything and see what fits you”. All of these tools offer a trial period in which you’ll be able to see if it’s what you’re looking for, or if you should keep looking for the right one.
| Reference: | How to Choose the Right Log Management Tool? from our JCG partner Henn Idan at the OverOps blog. |
