The Complete Guide to Instrumentation: How to Measure Everything You Need Inside Your Application
What’s instrumentation and why do you need it in your application?
The hard work never ends, and even after we’ve shipped our application to the anticipating users, there’s still a lot to do. Now we need to see how our application handles the real world, and make sure the users are happy with it. Enter instrumentation.
In the following post, we’ll go over what instrumentation actually means, and the various options and tools that can help you implement it as part of your application. Let’s go.
Where Ops and Dev meet
Instrumentation is one of the key attributes of the DevOps movement and it seems that everyone keeps using that word, but what does it actually mean?
The dictionary definition of instrumentation is the ability to monitor and measure performance, detect errors, and get trace information that represents the application’s state. It’s pretty accurate in terms of the DevOps world, monitoring and understanding the status and health of the application.
DevOps holds a complex monitoring world behind it which includes injecting code to monitor it up close, finding the right tools, and using dashboards to create the full view that’ll help us understand what’s going on “under the hood”.
That’s why instrumentation is a big deal. It will help you gain insight about your application before it goes haywire on you and your users. You need to know what’s going on in your application, and you need to know it where and when it happens. So, how do you take the first steps in order to instrument your application?
Getting our instrumentation on
A couple of months ago at Monitorama 2016, James Fryman, Infrastructure Product Owner at Auth0, presented a way to overcome the obstacles associated with implementing instrumentation.
In his talk, Fryman presents the DevOps version of Maslow’s hierarchy of needs. The base of the hierarchy is culture, which mean that first of all you have to be ready to learn, fail, experiment, integrate, and build tools that will help you and your application.
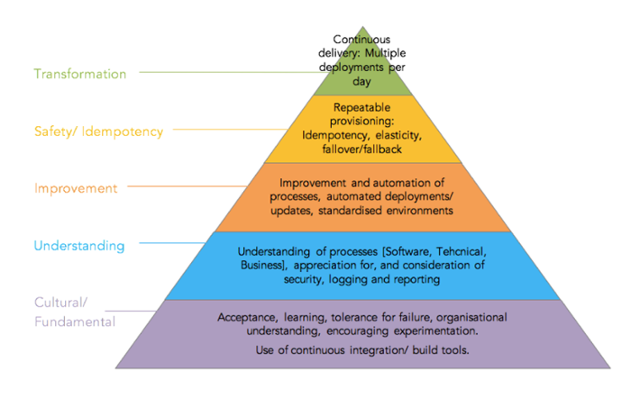
Only after you know what it is that you want to measure and how you’re planning to do it can you start understanding the processes of the application. You will also need to understand the processes of the technical and business sides involved in it.
Once we’ve identified our weak spots, it’s time to improve them. This is where instrumentation kicks in with classes, tools, and overall measurement of everything that’s important for us. It’s important to identify what might cause a bottleneck at a certain point, and how to give a better overall experience for us and for our users.
The next step covers the idea that the same action should have the same results. Predictability. We need to make sure everything is up and running as it should in order to be certain the application works for our end users.
After a few iterations of the improvement and idempotency steps in the pyramid, we want to be sure that our transformation works, and we can assure CD (continuous deployment). Fryman notes that everyone is racing to get there as soon as possible, which leads to skipping a few steps along the pyramid.
However it’s important to go through every step and solve every “need” if we want a release cycles that gives the users what they want, instead of one that patch previous mishaps.
Instrumenting code and logs
Monitoring the code
Most people prefer using tools in order to implement instrumentation, but it’s not the only approach available. If you’re looking for something a little more DIY and hands on messing with the code, Java lets you add services that monitor the code itself. You can do it through the public interface Instrumentation class.
It offers 2 ways to obtain an instance of Instrumentation interface:
1. When a JVM is launched in a way that indicates an agent class. In that case an Instrumentation instance is passed to the premain method of the agent class.
2. When a JVM provides a mechanism to start agents sometime after the JVM is launched. In that case an Instrumentation instance is passed to the agentmain method of the agent code.
Once the Java agent gets the Instrumentation instance, it may call methods on the instance at any time. We can use the methods available to measure and print the time of execution, return an array of all classes currently loaded by the JVM, and other nice options.
There are 2 kinds of agents – Java and Native. Both are loaded into the JVM in a similar manner (JVM startup argument), but are different in how they’re built and what they actually do. If you want to learn about the differences between them, you can check out our comparison post.
In most cases, we prefer letting a commercial tool handle the agents for us. That’s where APMs comes in. If you’re looking for popular APM tools, you can check out our comparison between AppDynamics vs Dynatrace, or AppDynamics vs New Relic.
Daemons
Another smart way to collect data from our application is through daemons, which are basically processes that run in the background and collect data from application or the underlying system. Daemons can help us get a better view of the application state and health.
Daemons are based on 4 key architectural points: the source of the information, how it reaches you, where the data will be stored, and how you can actually view what’s going on.
Some daemons ask you to specify what it is you want to monitor inside your application, while others gets the information for you, in case you’re not sure what it is you should be collecting.
Looking at one of the most popular daemons out there StatsD, a simple Node.js application helps the team transmit data points about their network, machine, and application and turn that information into graphs for a better overview of what’s going on.
There are other daemons for you to choose from, each with a list of pros and cons. If you’re not sure which one is right for you, check out our StatsD vs collectd vs fluentd post, that also include some other daemons you should know.
Log Management
We all know that going through logs is like finding a needle in a log-stack due to the amount of information they often contain, but it’s not always easy to know exactly what happened. That’s why log management tools are here for the rescue.
Instead of going through GBs and TBs of log files, these tools give you a better view of the data, and a better way to search through it. There are a lot of players in this field and it might be hard to know which one is right for you.
To help you know who’s against who, we’ve gathered a list of the 7 log management tools for Java developers, that you can read right here. We’ve also compared 2 of the biggest tools in the market, Splunk vs ELK, along with a comparison between some other players Splunk, Sumo Logic and Logstash.
However, if you’re looking for something that gives more context than log management tools, you might want to try out OverOps. OverOps captures code and variable data from errors and exceptions thrown in production, meaning that you can know when and where your code breaks, without sifting through log files. Check it out.
What about the pushback?
In his talk, Fryman mentions the pushback you might come across when pitching instrumentation to your team. In most cases it’s something that have been tried before, but for a very short period of time that didn’t give any usable feedback.
The most important part here is iteration. Instrumentation incorporates taking small and focused steps, learning from the information we’ve got, and implementing it in the next cycle. Even if it’s a little improvement or just a small amount of data, it can be a big deal in the long run.
Change is difficult and often we prefer to avoid changing what seems to be working which is why Fryman recommends getting all the developers on board and in sync. They can be a good source of feedback and will help building a better instrumentation wordflow.
Final thoughts
Instrumentation is about measuring everything we need and want inside the application, but it doesn’t mean we have to actually measure everything possible. We have to be smart about what and where our bottlenecks might be and focus on what’s important to understand if it’s working as it should.
Changing a workflow we’ve grown accustomed to is a tough job, but it’s necessary for giving the end users a better application and a better experience.
Along with these tools, we’ve also gathered a list of 15 tools you should use after a major release, that focus on logging, performance monitoring, alerting and tracking, and debugging in production.
| Reference: | The Complete Guide to Instrumentation: How to Measure Everything You Need Inside Your Application from our JCG partner Iris Shoor at the OverOps blog. |
