What are some of the most popular daemons and what can they do?
Monitoring is key element in every system, and while our users are a great indicator regarding what’s going on the system, we should be able to give them the best and smooth experience possible. That’s when daemons come in handy, collecting every piece of data we might need, or some that we didn’t even think of.
In the following post we’ll explain why these daemons are so important, and what are the various options we can choose from. Check it out.
Meet the daemons
A collector daemon is a process that runs in the background, collecting data from your system. These daemons usually end with the letter D to distinguish them from the other processes running on your system.
It might sound simple when we put it like that, but it’s anything but that. These daemons are usually part of a more complex architecture, based on these 4 key points:
- Source – Where is the information is coming from
- Transport – How will this information reach you
- Storage – Where will this data be stored
- View – How will you actually see what’s going on in your system
Each daemon has its own pros and cons, that focus around these values, and there’s a long list of daemons with followers that try to make us choose one over the other. We decided to focus on some of the most popular daemons to help you get a better sense of what their value.
StatsD
StatsD is a simple Node.js application, originally built by the engineering team at Etsy. It was made in order to help the team transmit data points about their network, machine and application and turn that information into graphs.
This gives the engineers a better overview on what’s going on, while offering the same information to others inside the company.
Nowadays, it’s one of the most popular daemons to collect and sum up application metrics. That’s due to the simple way it works. All we have to do is tell it what new metrics we’d like to create by sending the relevant data, and wait for that information to flow through a UDP port. The StatsD server supports a number of different data types, and the three main types are counters, timers, and gauges.
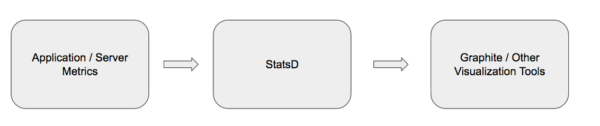
Now that we have the metrics, it’s time to actually view them. StatsD was built for Graphite, meaning it parses messages and extracts metrics directly to them. However, it plays nicely with other visualization and metrics tools as well.
Architecture View:
Who uses it?
A lot of well known names are using StatsD, from KickStarter through Lyft, Misfit, AutoCAD, Dollar Shave Club and many more.
collectd
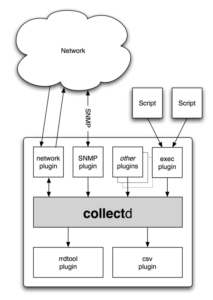
collectd is written in C, allowing it to run on systems without a scripting language or a cron daemon, such as embedded systems. It collects, transfers and stores system performance statistics, with data acquisition and storage handled by plugins.
Plugins are the focal point in collectd, since almost everything in it is done by them. The current list contains over 90 plugins that range from standard cases to low level, specialized and advanced topics.
You can find some interesting plugins here, such as a Battery plugin, that collects its charge, drawn current and voltage, or an Apple Sensors plugin that reads system temperatures and fan speeds from Apple computers.
And of course, a StatsD plugin. You can connect the two and use it to report different events, while aggregating them using collectd. This will come in handy since collectd is not a monitoring solution, and right now the only option you have is simple threshold checking. Another major downside – you can’t generate graphs.
The configuration is super easy, and all you have to do is choose which modules to load. You don’t have to set up anything else, but you can tailor the daemon as you wish.
Architecture View:
Who uses it?
BBC is collecting statistics from 200+ servers using collectd, and neoTactics use it in their cloud management framework.
fluentd
fluentd is a little different from the previous daemons we mentioned, since it’s considered more of a logging tool. That’s why it usually up against Logstash and other logging tools (and not daemons).
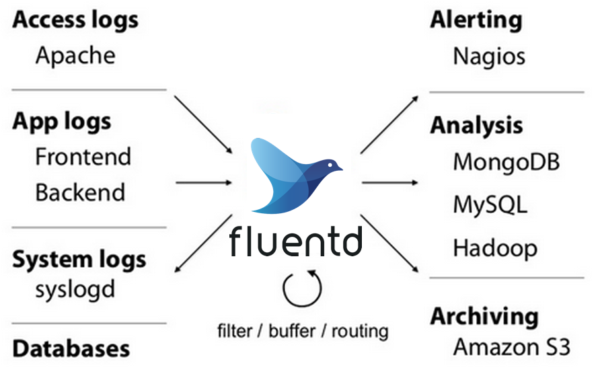
fluentd is a data collecting daemon made to help you collect data directly from your logs and databases. To be even more specific, you can use it to analyze event logs, application logs, and clickstreams (a series of mouse clicks).
fluentd itself is written in a combination of C language and Ruby, and was build by Treasure Data. According to its official website, one of the co-founders in Treasure Data found that a lot of data was not used effectively, and developed fluentd as a solution to reliably collect it.
This is why you’ll find a “log everything” attitude in this daemon, with a main goal of providing a unified logging layer between the data sources and the backend. fluentd structure data as JSON, which allows unifying collecting, filtering, buffering, and outputting logs across multiple sources and destinations (Unified Logging Layer).
Plugins are a major issue here as well, and has a wide range of over 300 community-contributed plugins. They are filtered by category, with unique plugins for AWS, Big Data, Google Cloud, IoT and many other options.
Speaking of logging, in case you’re looking for the complete logging tool that’s right for you, you should check out our Log Management Tools Face-Off.
Architecture View:
Who uses it?
DeNA, GREE, SlideShare and even Nintendo that uses fluentd to collect massive data logs for their platforms.
Don’t forget about these
We’ve mentioned just a few players that are trending in the daemon field:
There are some other names you should know as well, such as:
systemd – The daemon of all daemons. It’s the default init system in most Linux distributions, used to manage all daemons processes running. The main goal is unifying basic Linux configurations and service behaviors across all distributions.
crond – A daemon to execute scheduled commands. It schedule time-based jobs, and is automatically installed on most Linux distributions.
ntpd – The Network Time Protocol daemon (ntpd) is your best friend in synchronizing your system with time servers. It makes sure all clocks will sync, and we don’t have to tell you how important that is.
supervisord – A daemon that monitors and control a few processes on UNIX-like operating systems, letting you restarts them if/when they crash.
takipi-service – A daemon that reports metrics collected by a native Java agent. The agent monitors servers for exceptions and logged errors, with the exact variable state that caused them.
Final thoughts
There are a lot of daemons to choose from, and some of them even overlap in certain areas. Of course you don’t have to restrict yourself to just one, especially if you’ll see value from using a few of these daemons together.
Do you have any other daemons you’re using? We’d love to hear about them in the comments below.
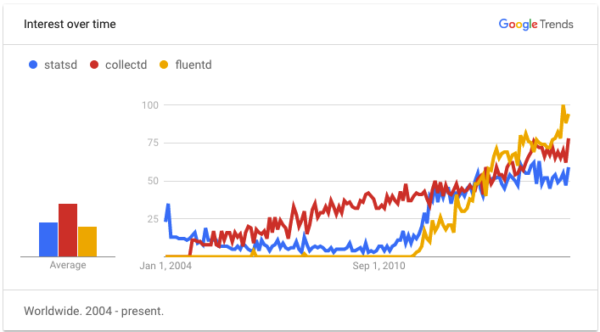
| Reference: | StatsD vs collectd vs fluentd and Other Daemons You Should Know from our JCG partner Henn Idan at the Takipi blog. |
