Heron has been Open Sourced, woo! Heron is Twitter’s distributed stream computation system for running Apache Storm compatible topologies in production.
A Heron topology is a directed acyclic graph used to process streams of data. Heron topologies consist of three basic components: spouts and bolts, which are connected via streams of tuples. Below is a visual illustration of a simple topology:
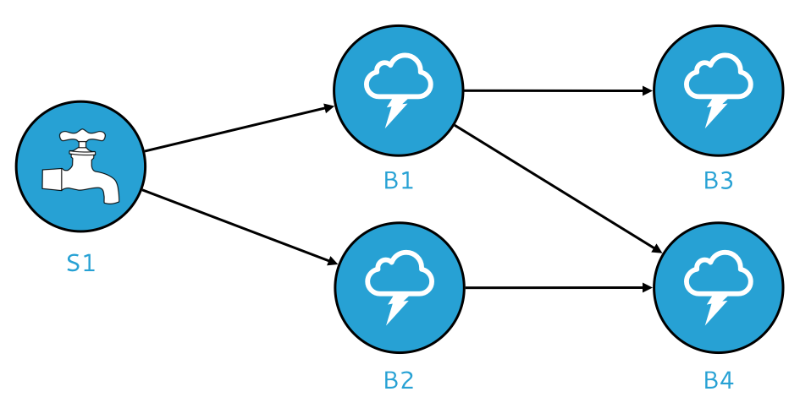
Spouts are responsible for emitting tuples into the topology, while bolts are responsible for processing those tuples. In the diagram above, spout S1 feeds tuples to bolts B1 and B2 for processing; in turn, bolt B1 feeds processed tuples to bolts B3 and B4, while bolt B2 feeds processed tuples to bolt B4.
This is just a simple example; you can use bolts and spouts to form arbitrarily complex topologies.
Topology Lifecycle
Once you’ve set up a Heron cluster, you can use Heron’s CLI tool to manage the entire lifecycle of a topology, which typically goes through the following stages:
- submit the topology to the cluster. The topology is not yet processing streams but is ready to be activated.
- activate the topology. The topology will begin processing streams in accordance with the topology architecture that you’ve created.
- restart an active topology if, for example, you need update the topology configuration.
- deactivate the topology. Once deactivated, the topology will stop processing but remain running in the cluster.
- kill a topology to completely remove it from the cluster. It is no longer known to the Heron cluster and can no longer be activated. Once killed, the only way to run that topology is to re-submit it.
Spouts
A Heron spout is a source of streams, responsible for emitting tuples into the topology. A spout may, for example, read data from a Kestrel queue or read tweets from the Twitter API and emit tuples to one or more bolts. Information on building spouts can be found in Building Spouts.
Bolts
A Heron bolt consumes streams of tuples emitted by spouts and performs some set of user-defined processing operations on those tuples, which may include performing complex stream transformations, performing storage operations, aggregating multiple streams into one, emitting tuples to other bolts within the topology, and much more. Information on building bolts can be found in Building Bolts.
Data Model
Heron has a fundamentally tuple-driven data model. You can find more information in Heron’s Data Model.
Logical Plan
A topology’s logical plan is analagous to a database query plan.
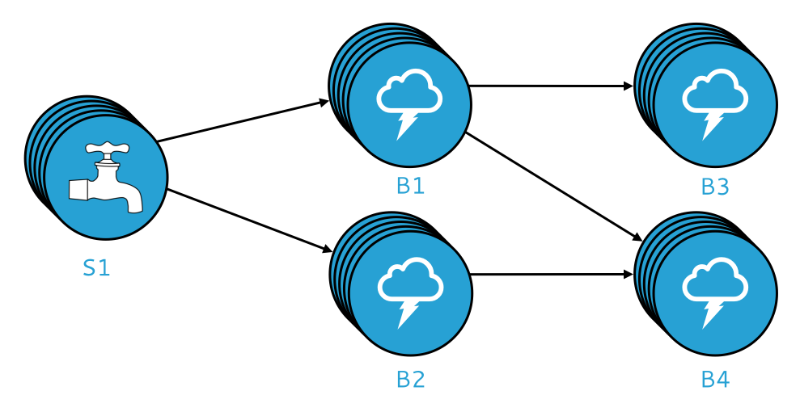
Physical Plan
A topology’s physical plan is related to its logical plan but with the crucial difference that a physical plan maps the actual execution logic of a topology, including the machines running each spout or bolt and more. Here’s a rough visual representation of a physical plan:
If you want to get your toes wet first give the local cluster a shot http://twitter.github.io/heron/docs/getting-started/.
If your ready for waste deep then lets get Heron running on Mesos with Kafka!!!
git clone https://github.com/elodina/heron.git
cd heron
git checkout -b v2 origin/v2
./build-ubuntu.sh #requires Docker
./setup-cli-ubuntu.sh #setup cli and re-pack core package
# start vagrant image, requires Vagrant & Virtualbox
cd contrib/kafka9/vagrant
vagrant up
#ssh to vagrant and start a 0.9 broker, note broker endpoint address
vagrant ssh master
mkdir -p /vagrant/dist/topologies
wget -P /vagrant/dist/topologies/ https://s3.amazonaws.com/repo.elodina/kafka-09-mirror_deploy.jar
./setup-brokers.sh 0 1 #uses Mesos Kafka Scheduler
# start a topology using the script which uses heron cli under the hood:
./submit-09-topology-mesos.sh topologyname slave0:5000 foo bar
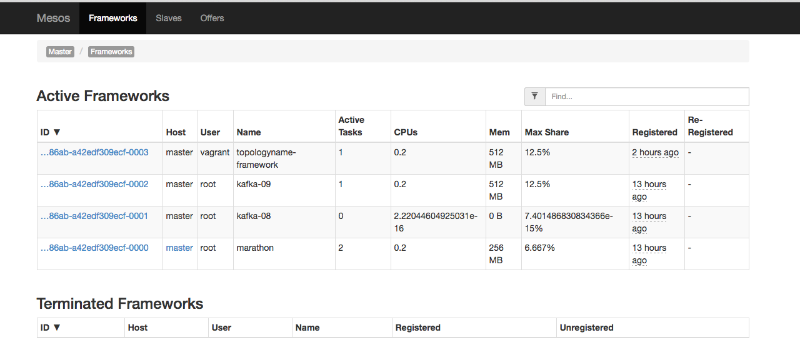
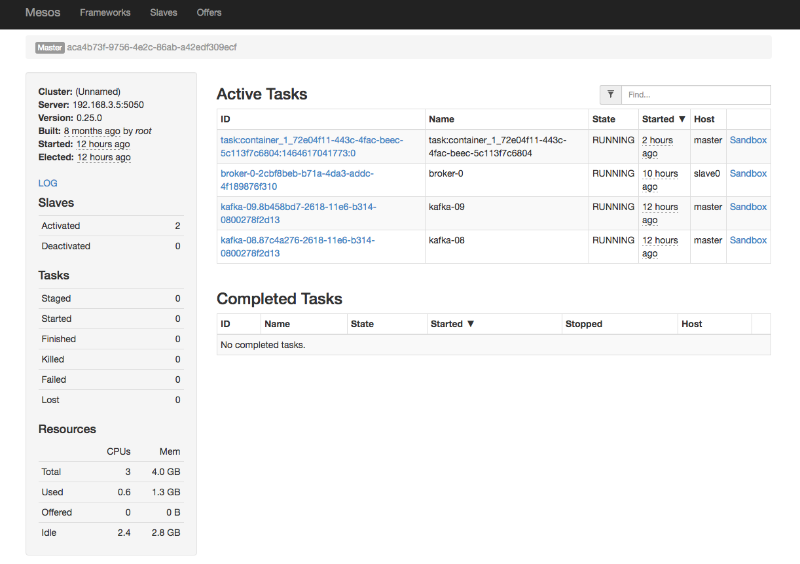
At this point you can navigate to the Mesos UI http://192.168.3.5:5050/#/ and see things working. Every topology is a Mesos Framework.
Tasks on the cluster
Start Heron Tracker
The Heron Tracker is a web service that continuously gathers information about your Heron cluster. You can launch the tracker by running the command (which is already installed if you started with your getting your toes wet, else ). You need to update the statemanager for your heron_tracker.yaml like so.
statemgrs:
–
type: “zookeeper”
name: “zk”
host: “192.168.3.5”
port: 2181
rootpath: “/heron”
tunnelhost: “localhost”
You can reach Heron Tracker in your browser at http://localhost:8888
Start Heron UI
Heron UI is a user interface that uses Heron Tracker to provide detailed visual representations of your Heron topologies. To launch Heron UI:
You can open Heron UI in your browser at http://localhost:8889.
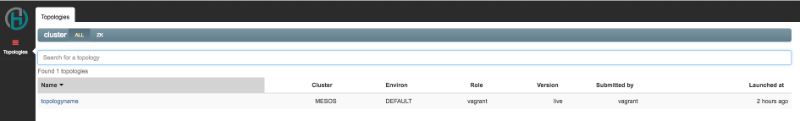
click “topologyname” or what you called it when running submit above.
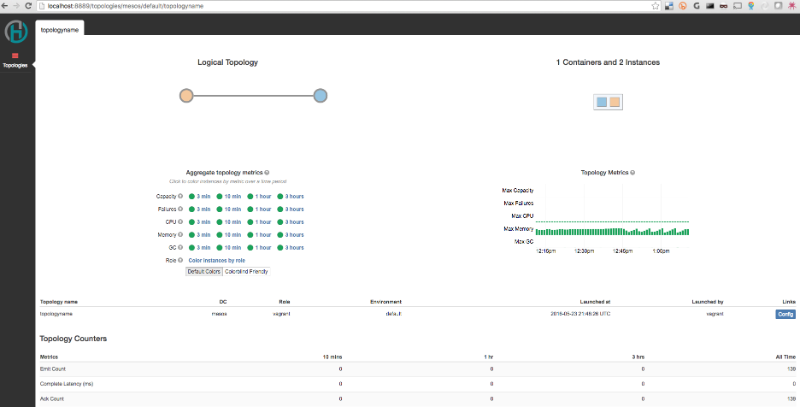
The Heron UI provides a lot of information about a topology or a part of it quickly, thus reducing debugging time considerably. Some of these features are listed below. A complete set of features can be found in following sections.
- See logical plan of a topology
- See physical plan of a topology
- Configs of a topology
- See some basic metrics for each of the instances and components
- Links to get logs, memory histogram, jstack, heapdump and exceptions of a particular instance
Now onto the Apache Kafka Spout & Bolt & Example topology which mirrors data from one topic to another (foo to bar or whatever set as the params above). Here is how to build and work on the topology yourself.
#back in github.com/elodina/heron directory
git checkout -b kafka_spout origin/kafka_spout
wget -q ‘https://github.com/bazelbuild/bazel/releases/download/0.1.2/bazel-0.1.2-installer-linux-x86_64.sh’
chmod +x bazel-0.1.2-installer-linux-x86_64.sh
./bazel-0.1.2-installer-linux-x86_64.sh –user
./bazel_configure.py
~/bin/bazel build –config=ubuntu //contrib/kafka/examples/src/java:all-targets
cp ./bazel-bin/contrib/kafka/examples/src/java/kafka-09-mirror_deploy.jar /vagrant/dist/topologies/
How is Heron different than Apache Storm?
- The provisioning of resources is abstracted from the duties of the cluster manager so that Heron can play nice with the rest of the shared infrastructure.
- Each Heron Instance executes only a single task so is easy to debug.
- The design makes transparent which component of the topology is failing or slowing down as the metrics collection is granular and can easily map an issue to a specific process in the system.
- Heron allows a topology writer to specify exactly the resources for each component, avoiding over-provisioning.
- Having a Topology Manager per topology enables them to be managed independently and failure of one topology does not affect the others.
- The backpressure mechanism gives a consistent rate of delivering results and a way to reason about the system. It is also a key mechanism that supports migration of topologies from one set of containers to another.
- It does not have any single point of failure.
Some benchmarks from @manuzhang
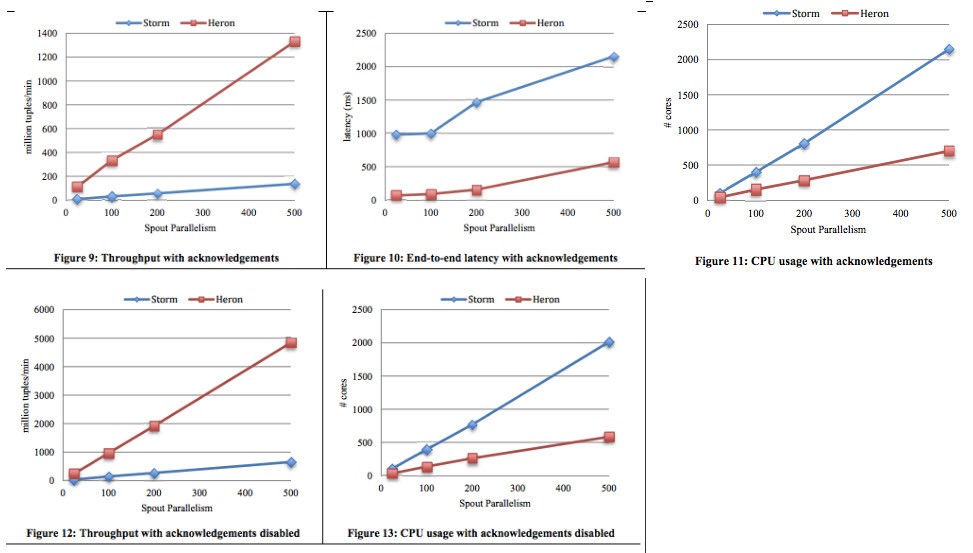
More good stuff like this from the Heron paper if you haven’t already read it.
There are also more ways to run Heron besides Native Mesos Framework. Heron supports deployment on Apache Aurora out of the box as well as for Slurm too. Apache REEF and others are in the works and looking forward to the future of topology driven as a service solutions for the enterprise.
| Reference: | Getting Started with Heron on Apache Mesos and Apache Kafka from our JCG partner Joe Stein at the All Things Hadoop blog. |
