There are multiple ways to monitor Docker containers. This blog will explain a few simple and easy to use options:
Lets take a look at each one of them.
We’ll use a Couchbase server to gather the monitoring data.
Lets start the server as:
docker run -d -p 8091-8093:8091-8093 -p 11210:11210 --name couchbase arungupta/couchbase
arungupta/couchbase image is explained at github.com/arun-gupta/docker-images/tree/master/couchbase. It performs:
- Sets up memory for Index and Data service
- Configures the Couchbase server for Index, Data, and Query service
- Sets up username and password credentials
Now lets gather monitoring data.
docker stats
docker stats display a live stream of the following container(s) resource usage statistics:
- CPU % usage
- Memory usage, limit, % usage
- Network i/o
- Disk i/o
The stats are updated every second.
Here is a sample output:
CONTAINER           CPU %               MEM USAGE / LIMIT     MEM %               NET I/O               BLOCK I/O
4827f0139b1f        10.94%              706.2 MB / 1.045 GB   67.61%              299.7 kB / 2.473 MB   456 MB / 327.3 MB
By default, this command display statistics for all the running containers. A list of container names or ids can be specified, separated by a space, to restrict the stream to a subset of running containers.
For example, stats for only the Couchbase container can be seen as:
docker stats couchbase
where couchbase is the container name.
And the output looks like:
CONTAINER           CPU %               MEM USAGE / LIMIT     MEM %               NET I/O             BLOCK I/O
couchbase           12.50%              708.2 MB / 1.045 GB   67.80%              301 kB / 2.477 MB   456 MB / 327.6 MB
--no-stream option can be specified where only the first snapshot is displayed and results are not streamed.
The Docker Logentries Container can be used to collect this data.
Docker Remote API
Docker daemon provides a Remote REST API. This API is used by the Client to communicate with the engine. This API can be also be invoked by by other tools, such as curl or Chrome Postman REST Client. If you are creating Docker daemons using Docker Machine on OSX Mavericks, then getting this API to work is a bit tricky.
If you are on Mac, follow the instructions in Enable Docker Remote API to ensure curl can invoke this REST API.
The API that provide stats about the container is /containers/{id}/stats or /containers/{name}/stats.
Then more stats about the container can be obtained as:
~ > curl https://192.168.99.100:2376/containers/42d1414883af/stats --cert $DOCKER_CERT_PATH/cert2.p12 --pass mypass --key $DOCKER_CERT_PATH/key.pem --cacert $DOCKER_CERT_PATH/ca.pem
The following result (formatted) is shown:
{
    "read": "2016-02-07T13:26:56.142981314Z",
    "precpu_stats": {
        "cpu_usage": {
            "total_usage": 0,
            "percpu_usage": null,
            "usage_in_kernelmode": 0,
            "usage_in_usermode": 0
        },
        "system_cpu_usage": 0,
        "throttling_data": {
            "periods": 0,
            "throttled_periods": 0,
            "throttled_time": 0
        }
    },
    "cpu_stats": {
        "cpu_usage": {
            "total_usage": 242581854769,
            "percpu_usage": [242581854769],
            "usage_in_kernelmode": 33910000000,
            "usage_in_usermode": 123040000000
        },
        "system_cpu_usage": 3367860000000,
        "throttling_data": {
            "periods": 0,
            "throttled_periods": 0,
            "throttled_time": 0
        }
    },
    "memory_stats": {
        "usage": 693821440,
        "max_usage": 818733056,
        "stats": {
            "active_anon": 282038272,
            "active_file": 28938240,
            "cache": 82534400,
            "hierarchical_memory_limit": 9223372036854771712,
            "hierarchical_memsw_limit": 9223372036854771712,
            "inactive_anon": 329543680,
            "inactive_file": 53284864,
            "mapped_file": 26558464,
            "pgfault": 809513,
            "pgmajfault": 2559,
            "pgpgin": 1015608,
            "pgpgout": 940757,
            "rss": 611270656,
            "rss_huge": 136314880,
            "swap": 249049088,
            "total_active_anon": 282038272,
            "total_active_file": 28938240,
            "total_cache": 82534400,
            "total_inactive_anon": 329543680,
            "total_inactive_file": 53284864,
            "total_mapped_file": 26558464,
            "total_pgfault": 809513,
            "total_pgmajfault": 2559,
            "total_pgpgin": 1015608,
            "total_pgpgout": 940757,
            "total_rss": 611270656,
            "total_rss_huge": 136314880,
            "total_swap": 249049088,
            "total_unevictable": 0,
            "total_writeback": 0,
            "unevictable": 0,
            "writeback": 0
        },
        "failcnt": 0,
        "limit": 1044574208
    },
    "blkio_stats": {
        "io_service_bytes_recursive": [{
                "major": 8,
                "minor": 0,
                "op": "Read",
                "value": 301649920
            }, {
                "major": 8,
                "minor": 0,
                "op": "Write",
                "value": 248315904
            }, {
                "major": 8,
                "minor": 0,
                "op": "Sync",
                "value": 201003008
            }, {
                "major": 8,
                "minor": 0,
                "op": "Async",
                "value": 348962816
            }, {
                "major": 8,
                "minor": 0,
                "op": "Total",
                "value": 549965824
            }],
        "io_serviced_recursive": [{
                "major": 8,
                "minor": 0,
                "op": "Read",
                "value": 41771
            }, {
                "major": 8,
                "minor": 0,
                "op": "Write",
                "value": 72796
            }, {
                "major": 8,
                "minor": 0,
                "op": "Sync",
                "value": 61246
            }, {
                "major": 8,
                "minor": 0,
                "op": "Async",
                "value": 53321
            }, {
                "major": 8,
                "minor": 0,
                "op": "Total",
                "value": 114567
            }],
        "io_queue_recursive": [],
        "io_service_time_recursive": [],
        "io_wait_time_recursive": [],
        "io_merged_recursive": [],
        "io_time_recursive": [],
        "sectors_recursive": []
    },
    "pids_stats": {},
    "networks": {
        "eth0": {
            "rx_bytes": 40192,
            "rx_packets": 285,
            "rx_errors": 0,
            "rx_dropped": 0,
            "tx_bytes": 222138,
            "tx_packets": 150,
            "tx_errors": 0,
            "tx_dropped": 0
        }
    }
}
There is lot more details on memory, disk, and network. A new set of metrics are pushed every second.
cAdvisor
cAdvisor or Container Advisor provide host and container metrics. It is a running daemon that collects, aggregates, processes, and exports information about running containers.
Let’s start the cAdvisor container:
docker run -d --name=cadvisor -p 8080:8080 --volume=/var/run:/var/run:rw --volume=/sys:/sys:ro --volume=/var/lib/docker/:/var/lib/docker:ro google/cadvisor:latest
cAdvisor dashboard shows data for the last 60 seconds only. However multiple backends, such as Prometheus and InfluxDB, are supported that allows long term storage, retrieval and analysis.
Use Couchbase Query Tool to connect with the Couchbase Server:
~ > docker run -it --link couchbase:db arungupta/couchbase cbq --engine http://db:8093
Couchbase query shell connected to http://db:8093/ . Type Ctrl-D to exit.
cbq>
Invoke a N1QL query:
cbq> select * from `travel-sample` limit 1;
{
"requestID": "7af2d1b1-c37e-4c75-a913-cfaa99dcabdd",
"signature": {
"*": "*"
},
"results": [
{
"travel-sample": {
"callsign": "MILE-AIR",
"country": "United States",
"iata": "Q5",
"icao": "MLA",
"id": 10,
"name": "40-Mile Air",
"type": "airline"
}
}
],
"status": "success",
"metrics": {
"elapsedTime": "10.292951ms",
"executionTime": "10.232921ms",
"resultCount": 1,
"resultSize": 300
}
}
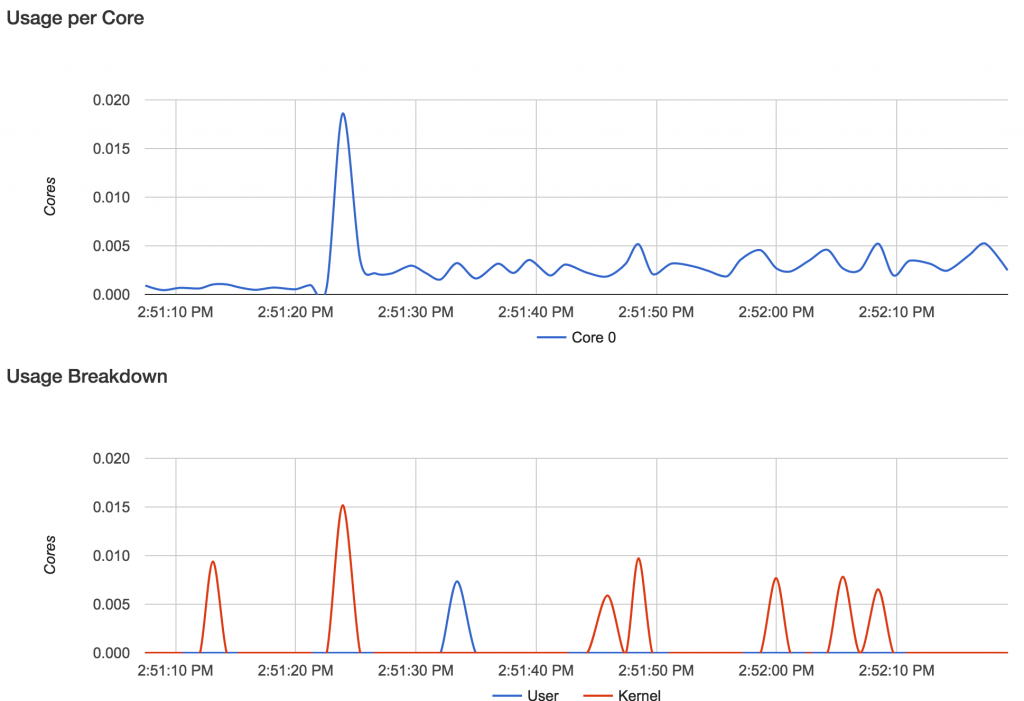
cAdvisor only store one minute of data and here is a capture of the dashboard:
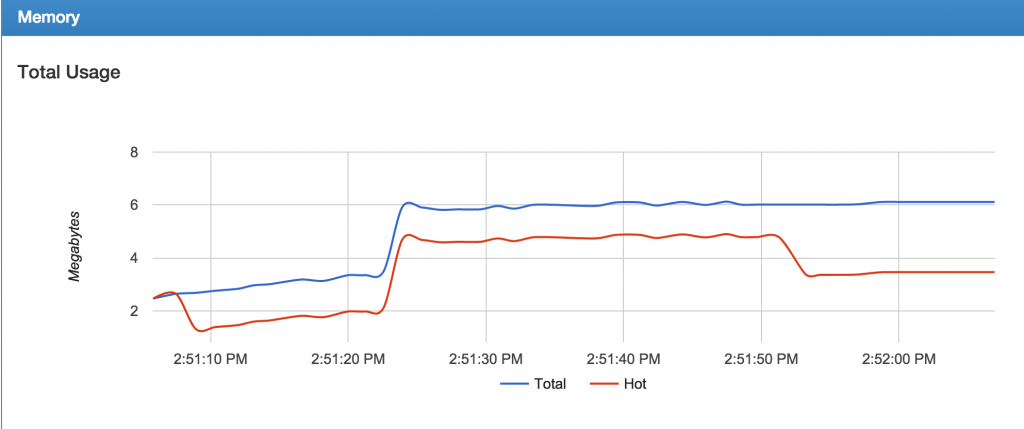
And memomy usage:
There are plenty of tools that can use the data generated by cAdvisor and show them in a nice dashboard.
More details are available at github.com/google/cadvisor/tree/master/docs.
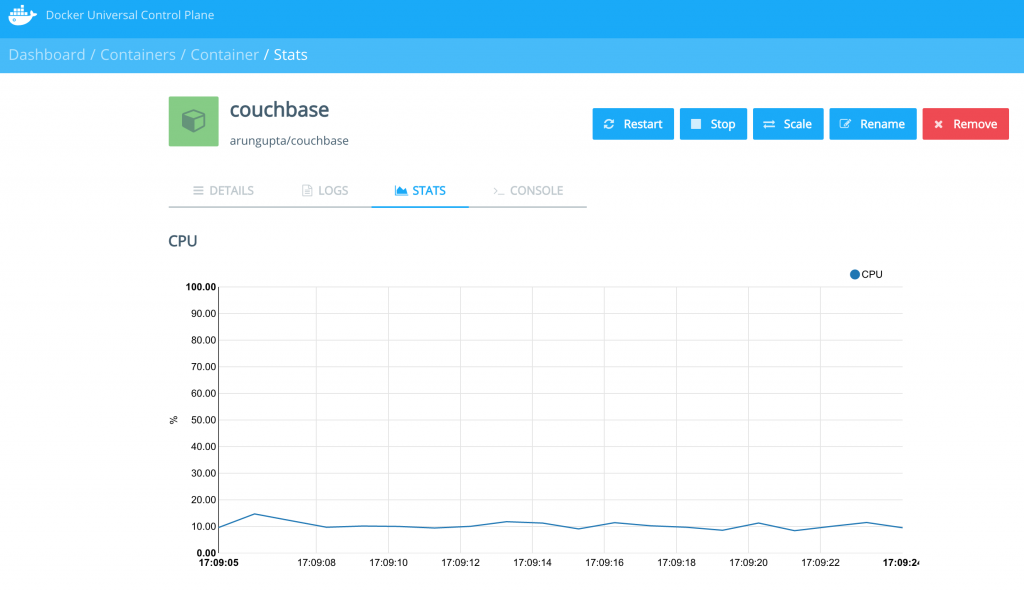
Docker Universal Control Plane
Docker Universal Control Plane (DUCP) allows to manage and deploy Dockerized distributed applications, all from within the firewall. It integrates with key systems like LDAP/AD to manage users and provides and interface for IT operations teams to deploy and manage. RBAC, SSO integration with Docker Trusted Registry, simple and easy to use web UI are some of the key features. Read product overview for complete set of features.
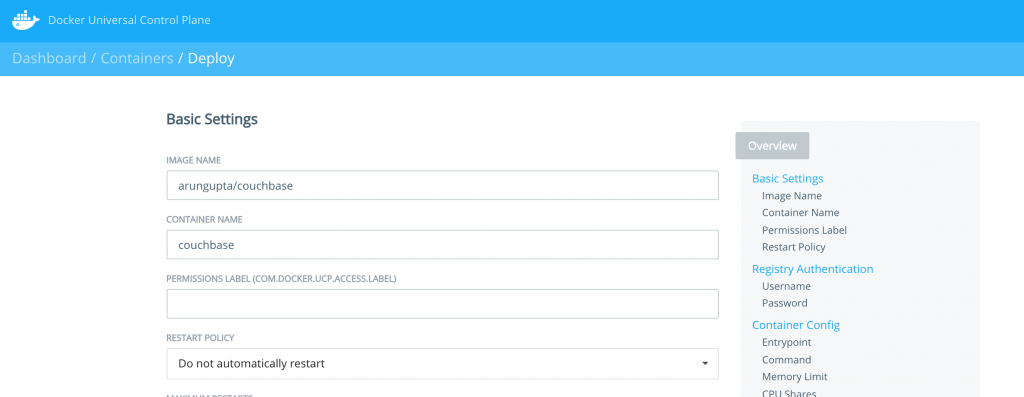
Docker Universal Control Plan with Docker Machine is the easiest way to experience this on your local machine. The instructions are very detailed and work out of the box. Here are some images after deploying a Couchbase image.
DUCP installation consists of an DUCP controller and one or more hosts. These are configured in a Docker Swarm cluster. And then containers are started on these clusters:
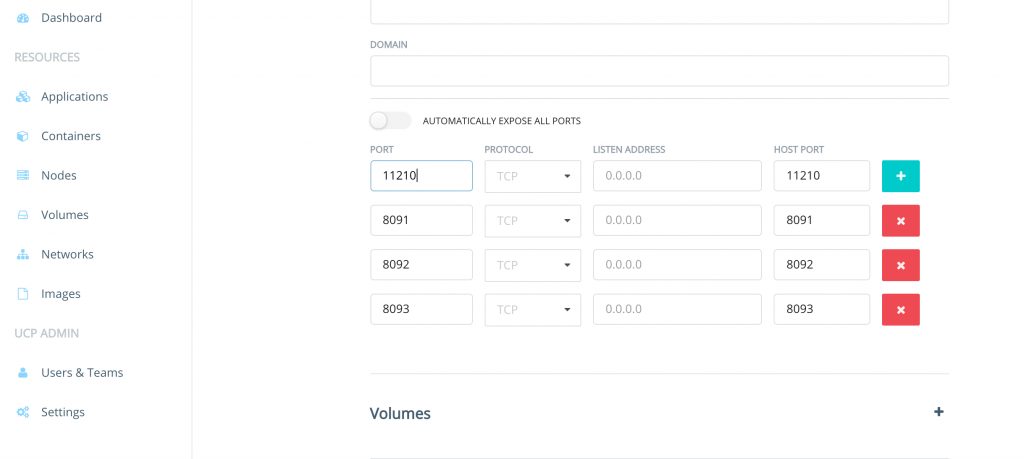
Port mapping is easily defined:
Once the container is running, monitoring stats can be seen:
And finally the pretty looking dashboard:
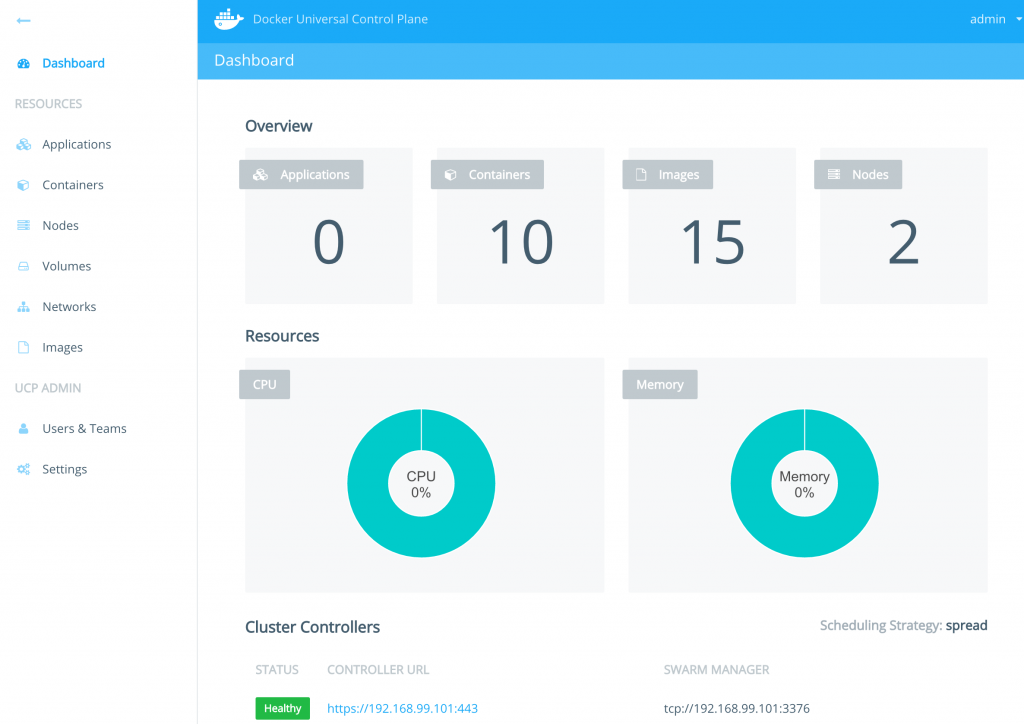
A client bundle is provided that shows the information about the Docker Swarm cluster as:
Containers: 10
 Running: 10
 Paused: 0
 Stopped: 0
Images: 15
Server Version: swarm/1.1.3
Role: primary
Strategy: spread
Filters: health, port, dependency, affinity, constraint
Nodes: 2
 node1: 192.168.99.101:12376
  └ Status: Healthy
  └ Containers: 7
  └ Reserved CPUs: 0 / 1
  └ Reserved Memory: 0 B / 2.004 GiB
  └ Labels: executiondriver=native-0.2, kernelversion=4.1.19-boot2docker, operatingsystem=Boot2Docker 1.10.3 (TCL 6.4.1); master : 625117e - Thu Mar 10 22:09:02 UTC 2016, provider=virtualbox, storagedriver=aufs
  └ Error: (none)
  └ UpdatedAt: 2016-04-09T00:12:53Z
 node2: 192.168.99.102:12376
  └ Status: Healthy
  └ Containers: 3
  └ Reserved CPUs: 0 / 1
  └ Reserved Memory: 0 B / 2.004 GiB
  └ Labels: executiondriver=native-0.2, kernelversion=4.1.19-boot2docker, operatingsystem=Boot2Docker 1.10.3 (TCL 6.4.1); master : 625117e - Thu Mar 10 22:09:02 UTC 2016, provider=virtualbox, storagedriver=aufs
  └ Error: (none)
  └ UpdatedAt: 2016-04-09T00:12:48Z
Cluster Managers: 1
 192.168.99.101: Healthy
  └ Orca Controller: https://192.168.99.101:443
  └ Swarm Manager: tcp://192.168.99.101:3376
  └ KV: etcd://192.168.99.101:12379
Plugins:
 Volume:
 Network:
Kernel Version: 4.1.19-boot2docker
Operating System: linux
Architecture: amd64
CPUs: 2
Total Memory: 4.008 GiB
Name: ucp-controller-node1
ID: 6LTO:GVZJ:2M6Z:DONM:ZAKR:2JIL:ZWJG:KY7R:G3EL:AS2Y:X22F:RXM3
Labels:
 com.docker.ucp.license_key=XXXXXXXXXXXXXXXXXXXXXXXX
 com.docker.ucp.license_max_engines=1
 com.docker.ucp.license_expires=XXXXXXXXXXXXXXXXXXXXXXXX
There are plenty of tools that provide monitoring data:
docker stats and Docker Remote API are certainly the easiest one to give you first snapshot of your monitoring data. And it only becomes interesting from there!
| Reference: | Monitoring Docker Containers – docker stats, cAdvisor, Universal Control Plane from our JCG partner Arun Gupta at the Miles to go 2.0 … blog. |
