This post descries how to connect Android smartphones to Ubidots so that smartphone reads data sent from Arduino. In the previous post we explored how to connect Arduino to Ubidots so that Arduino board with temperature and humidity sensor sends data to Ubidots. In this post, we will develop an Android app that uses Ubidots services to get the information sent by Arduino.
Moreover, Android app not only read data but display it using charts. To this purpose, the app uses MPAndroidChart library, an open source library to create charts in Android.
To develop the android app, it is necessary:
- Handle HTTP connection to make REST requests toward Ubidots server
- Handle JSON format to read data
- Use MPAndroidChart to create charts based on the data retrieved
Moreover, the android app will use Material design.The final result is shown below:
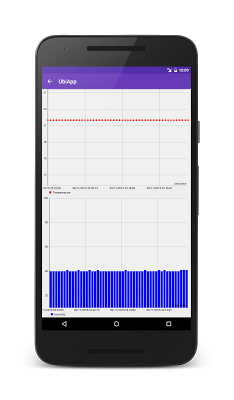
Ubidots Android client
Even if Ubidots provides a client to handle REST requests, it didn’t satisfy me so i prefer to develop a custom client based on OkHttp library. The class that handles the HTTP request is named UbidotsClient.
The client uses an authentication token to authenticate the app to exchange data and variable ids to select the variable to read. If you remember, we talked about these two items in the previous post.
The HTTP client is very easy:
OkHttpClient client = new OkHttpClient();
Request req = new Request.Builder().addHeader("X-Auth-Token", apiKey)
          .url("http://things.ubidots.com/api/v1.6/variables/" + varId + "/values")
          .build();

client.newCall(req).enqueue(new Callback() {
     @Override
     public void onFailure(Request request, IOException e) {
        Log.d("Chart", "Network error");
        e.printStackTrace();
     }

     @Override
     public void onResponse(Response response) throws IOException {
       // Here we handle the response
     }
}
At line 2, the Android app adds the authentication token to the HTTP request header.
At line 3, the app calls the service provided by Ubidots passing the variable id we want to read values.
Finally at line 5, the app makes the HTTP request and wait for the response. One interesting aspect of OkHTTP client is that it handles requests in a separate thread so we don’t have to worry about ANR problems.
Parsing Ubidots response in JSON
When the android app invokes a remote services using REST, as Ubidots services, it gets a JSON response that have to be parsed so that it is possible to extract information.
The Ubidots response is very easy and it is made by a JSON array and each item contains two values: the variable value itself and the timestamp.
Having in mind this information, the JSON parsing is very simple: in onResponse, or in other words when the response is available, the app parses the JSON:
@Override
public void onResponse(Response response) throws IOException {
    String body = response.body().string();
    Log.d("Chart", body);

    try {
        JSONObject jObj = new JSONObject(body);
        JSONArray jRes = jObj.getJSONArray("results");
        for (int i=0; i < jRes.length(); i++) {
            JSONObject obj = jRes.getJSONObject(i);
            Value val = new Value();
            val.timestamp = obj.getLong("timestamp");
            val.value  = (float) obj.getDouble("value");
            results.add(val);
        }

        listener.onDataReady(results);

    }
    catch(JSONException jse) {
        jse.printStackTrace();
    }

 }
The body contains the JSON response as string. At line 7 to 14, the app parses the JSON array and create a simple class that holds the value and the timestamp of each element parsed:
protected static class Value {
    float value;
    long timestamp;
}
Finally, at line 17 the parser notify the result to the main class so that it draws the chart.
Chart in Android with MPAndroidChart
Once the data is available, the android app can draw the chart. To this purpose, we use MPAndroidChart. The first step is adding the dependency in grade file
dependencies {
    compile fileTree(dir: 'libs', include: ['*.jar'])
    testCompile 'junit:junit:4.12'
    compile 'com.android.support:appcompat-v7:23.1.1'
    compile 'com.github.PhilJay:MPAndroidChart:v2.1.6'
    compile 'com.android.support:support-v4:23.1.1'
    compile 'com.squareup.okhttp:okhttp:2.6.0'
}
To this purpose, we use an android fragment that holds the chart. The layout is very simple, the available screen is divided in two areas: one that holds the temperature chart and the other the humidity chart. The layout is shown below:
<LinearLayout xmlns:android="http://schemas.android.com/apk/res/android"
    xmlns:tools="http://schemas.android.com/tools"
    android:layout_width="match_parent"
    android:layout_height="match_parent"
    tools:context="com.survivingwithandroid.ubiapp.ChartFragment"
    android:orientation="vertical">

    <com.github.mikephil.charting.charts.LineChart
        android:id="@+id/chartTemp"
        android:layout_width="match_parent"
        android:layout_height="0dp"
        android:layout_weight="1"/>

    <com.github.mikephil.charting.charts.BarChart
        android:id="@+id/chartPress"
        android:layout_width="match_parent"
        android:layout_height="0dp"
        android:layout_weight="1"/>
</LinearLayout>
Before invoking the Ubidots client, the app initialises the chart properties:
private void initChartTemp(LineChart chart) {
    chart.setTouchEnabled(true);
    chart.setDrawGridBackground(true);
    chart.getAxisRight().setEnabled(false);
    chart.setDrawGridBackground(true);

    YAxis leftAxis = chart.getAxisLeft();
    leftAxis.setAxisMaxValue(30F);
    leftAxis.setAxisMinValue(10F);
    leftAxis.setStartAtZero(false);
    leftAxis.setAxisLineWidth(2);
    leftAxis.setDrawGridLines(true);

    // X-Axis
    XAxis xAxis = chart.getXAxis();
    xAxis.resetLabelsToSkip();
    xAxis.setPosition(XAxis.XAxisPosition.BOTTOM);
    xAxis.setDrawGridLines(true);
}
At lines 7-12, the app sets up the Y axis setting the min and max range vaults, while at line 15-18, the app configures the X axis
Now the android app is ready to invoke the Ubidots client, shown above:
( new UbidotsClient() ).handleUbidots(tempVarId, API_KEY, new UbidotsClient.UbiListener() {
            @Override
            public void onDataReady(List result) {
                Log.d("Chart", "======== On data Ready ===========");
                List entries = new ArrayList();
                List labels = new ArrayList();
                for (int i=0; i < result.size(); i++) {

                    Entry be = new Entry(result.get(i).value, i);
                    entries.add(be);
                    Log.d("Chart", be.toString());
                    // Convert timestamp to date
                    Date d = new Date(result.get(i).timestamp);
                    // Create Labels
                    labels.add(sdf.format(d));
                }

                LineDataSet lse = new LineDataSet(entries, "Tempearature");

                lse.setDrawHighlightIndicators(false);
                lse.setDrawValues(false);
                lse.setColor(Color.RED);
                lse.setCircleColor(Color.RED);
                lse.setLineWidth(1f);
                lse.setCircleSize(3f);
                lse.setDrawCircleHole(false);
                lse.setFillAlpha(65);
                lse.setFillColor(Color.RED);

                LineData ld = new LineData(labels, lse);

                tempChart.setData(ld);
                Handler handler = new Handler(ChartFragment.this.getActivity().getMainLooper());
                handler.post(new Runnable() {
                    @Override
                    public void run() {
                        tempChart.invalidate();
                    }
                });

            }
        });
In this snippet, the app creates LineDataSet that is used to draw the values. The same steps are applied to draw humidity chart.
At the end of this post, you learned how to retrieve data from Ubidots using Android app and how to draw charts using MPAndroidChart using values sent by Arduino with DHT11 sensor.
| Reference: | Internet of things project: Connect Android to Ubidots and Arduino – Part 2 from our JCG partner Francesco Azzola at the Surviving w/ Android blog. |
