Continuing on from my blog post about scraping Neo4j’s release dates I thought it’d be even more interesting to chart the release dates of some github projects.
In theory the release dates should be accessible through the github API but the few that I looked at weren’t returning any data so I scraped the data together.
We’ll be using rvest again and I first wrote the following function to extract the release versions and dates from a single page:
library(dplyr)
library(rvest)

process_page = function(releases, session) {
  rows = session %>% html_nodes("ul.release-timeline-tags li")

  for(row in rows) {
    date = row %>% html_node("span.date")
    version = row %>% html_node("div.tag-info a")

    if(!is.null(version) && !is.null(date)) {
      date = date %>% html_text() %>% str_trim()
      version = version %>% html_text() %>% str_trim()
      releases = rbind(releases, data.frame(date = date, version = version))
    }
  }
  return(releases)
}
Let’s try it out on the Cassandra release page and see what it comes back with:
> r = process_page(data.frame(), html_session("https://github.com/apache/cassandra/releases"))
> r
           date               version
1  Jun 22, 2015       cassandra-2.1.7
2  Jun 22, 2015      cassandra-2.0.16
3   Jun 8, 2015       cassandra-2.1.6
4   Jun 8, 2015   cassandra-2.2.0-rc1
5  May 19, 2015 cassandra-2.2.0-beta1
6  May 18, 2015      cassandra-2.0.15
7  Apr 29, 2015       cassandra-2.1.5
8   Apr 1, 2015      cassandra-2.0.14
9   Apr 1, 2015       cassandra-2.1.4
10 Mar 16, 2015      cassandra-2.0.13
That works pretty well but it’s only one page! To get all the pages we can use the follow_link function to follow the ‘Next’ link until there aren’t anymore pages to process.
We end up with the following function to do this:
find_all_releases = function(starting_page) {
  s = html_session(starting_page)
  releases = data.frame()

  next_page = TRUE
  while(next_page) {
    possibleError = tryCatch({
      releases = process_page(releases, s)
      s = s %>% follow_link("Next")
    }, error = function(e) { e })

    if(inherits(possibleError, "error")){
      next_page = FALSE
    }
  }
  return(releases)
}
Let’s try it out starting from the Cassandra page:
> cassandra = find_all_releases("https://github.com/apache/cassandra/releases")
Navigating to https://github.com/apache/cassandra/releases?after=cassandra-2.0.13
Navigating to https://github.com/apache/cassandra/releases?after=cassandra-2.0.10
Navigating to https://github.com/apache/cassandra/releases?after=cassandra-2.0.8
Navigating to https://github.com/apache/cassandra/releases?after=cassandra-1.2.13
Navigating to https://github.com/apache/cassandra/releases?after=cassandra-2.0.0-rc1
Navigating to https://github.com/apache/cassandra/releases?after=cassandra-1.2.3
Navigating to https://github.com/apache/cassandra/releases?after=cassandra-1.2.0-beta2
Navigating to https://github.com/apache/cassandra/releases?after=cassandra-1.0.10
Navigating to https://github.com/apache/cassandra/releases?after=cassandra-1.0.6
Navigating to https://github.com/apache/cassandra/releases?after=cassandra-1.0.0-rc2
Navigating to https://github.com/apache/cassandra/releases?after=cassandra-0.7.7
Navigating to https://github.com/apache/cassandra/releases?after=cassandra-0.7.4
Navigating to https://github.com/apache/cassandra/releases?after=cassandra-0.7.0-rc3
Navigating to https://github.com/apache/cassandra/releases?after=cassandra-0.6.4
Navigating to https://github.com/apache/cassandra/releases?after=cassandra-0.5.0-rc3
Navigating to https://github.com/apache/cassandra/releases?after=cassandra-0.4.0-final

> cassandra %>% sample_n(10)
            date               version
151 Mar 13, 2010   cassandra-0.5.0-rc2
25   Jul 3, 2014      cassandra-1.2.18
51  Jul 27, 2013       cassandra-1.2.8
21  Aug 19, 2014   cassandra-2.1.0-rc6
73  Sep 24, 2012 cassandra-1.2.0-beta1
158 Mar 13, 2010   cassandra-0.4.0-rc2
113 May 20, 2011     cassandra-0.7.6-2
15  Oct 24, 2014       cassandra-2.1.1
103 Sep 15, 2011 cassandra-1.0.0-beta1
93  Nov 29, 2011       cassandra-1.0.4
I want to plot when the different releases happened in time and in order to do that we need to create an extra column containing the ‘release series’ which we can do with the following transformation:
series = function(version) {
  parts = strsplit(as.character(version), "\\.")
  return(unlist(lapply(parts, function(p) paste(p %>% unlist %>% head(2), collapse = "."))))
}

bySeries = cassandra %>%
  mutate(date2 = mdy(date), series = series(version),
         short_version = gsub("cassandra-", "", version),
         short_series = series(short_version))

> bySeries %>% sample_n(10)
            date               version      date2        series short_version short_series
3    Jun 8, 2015       cassandra-2.1.6 2015-06-08 cassandra-2.1         2.1.6          2.1
161 Mar 13, 2010 cassandra-0.4.0-beta1 2010-03-13 cassandra-0.4   0.4.0-beta1          0.4
62  Feb 15, 2013      cassandra-1.1.10 2013-02-15 cassandra-1.1        1.1.10          1.1
153 Mar 13, 2010 cassandra-0.5.0-beta2 2010-03-13 cassandra-0.5   0.5.0-beta2          0.5
37   Feb 7, 2014       cassandra-2.0.5 2014-02-07 cassandra-2.0         2.0.5          2.0
36   Feb 7, 2014      cassandra-1.2.15 2014-02-07 cassandra-1.2        1.2.15          1.2
29   Jun 2, 2014   cassandra-2.1.0-rc1 2014-06-02 cassandra-2.1     2.1.0-rc1          2.1
21  Aug 19, 2014   cassandra-2.1.0-rc6 2014-08-19 cassandra-2.1     2.1.0-rc6          2.1
123 Feb 16, 2011       cassandra-0.7.2 2011-02-16 cassandra-0.7         0.7.2          0.7
135  Nov 1, 2010 cassandra-0.7.0-beta3 2010-11-01 cassandra-0.7   0.7.0-beta3          0.7
Now let’s plot those releases and see what we get:
ggplot(aes(x = date2, y = short_series),
       data = bySeries %>% filter(!grepl("beta|rc", short_version))) +
  geom_text(aes(label=short_version),hjust=0.5, vjust=0.5, size = 4, angle = 90) +
  theme_bw()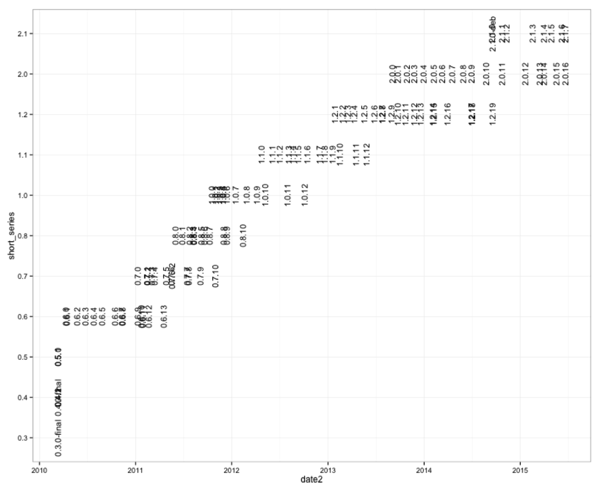
An interesting thing we can see from this visualisation is what overlap the various series of versions have. Most of the time there are only two series of versions overlapping but the 1.2, 2.0 and 2.1 series all overlap which is unusual.
In this chart we excluded all beta and RC versions. Let’s bring those back in and just show the last 3 versions:
ggplot(aes(x = date2, y = short_series),
       data = bySeries %>% filter(grepl("2\\.[012]\\.|1\\.2\\.", short_version))) +
  geom_text(aes(label=short_version),hjust=0.5, vjust=0.5, size = 4, angle = 90) +
  theme_bw()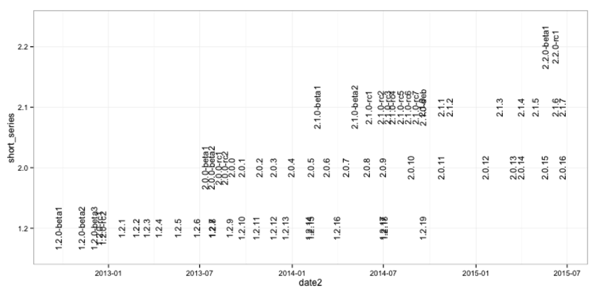
From this chart it’s clearer that the 2.0 and 2.1 series have recent releases so there will probably be three overlapping versions when the 2.2 series is released as well.
The chart is still a bit cluttered although less than before. I’m not sure of a better way of visualising this type of data so if you have any ideas do let me know!
| Reference: | R: Scraping the release dates of github projects from our JCG partner Mark Needham at the Mark Needham Blog blog. |
