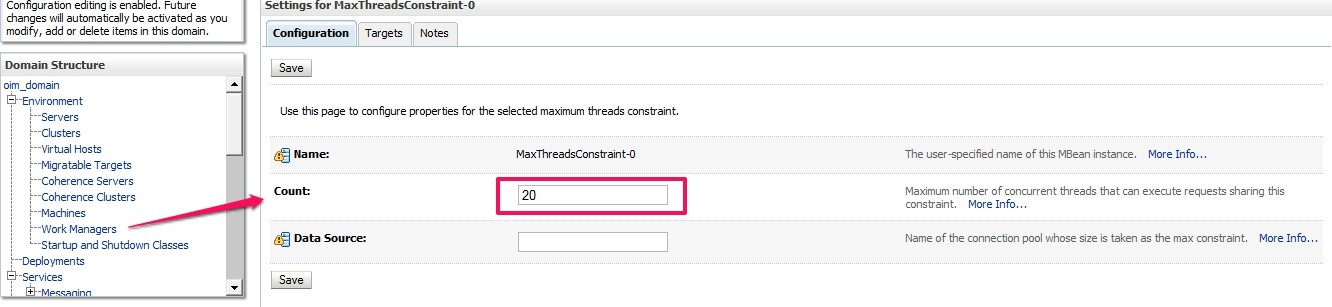
The default configuration in Oracle IDM reserves 20 threads dedicated for serving front end (UI) requests. This basically means that the application server has a pool of 20 threads which it can utilize to serve users who are accessing OIM via the web console (/identity or /sysadmin).
In case of Weblogic, this is how it is configured:
What typically happens is
- User accesses the OIM URL e.g. http://oimhost:14000/identity
- Browser sends a simple (HTTP) GET request with some added HTTP request headers and other info of course
- The application server (e.g. Weblogic) picks up a thread from the pool and uses it to process the request
- OIM responds back and the browser renders the login page and the user is delighted .. well most of the time! ;-)
- After the request is served, the thread on the application server is sent back to the pool (remember that pool of 20 threads I just mentioned about) and thus it can be reused by another request
I just wanted to play around with this and executed some simple tests via JMeter
Note: This is merely a front end/UI stress testing – not related to business logic
Steps
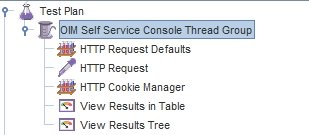
Well there are a few configurations you would need to setup in JMeter – they are pretty much standard and have nothing to do with OIM in specific
- Set up a Thread Group (represents users)
- Configure HTTP requests e.g. configure the OIM URL, context path, port (again – pretty basic)
- Configure Result viewer – tree or table mode. This is for real time tracking of results
The JMeter configuration (.jmx) file is available for your reference – just import it in JMeter and you should be able to figure out the exact configuration parameters and tweak them if interested
Testing parameters
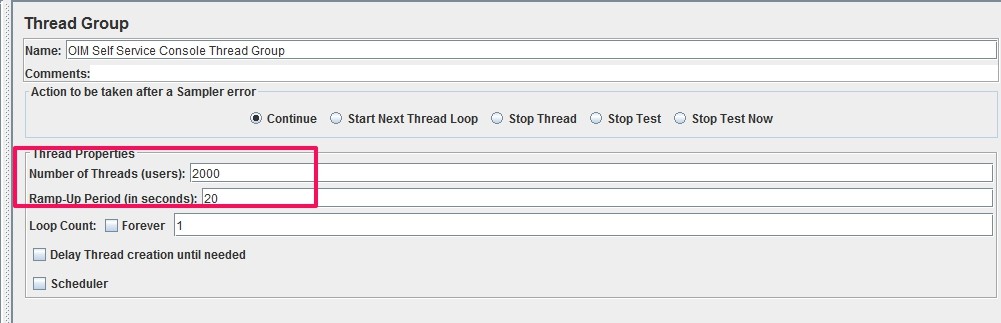
I tried testing with various permutations and combinations by changing the Number of Threads and Ramp-Up Period attributes in the Thread Group setup within JMeter
Number of Threads – equivalent to the number of users you want to simulate
Ramp-Up Period (seconds) – equivalent to the time period/range during which you want JMeter to trigger all the requests
e.g. Number of Threads = 100 and Ramp-Up Period = 20 seconds basically means simulating a scenario where 100 users are accessing your application (OIM in this case) over a period of 20 seconds.
- Attempt 1: Number of Threads = 100 and Ramp-Up Period = 20 seconds
- Attempt 2: Number of Threads = 200 and Ramp-Up Period = 20 seconds
- Attempt 3: Number of Threads = 500 and Ramp-Up Period = 20 seconds
- Attempt 4: Number of Threads = 1000 and Ramp-Up Period = 20 seconds
- Attempt 5: Number of Threads = 2000 and Ramp-Up Period = 20 seconds
What I was expecting
To be honest, I expected some delay/latency when 2000 threads (potential users) were fired in a space of 20 seconds. Looks like that did not happen.
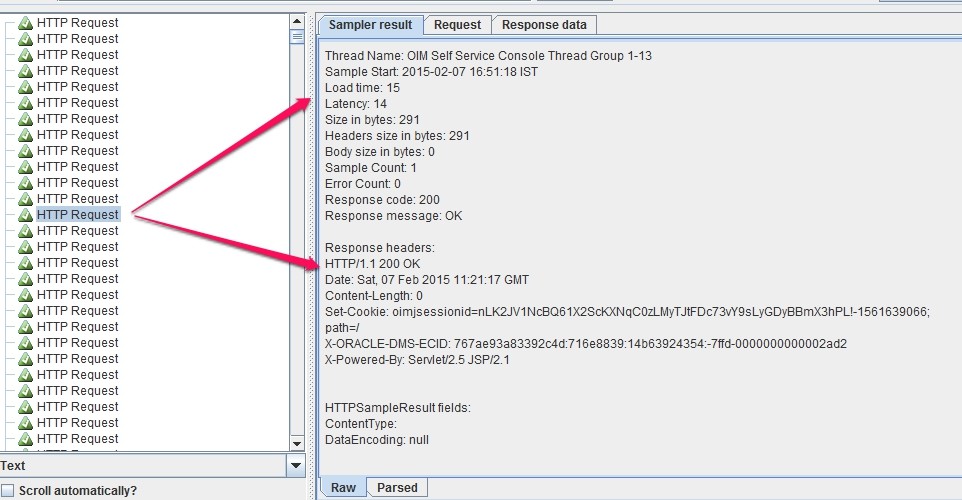
Actual Result
All in all, the response was quite healthy.
- Green results i.e. HTTP 200 (OK) response
- Low latency and load times
To be noted
- This was executed in a personal test VM (running OIM 11g R2 PS2) and hence there was not much load on the system
- Can’t expect much latency when the server I am connecting to is just a guest VM ;-)
Still, this was fun and it would be interesting to execute the same test on a server which has running processes in the back end e.g scheduler, some access request processes etc.
If the out of the box configuration of 20 threads does not work for your environment, you can change it using the Weblogic Admin Console – rinse and repeat :-)
Until then.. Cheers !
| Reference: | Stress testing the OIM web (UI) layer from our JCG partner Abhishek Gupta at the Object Oriented.. blog. |
