This is the third article in the “Continuous Delivery” series. The CI Tools Setup ended with Jenkins up and running waiting for us to use it. Travis, on the other hand, was left aside and soon we’ll see why.
In this article we’ll explore static analysis as the first type of tasks that we should do in our delivery pipeline. Since that is our starting point, let’s go through the brief explanation.
Static analysis
Static program analysis is the analysis of computer software that is performed without actually executing programs (analysis performed on executing programs is known as dynamic analysis).
In our case we’ll focus on Java and three types of analysis:
- Checkstyle: finds violations of coding conventions.
- Findbugs: looks for bugs in compiled Java code.
- PMD: looks for potential problems in Java source code.
Even though we’ll use Java in our examples, the same idea applies to any other language. All three tools are valuable and perform different functions (even though there are overlapping areas). When combined and properly set they can provide good initial evaluation of the code that can be used to decide whether it’s worth to continue with the rest of the delivery pipeline. Remember, faster we fail, faster we’ll know what to fix. For that reason, static analysis is often the first line of defense. All popular IDEs support static analysis so in many cases problems are detected even before they get to the tools like Jenkins and Travis.
On bigger projects you might want to use SonarQube. For the purpose of this article, we decided to go for simple and minimalist solution without Sonar.
Checkstyle
 Checkstyle is a development tool aimed at helping programmers to write Java code that adheres to a coding guidelines.
Checkstyle is highly configurable and can be made to support almost any coding standard. An example configuration file is supplied supporting the Sun Code Conventions. As well, other sample configuration files are supplied for other well-known conventions.
My experience is that in most cases customization of the configuration file is required. Predefined rules are often an overkill and in some cases can cause the loss of productivity without any actual gain. However, once the team is set and starts using the (customized) style that fits the best (often the result of trial and error type of changes to the configuration) the increase in code readability is evident. Being on the “same page” regarding the coding standard makes everyone more comfortable when reading and writing the code.
Findbugs
 Findbugs tries to find ‘known problems’ which can lead to bugs. Unlike checkstyle that I learned to both love and hate and, if anything, requires a lot of fiddling with its configuration, warnings produced with Findbugs are almost always possible defects that can be harmful in some way. Upsides of Findbugs is that it usually finds real defects and false positives rate is low. As a downside, it needs the compiled code. Ideally, static analysis should be done as the first step before the actual compilation and Findbugs forces us to create class files in order to run it.
PMD
![]() PMD looks for potential problems, possible bugs, unused and sub-optimal code and over-complicated expressions in the Java source code. Number of real problems it finds is usually a bit lower than those located with Findbugs. On the other hand, it shines at finding problems related with badly implemented (or the luck of) best practices.
PMD looks for potential problems, possible bugs, unused and sub-optimal code and over-complicated expressions in the Java source code. Number of real problems it finds is usually a bit lower than those located with Findbugs. On the other hand, it shines at finding problems related with badly implemented (or the luck of) best practices.
Jenkins job setup
It’s time to start implementing static analysis in our delivery pipeline. Examples in this article will use the source code located in the TechnologyConversationsCD repository. Src directory contains source code copied from the Tennis Game kata. In order for our Jenkins job to work correctly, we’ll have to pull the code from the repository, run static analysis and publish results.
All execution will be performed by Gradle. This article will not go into details of how Gradle works nor why we choose it over Ant, Maven and other build tools. For more details, please consult the Gradle website.
Let’s start by installing missing programs and few Jenkins plugins.
Docker
The Dockerfile created in the previous article CI Tools Setup will need to be modified. We’ll start by adding the GIT client and Gradle to our container.
[Dockerfile]
# GIT
RUN apt-get install -q -y git

# Gradle
ADD https://services.gradle.org/distributions/gradle-1.12-all.zip /opt/gradle-1.12-all.zip
RUN unzip /opt/gradle-1.12-all.zip -d /opt/
ENV GRADLE_HOME /opt/gradle-1.12
ENV PATH $PATH:$GRADLE_HOME/bin
Full source code can be found in the Dockerfile in our GitHub repository.
Once all the software is installed (GIT, Gradle, Jenkins, etc), we’ll need to add missing plugins. By this time you should be familiar with Docker.
[Dockerfile]
# Jenkins: Plugins
ADD https://updates.jenkins-ci.org/latest/git.hpi /jenkins/plugins/git.hpi
ADD https://updates.jenkins-ci.org/latest/gradle.hpi /jenkins/plugins/gradle.hpi
ADD https://updates.jenkins-ci.org/latest/analysis-collector.hpi /jenkins/plugins/analysis-collector.hpi
ADD https://updates.jenkins-ci.org/latest/checkstyle.hpi /jenkins/plugins/checkstyle.hpi
ADD https://updates.jenkins-ci.org/latest/findbugs.hpi /jenkins/plugins/findbugs.hpi
ADD https://updates.jenkins-ci.org/latest/pmd.hpi /jenkins/plugins/pmd.hpi
Full source code can be found in the Dockerfile in our GitHub repository.
For brevity reasons few other minor changes to our Dockerfile are excluded from this article. Please get the full copy from the repo.
Once the Dockerfile was pushed to GitHub and compiled by Docker, our new container is ready for use from Vagrantfile or by running it manually.
To reload our Vagrant VM, run following from the directory where Vagrantfile is located:
[Vagrantfile]
vagrant reload --provision
You can see the Jenkins server by opening http://localhost:4567 in your favorite browser. We have our plugins downloaded and installed (more info can be found in http://localhost:4567/pluginManager/installed). Together with GIT and Gradle that was set on the server, we’re ready to start creating our first job.
Jobs
Creating a new Jenkins job is easy. First item in the left-hand menu is “New Item”. As “Item Name” type “myFirstJob”, select “Build a free-style software project” and click the OK button. Quantity of tasks one can do within an Jenkins job is enormous. However, we’ll focus on code analysis only. We’ll do the following:
- Pull the code
- Run analysis
- Publish the results
Pull the code
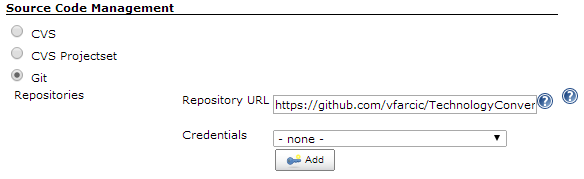 Select “GIT” as the “Source Code Management” and add your repository. For the purpose of this exercise, you can use our repo: https://github.com/vfarcic/TechnologyConversationsCD.git .
Next, we need to set the trigger that will make Jenkins pull the code. Normally, you’d create a GitHub hook that would notify your Jenkins instance whenever content of the repo changes. However, we’ll take a different approach and pull the code periodically. The reason behind this practice is because we’re currently running on localhost. In production, please use hooks instead of pulling as described below.
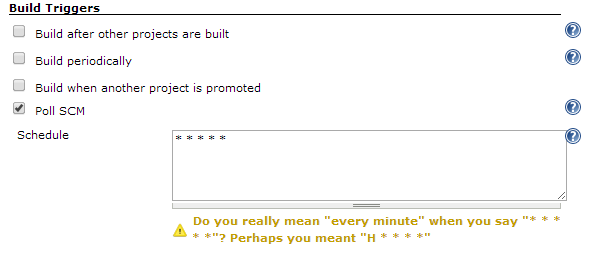 Set “* * * * *” inside “Pool SCM” section of the “Build Triggers”. 5 *s mean every minute of every hour or every day of the month of every day of the week. Scheduling syntax is very similar of the one used in Linux cron. Explanation provided by Jenkins is usually sufficient for most users.
Now we have Jenkins pulling GitHub every minute. If one of those pulls detects a change in the code, this job will pull the code to the workspace. What we’ll do with this code comes next.
Run Gradle tasks
Since Gradle is our weapon of choice, we’ll use it to run our static analysis. All we have to do to enable Checkstyle, Findbugs and PMD analysis is to add plugins. Here’s the extract from the build.gradle file located in the root of our source code:
apply plugin: 'checkstyle'
apply plugin: 'findbugs'
apply plugin: 'pmd'
Full source code can be found in the build.groovy in our GitHub repository.
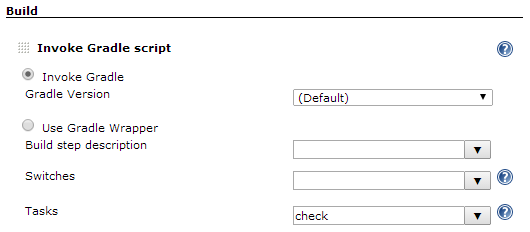 That’s it. Those three lines created new Gradle tasks like: checkstyleMain, checkstyleTest, findbugsMain, etc. The one we’re interested in is the task “check”. It will run all static analysis tasks. At the moment they consist of the above mentioned. More can be added by simply putting new plugins.
To run a Gradle task from Jenkins, select “Invoke Gradle Script” from the “Add build step” list located in the “Build” section. Since we already established that the only task we need is “check” that’s precisely what should be put in the “Tasks” field.
Publish analysis results
 We’re almost there. All that is left is to publish the results so that they are easily available.
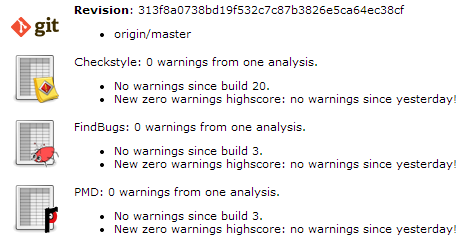
To publish the Checkstyle results, select “Publish Checkstyle analysis results” from the “Add post-build action” list. Field “Checkstyle results” should have the
value “build/reports/findbugs/*.xml”. Same setup should be repeated for Findbugs and PMD. Check out the options hidden behind the “Advanced” button, especially “Status thresholds”. Probably most important option in the Advanced section is “Run always” check box. Without it, publishers run only if there are no static analysis warnings.
Run the job
Now we have everything set and the only thing missing is to run the job. We already set the job to run whenever there are changes to our GIT repository. Jenkins job will be run soon after our next push. If that is not soon enough, you can run any job by navigating to the job and clicking the “Build Now” link located on the left-hand side of the screen. New build will start. When done, Checkstyle, Findbugs and PMD reports will be located inside the build result.
Jenkins job setup summary
On the first look all those steps might seem daunting. However, with a bit of a practice it should not take more than 15 minutes to do the whole process. We did following:
- Modified the Dockerfile to include instructions to install Gradle and GIT.
- Modified the Dockerfile to download required Jenkins plugins.
- Reloaded our Vagrant VM
- Created new Jenkins job that pulls the code form our GIT repository, runs “check” task from our Gradle build script and, finally, publishes the results.
This is just the beginning. There are many other steps and concepts left to explore on our path towards Continuous Delivery. Some of them will be explored in the next article. Right now, we’ll switch our focus to Travis and see how could we do the same (or similar) using cloud solution.
Travis
![]() As you’ll see shortly, Travis (at least cloud version) requires much less work than local instance of Jenkins. As a general rule, all we need to do in order to use Travis (besides being registered) is to:
As you’ll see shortly, Travis (at least cloud version) requires much less work than local instance of Jenkins. As a general rule, all we need to do in order to use Travis (besides being registered) is to:
- Enable builds from out GitHub repository
- Create the .travis.yml file with instructions
Enable builds from out GITHub repository
Travis works only with GIT repositories. You can fork the one we’ve been using throughout this article. If you’ve never forked an GITHub repo, instructions are following:
- Go to TechnologyConversationsCD
- Click on the “Fork” icon at the top-right corner of the page.
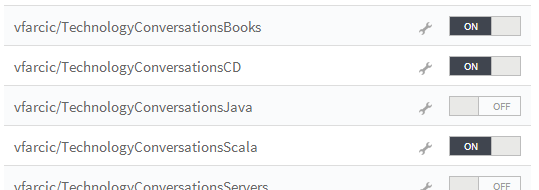 Assuming that you are already signed in, to enable the build process for some GITHub repository, click on “Accounts” under your name. Following screen should list all repositories that you own and, if you forked the CD repo, it should be the one listed. Turn it on.
The forked repository itself already comes with .travis.yml. Complete file is very short.
[.travis.yml]
language: java

before_install:
  - chmod +x gradlew

env:
  - TERM=dumb

notifications:
  email:
  - viktor@farcic.com
Full source code can be found in the .travis.yml in our GitHub repository (and the one you just forked).
First thing you might notice is that, unlike Jenkins, we don’t need to tell Travis what to run. It is clever enough to figure it out by itself. We just need to specify few things like, for example, notifications email that will be used. As a general rule, Travis require us to specify non-standard things, those that he cannot figure out by himself. If a project is done using some sort of standard (as is the case with the sample code we’re using), Travis is perfectly capable of knowing what to do. In this case it will, among other things, run the Gradle task “check” in the same way as Jenkins did. If there is a failure in any part of the build process, Travis will stop the execution and notify us by email (or whatever other way of communication we specified).
That’s it. There was almost nothing we should do to make the static analysis of our sample code to work in Travis. Simple .travis.yml file was all that’s needed. One big advantage is that the config file is stored together with the rest of our code. This greatly simplifies the storage and maintenance.
Major downside of Travis is that the only result (without resulting to some “hacks”) is the log output. There are no nice reports as those produced by Jenkins. This does not need to be necessarily a bad thing. The general idea of Continuous Integration, Deployment and Delivery is that no news are good news. If it doesn’t fail, ignore it. Another important factor are very short cycles. There should be very few failures at the same time and the priority should be to fix them before the team continues the work. Having those two things exercised (actions only on failure and short cycles) there is, in most cases, no need for “fancy” reports. However, it might take a lot of time to get to that point and many organizations will require you to take intermediate steps, produce reports… If that’s the case, Jenkins is probably the better option. In my case, I use both but if I’d have to choose only one, it would be Travis.
Other tools
Tradition dictates that this would be a good moment to compare in more details Jenkins and Travis. I’ll leave that to the reader. Upcoming articles in this series will continue using both, continuously comparing them. Right now I’d like to introduce few additional tools.
Drone.io
 Drone.io is an interesting tool. In some aspects it is similar to Travis. In others it is leaned towards Jenkins. Best example is configuration.
- Travis relies on a simple file for all configuration and that file being part of your code.
- Jenkins offers endless possibilities through its plugins system. The price to pay for this can be increased time required for setup and administration.
- Drone.io is neither. There is no configuration file as in Travis nor there are endless possibilities as with Jenkins. Configuration is done using Drone.io Web GUI. It’s easy to use “wizard like” interface that leaves some things to be desired.
Both Travis and Jenkins offer very powerful yet different ways to configure jobs. Drone.io uses an interesting concept that still requires polishing before it could become serious contestant for the top list of CI/CD tools. For example, there is no obvious way to use Gradle in a Java project. Once it was set as Groovy it worked.
It will be interesting to see Drone.io progress during the coming months.
BuildHive
BuildHive is one of many cloud based CI services. It is built on top of Jenkins. Idea in itself is very interesting. Jenkins on the cloud could be translated as power without hassle related to maintenance of your local server. However, BuildHive has all that power stripped down. Users are left without things they like the most about Jenkins (plugins and endless possibilities) with little in return. Maybe there is more to it than it meets the eye but for me it was a very disappointing experience.
Circle
 Circle was as easy to start using as Travis. Choose the repo and that’s it. Build was executed without any problems. Like travis, additional configuration can be done with a file circle.yml that resides in the repository root. Please take a look at the circle.yml that was used with the code from this article. As an additional option, there is a Web interface that allows tweaking without the creation of the circle.yml file.
First thing I noticed with Circle running on repository used in this article is the speed. It was considerably faster than Travis. However, that in itself does not tell much because the code consists of only two classes and few dependencies. So, I tried it out with a big bigger project (Scala, Play, AngularJS, more than few dependencies…). Results were disappointing. First run was considerably slower than Travis. It was as it was confused what to do with dependencies, it repeated the same long process of fetching dependencies several times, got confused with Play and SBT tests and run the same set twice, etc. It was very painful experience that ended up after 29 minutes or, approximately, 5-7 times slower than Travis (same process normally needs around 4-6 minutes). I could only assume that Scala/Play combination is not something Circle likes. However, shortly afterwards I was contacted by Circle, explained the problem and got it fixed in no time. From there on, execution time of the project dropped from 29 to 2-3 minutes or approximately half of Travis.
Another downside is that, excluding 14 days trial, there is no free service for OSS projects as it’s the case with Travis.
For those willing to pay, Circle is a great alternative to Travis. It uses the same principles, it’s much faster and it has a truly great customer support.
Summary
We setup static analysis on both Jenkins and Travis. Travis proved to be much easier to set up while Jenkins shined with its plugins and Web UI. Both tools offer powerful (yet very different) ways to customize your jobs.
Next articles will provide more details into the Continuous Integration and Delivery flow. Next on our list are tests and code coverage.
We’ll add Circle to the existing set of tools. All examples will be done using Jenkins (local server), Travis (cloud) and Circle (cloud). Please let me know if you think that it would be a good idea to explore more tools.
| Reference: | Continuous Delivery: Static Analysis from our JCG partner Viktor Farcic at the Technology conversations blog. |
