Taboola’s Spark monitoring architecture for handling 10B+ daily user events
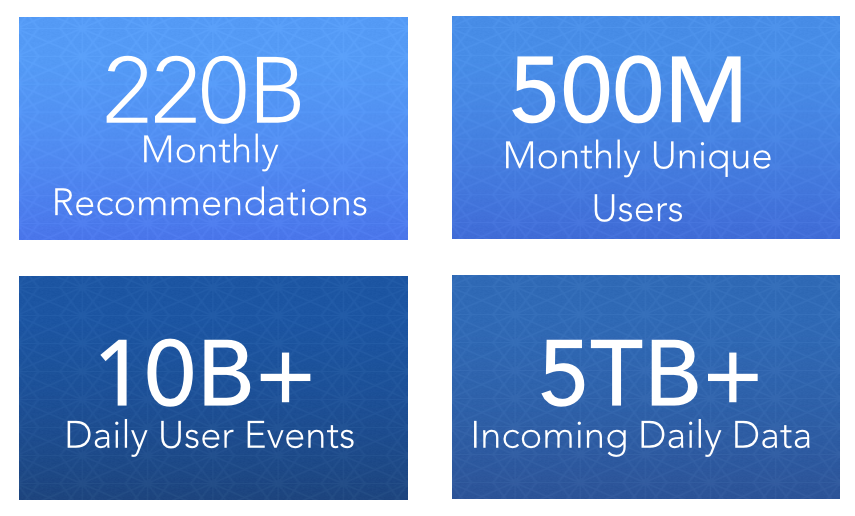
They say unicorns don’t exist, but of course you know that’s not true — at least not in the tech world. When we looked to learn more about Spark monitoring, our first choice was one of these unicorns – Taboola. This post will give an inside view of how they serve 550 million unique monthly users and deliver 200 billion monthly content recommendations using Spark. Working at this scale means an error so small that it only happens 0.1% of the time can easily affect hundreds of thousands of users. So how do you deal with this kind of pressure? Which metrics do you need to follow? And what are the tools that you need to master? Thanks to Tal Sliwowicz, Taboola’s R&D director, for giving us an inside view of his cluster to answer these questions.
New Post: Spark Monitoring: How to Handle 10B Requests a Day http://t.co/KtnxOKzhAe pic.twitter.com/6zREeY9aZ9
— OverOps (@overopshq) June 2, 2015
The Taboola Spark Stack
Taboola has been using Spark since version 0.7 and currently runs its Spark clusters on version 1.2 with 40 active nodes. A single node has 256GB RAM and 8T of SSDs where Cassandra serves as the main source of data for the read/write operations on Spark, with a hint of MySQL involved. This setup runs in Taboola’s private datacenters with Mesos and Zookeeper to manage it.
For monitoring, the metrics they follow are pushed through Graphite – this includes data about the hardware, the JVMs, and more specific code level data with counters and custom stats they follow. The data is visualized in Grafana, and on top of that there’s an alerts system setup with Nagios and Icinga. To get more hands-on with Graphite you can check out this step by step guide for choosing the right Graphite architecture for your application. On the logging front, Taboola uses the ELK stack for searching and visualizing their logs.
How to gather the data?
Apart from the standard metrics reported to Spark’s web UI, Taboola has independent Sensu agents on the machines for hardware monitoring that report to Graphite. For code level metrics, Dropwizard’s metrics library is in use. In addition to that, JMX beans are used and collected with Jolokia, making the beans available for querying. This Spark monitoring setup has been used in Taboola from the start, keeping in mind that a large scale system without monitoring loses most of its value. At first all monitoring was based on pulling data, but now another layer is being added to manage this data flow with RabbitMQ.
The types of errors you can expect
Spark 1.2 is pretty much stable infrastructure-wise, and the problems you can expect to encounter are mostly because you’re doing something wrong and not because Spark is misbehaving. Let’s have a look at the types of events you can encounter in production and which actions they require (these roughly divide to hardware and application specific issues):
1. Application logic
Spark is made for processing data so the most common issue you would encounter on the application level is that some assumptions about the data you have are not true. It’s not that there are no bugs in production – but they’re kind of exotic and application specific. Meaning, some custom indicator that goes beyond a threshold that you had some assumptions on its statistical model. When these assumptions don’t apply – it probably means there’s something wrong. In addition, you have the exceptions you’re used to seeing every once and a while – say, trying to load some data that you think is there but is not because of some Cassandra issue.
Measuring – The importance of custom metrics and thresholds
Let’s say you want to measure how many events are processed per second, or how many of the events you get should be ignored, this can be achieved by using metrics and Jolokia. Taboola also uses spark accumulators to report on these metrics. Another important indicator comes from checking when was the last time new data was successfully written to Cassandra. You get a timestamp on it, and if it passes a certain threshold where no data was written – It means there might be some problem if for example, a minute has passed and no data was written.
Acting on the alert threshold
When some of these things happen and the alert fires, the first place to go to is the Spark web UI. Many times it can give a good indication of what might be wrong. You can see what’s stuck, get thread dumps of the executors and see where they’re hanging. If some task fails, you can see which exceptions were thrown and continue the search for their cause in the logs or with Takipi. Basically it lets you see which nodes the issue happens in and the exception message – so you have the information you need for the log digging.
The second place to go, if you’re using the ELK stack, is Kibana, and see what kind of data you’re getting there.
For example, in Taboola, they have a process that updates the MySQL part of the stack. So they had an issue during an update, where the custom alerts that were set discovered there’s a problem before getting an indication about it from the database itself. This was possible thanks to a custom metric they monitor that follows the time from the last successful database write. It passed the threshold they’ve set up, then they got a thread dump from the Spark web UI which allowed them to locate the cause of the issue and solve it.
2. Hardware issues
On the hardware front, Taboola has managed to have a symmetric deployment so far with an equal number of Spark and Cassandra instances. The action to look out for here is adding more nodes. Since Cassandra and Spark work really well with scaling up. It’s usually a matter of adding more CPU power, and this is why they monitor it.
How do you know you need to add an extra node?
Taboola’s traffic is on the rise and they get more and more data to crunch on a regular basis. The data is saved in Cassandra and then there’s some period of time after which it gets deleted, but when they notice the pace of disk space utilization rises gradually they’re adding another node and pass some of the data there. The alert that triggers the addition of a new node happens when disk utilization passes a certain threshold, say 50%. Since the whole process is monitored – this does not come as a surprise.
On the CPU front, if they run more processing than usual because of a traffic rise, or some logic change that has more processing activities – They see the CPU utilization pass a certain threshold, so they add another Spark node.
3. The missing link – Getting the variable data without remote debugging
The main pain point Taboola currently has, according to Tal, is a deeper analysis of errors. “Even after we get the stack trace”, he says, “It doesn’t lead us to the real root cause and the variable state that caused each error. This is painfully missing”. After using Takipi to monitor Taboola’s production environment to address this issue and view the variable values that led to each error, Tal says the next move is to install it on their Spark nodes. “Currently we hook up to the JVM manually with a remote debugger only after we realize something went wrong and try to recreate the issue so we can draw out the state that caused it. This is quite cumbersome and doesn’t allow us to view the event’s history and fully understand what might have been wrong”.
Conclusion
Even if your code is tested thoroughly, it doesn’t mean that you’ll not encounter issues in your production system and it’s only an absolute necessity to monitor your crucial metrics to know how to navigate ahead. An all around monitoring strategy is required to be able to produce a timely response to any event that can happen and leave no room for surprises.
We’d like to thank Tal Sliwowicz again for sharing his insights and experience from scaling up with Taboola’s Spark infrastructure. If you have further Spark monitoring related questions for Tal, please use the comments section below.
| Reference: | Spark Monitoring: How to Handle 10B Requests a Day from our JCG partner Alex Zhitnitsky at the Takipi blog. |
