This tutorial is about JMeter.
These are the main points that we are going to cover:
- We are going to explain what is JMeter used for.
- How is JMeter implemented and with what technologies is designed.
- How to install and configure it properly.
- We are going to explain the basic features of its user interface.
- We will detailed explain how to configure different test plans.
- To show how to analyze its results.
- Finally we will mention some important best practices.
All examples have been configured and implemented using Java 8 update 0.20, Eclipse Luna 4.4, JMeter 2.11 and MySQL Community Server 5.6.21.
Table Of Contents
- 1. Introduction
- 2. Technologies used
- 3. What is this article about?
- 4. Installation
- 5. GUI overview
- 6. Available requests
- 7. Test plans and components
- 8. Test plan elements order of execution
- 9. Run/Stop test plans
- 10. Web (HTTP) test plan
- 11. Database test plan tutorial
- 12. Junit test plan
- 13. Recording HTTP tests
- 14. JMeter Plugins
- 15. JMeter best practices
- 16. Summary
- 17. Download
- 18. Resources
1. Introduction
JMeter is an application that offers several possibilities to configure and execute load, performance and stress tests using different technologies and protocols.
It allows simulating different type of requests against all kind of databases, FTP, HTTP, HTTPS or other kind of servers.
It is probably good to explain briefly what all these concepts mean:
- Load tests: These kind of tests take the systems or applications tested to the extremes that they were designed and required for. They are used to measure systems and applications behavior under extreme conditions.
- Performance tests: These tests are used to check how the system behaves in terms of performance, that is, how the system responds and how is its stability for a specific workload.
- Stress tests: These tests try to break or overwhelm the system by loading more resources and taking its modules outside the limits that were designed.
Originally JMeter was designed to test web applications, but its functionality has expanded and nowadays allows testing against almost any kind of program and can be used to perform functional tests in your applications.
2. Technologies used
JMeter is a Java desktop application. Its UI is implemented using the Swing Java API. Due to these two points, JMeter is multiplatform and runs in any kind of machine with a Java virtual machine installed: Windows, Linux, Mac.
Its framework allows concurrency and the execution of several Threads and Threads Groups. This is very useful when trying to configure load and stress tests.
It is extensible and there is a very large list of plugins available.
JMeter is part of the Apache software foundation and is completely free and open source (http://www.apache.org/licenses/).
3. What is this article about?
This article is a tutorial about how to use JMeter for developers and software engineers without experience on JMeter.
It also provides examples and how-tos about different possible configurations and test plans. In the next chapters we are going to see how to install JMeter and how to configure, run, store and analyze the results of different kind of test plans.
4. Installation
You need to do the following steps in order to get JMeter installed and running in your computer:
- First of all you have to install Java. You need a JRE 1.6 or above installed in your machine. To do this, just go to the Oracle download site and install the package suitable for your system: http://www.oracle.com/technetwork/java/javase/downloads/index.html.
- Set the
JAVA_HOMEenvironment variable to point to the base directory location, where Java is installed on your machine. For Windows users:
1 | JAVA_HOME=C:\Program Files\Java\jdk1.8.0_20 |
or whatever your Java version is.
- Append Java compiler location to System Path. For Windows users:
1 | C:\Program Files\Java\jdk1.7.0_25\bin |
to the end of the system variable, Path.
- Check that Java is installed in your machine by going to the command line and typing
1 | java -version |
Something like the following should come out:
1 2 3 | java version "1.8.0_20"Java(TM) SE Runtime Environment (build 1.8.0_20-b26)Java HotSpot(TM) 64-Bit Server VM (build 25.20-b23, mixed mode) |
- Download the latest version of JMeter from http://jmeter.apache.org/download_jmeter.cgi
- Extract it to the folder
C:\>JMeterfor example (in Windows). - The structure of this folder should be something like:
01 02 03 04 05 06 07 08 09 10 11 12 13 14 15 | apache-jmeter-2.9apache-jmeter-2.9\binapache-jmeter-2.9\docsapache-jmeter-2.9\extrasapache-jmeter-2.9\lib\apache-jmeter-2.9\lib\extapache-jmeter-2.9\lib\junitapache-jmeter-2.9\printable_docs |
- Then you can start JMeter by going to the folder
C:\jmeter\apache-jmeter-2.11\bin(Windows users) and starting the programjmeter.bat. - You should see the start screen of the JMeter GUI:
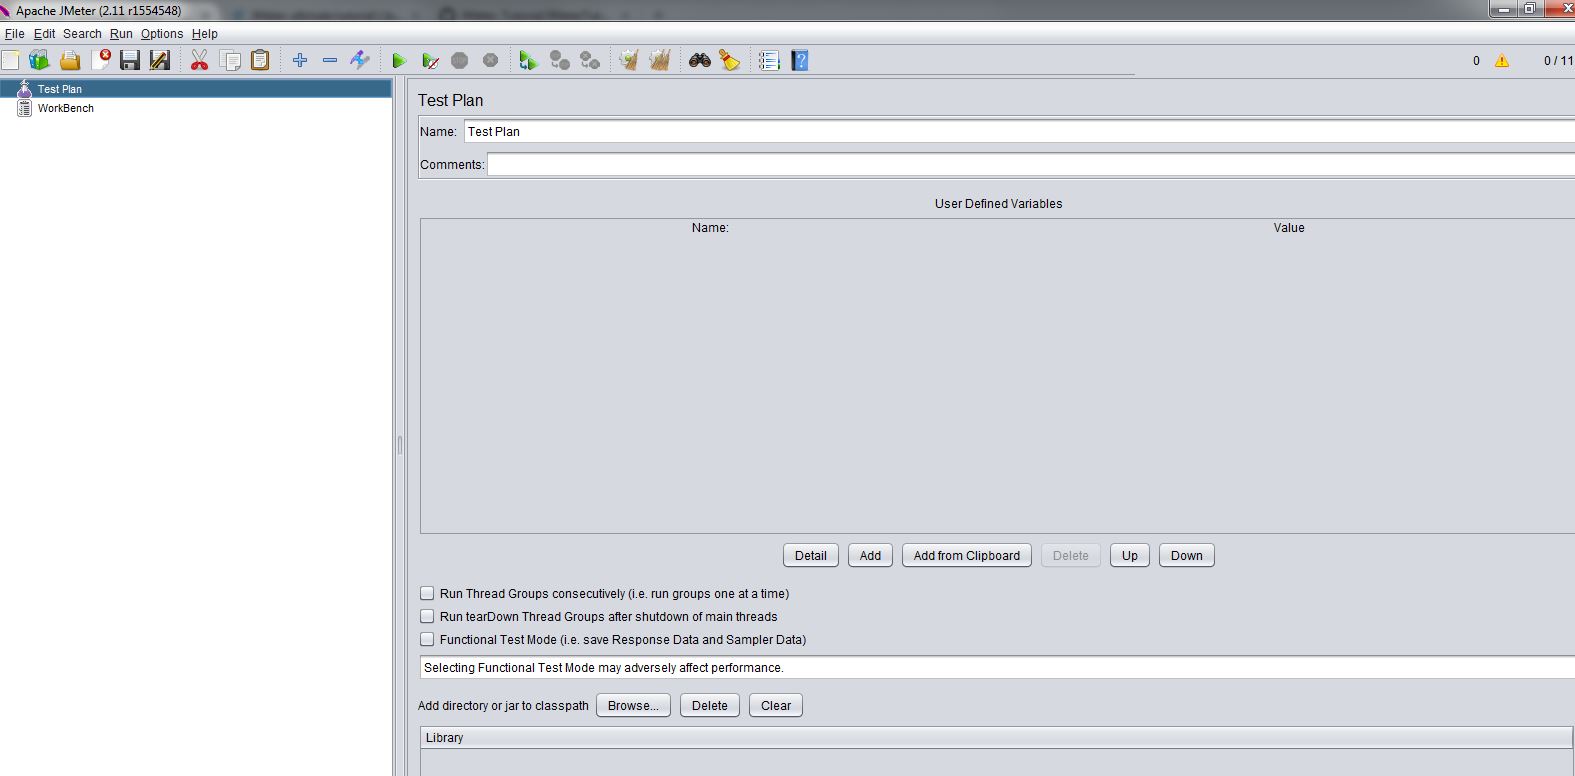
5. GUI overview
The JMeter GUI is very intuitive and easy to use, common menus for file handling like new, open, save, save as etc. and specific menus for starting and stopping test plans and configuring them are available. Every test plan, thread group and test plan node (we will see these more in detail in the next chapters) offer different context menu options by clicking the mouse right button.
It is also possible to change the language of the UI and a big bunch of languages are available.
As we said, the GUI is very intuitive and easy to use and offers for every menu and action very understandable tool tips. This is one of the reasons, apart from its quality, why JMeter is so broadly used, because it is really easy to understand and learn how to work with it.
6. Available requests
JMeter offers test configurations for almost any kind of system, but in general, following protocols are covered out of the box:
- Web: HTTP, HTTPS sites ‘web 1.0’ web 2.0 (ajax, flex and flex-ws-amf): we will see afterwards how to test a potential web page and its behavior.
- Web Services: SOAP / XML-RPC.
- Database via JDBC drivers. Almost any kind of database is supported, what you need is just a proper driver and pack it in the proper folder in the JMeter installation directory. We will make an example of a MySQL database test afterwards.
- Directory: LDAP.
- Messaging Oriented service via JMS
- Mail Service using POP3, IMAP, SMTP.
- FTP Service.
- Functional test using JUnit and Java applications.
7. Test plans and components
Basically, using JMeter consists of the creation, configuration and execution of test plans and the analysis of their results. Test plans are sets of requests against local or remote servers (or clients) configured to run by following specific instructions.
In the configuration of a test plan you can specify several input and output parameters and you can configure the basic conditions that should be met so the test plan is successful or not.
JMeter test plans are composed of different components. Here is a list of the most important ones with instructions about how you can add them using the JMeter UI and what their purpose is:
7.1 ThreadGroup
A thread group is basically a combination of different test plan elements. It is the root of a test plan and it controls the basic central parameters.
In order to create a test plan you may have to create at first a thread group and configure its number of threads, the ramp-up period, the loop counts and the behavior in case or error:
- Number of threads: The number of threads that are going to be used to execute the test plan, very important to configure load and stress tests.
- Ramp-up period: Time that JMeter will need to start all threads.
- Loop count: Number of iterations, that is the amount of times that the test is going to be executed.
- Error behavior: What to do in case of error: Stop current thread, stop the whole test, continue…
A Thread Group has also the start and end time configuration options. By clicking the checkbox “Scheduler” a new section with the schedule parameters will appear and you can configure the start and end time of your test.
Once this is configured you can start adding other test plan elements to your Thread group like samplers, listener and timers. We are going to explain all these in the next chapters.
7.2 Samplers
Samplers are used for sending requests to different kind of servers. They are the basic element of every test plan and everything works around them: they execute requests (based on the configuration provided) and these requests produce one or more responses that are analyzed afterwards.
Here is a list of the Samplers available in JMeter (we are going to see some of them in this tutorial):
- Access log sampler
- AJP sampler
- Bean shell sampler
- BSF sampler
- Debug sampler
- FTP sampler
- HTTP sampler
- Java sampler
- JDBC sampler
- JMS (several) samplers
- JSR223 sampler
- JUnit sampler
- LDAP (several) samplers
- Mail Reader
- MongoDB sampler
- OS process sampler
- SMTP sampler
- SOAP
- TCP samplers
- Test action
As we can see in the list above, there are a lot of different types of samplers; this list is not complete since there are several samplers implemented in different JMeter plugins. The configuration of each sampler depends on the request that it executes, that means that some samplers have things in common but others are completely different because of the nature of their requests.
7.3 Logic controllers
Logic controllers are elements that allow you to configure the order of execution of different samplers inside a Thread group. This list contains all available logic controllers in JMeter:
- Simple Controller
- Loop Controller
- Once Only Controller
- Interleave Controller
- Random Controller
- Random Order Controller
- Throughput Controller
- Runtime Controller
- If Controller
- While Controller
- Switch Controller
- ForEach Controller
- Module Controller
- Include Controller
- Transaction Controller
- Recording Controller
7.4 Listeners
Listeners provide different ways to view the results produced by a Sampler requests. Listeners parse results in form of tables, trees or plain log files.
They can be added anywhere in a test plan, but they will only parse and collect result data from the samplers at their level or in the levels bellow.
These are the available listeners in JMeter:
- Sample Result Save Configuration
- Graph Full Results
- Graph Results
- Spline Visualizer
- Assertion Results
- View Results Tree
- Aggregate Report
- View Results in Table
- Simple Data Writer
- Monitor Results
- Distribution Graph (alpha)
- Aggregate Graph
- Mailer Visualizer
- BeanShell Listener
- Summary Report
7.5 Timers
You can define the time period that you want to wait between requests using timers. If you do not specify any, JMeter will execute the next request immediately after the current one is finished, without any waiting time.
Following timers are available in JMeter:
- Constant Timer
- Gaussian Random Timer
- Uniform Random Timer
- Constant Throughput Timer
- Synchronizing Timer
- JSR223 Time
- BeanShell Time
- BSF Time
- Poisson Random Time
7.6 Assertions
Assertions confirm the validity of the test plan by validating the response produced by a Sampler request. Basically assertions are similar to unit test assertions and check the quality of the tested application response. You can configure what kind of assertions is active for every test plan.
Here is a list of available assertions in JMeter:
- Bean shell Assertion
- BSF Assertion
- Compare Assertion
- JSR223 Assertion
- Response Assertion
- Duration Assertion
- Size Assertion
- XML Assertion
- BeanShell Assertion
- MD5Hex Assertion
- HTML Assertion
- XPath Assertion
- XML Schema Assertion
7.7 Configuration nodes
You can pass different parameters to the sampler requests by using configuration elements. They provide a way to create variables (different and dynamically) that can be used by the samplers afterwards. They are executed at the beginning of the node they belong to, before the samplers are executed, that is why the samplers can rely on these variables.
Here is a list of all the configuration nodes that can be used in JMeter:
- Counter
- CSV Data Set Config
- FTP Request Defaults
- HTTP Authorization Manager
- HTTP Cache Manager
- HTTP Cookie Manager
- HTTP Proxy Server
- HTTP Request Defaults
- HTTP Header Manager
- Java Request Defaults
- Keystore Configuration
- JDBC Connection Configuration
- Login Config Element
- LDAP Request Defaults
- LDAP Extended Request Defaults
- TCP Sampler Config
- User Defined Variables
- Simple Config Element
- Random Variable
7.8 Pre processors
Pre processors are elements (actions, assertions or basically whatever) that is going to happen before a sampler is executed. They can be used to extract variables from a response that can be used in the sampler afterwards via configuration elements.
These are the elements that can be used as pre processors:
- HTML Link Parser
- HTTP URL Re-writing Modifier
- HTTP User Parameter Modifier
- User Parameters
- JDBC PreProcessor
- JSR223 PreProcessor
- RegEx User Parameters
- BeanShell PreProcessor
- BSF PreProcessor
7.9 Post processors
Is basically an element that is executed after a sampler execution finishes. It can be used to parse the response data and extract values that can be used afterwards.
These elements can be used as post processors:
- Regular Expression Extractor
- XPath Extractor
- Result Status Action Handler
- JSR223 PostProcessor
- JDBC PostProcessor
- BSF PostProcessor
- CSS/JQuery Extractor
- BeanShell PostProcessor
- Debug PostProcessor
8. Test plan elements order of execution
A test plan elements are ordered and executed always in the following way:
1 – Configuration nodes
2 – Pre processors
3 – Timers
4 – Sampler
5 – Post processors (only executed if there are results available)
6 – Assertions (only executed if there are results available)
7 – Listeners (only executed if there are results available)
It is good to mention that a test plan can contain one or more test plans inside it and that this is a common practice to group tests by functional or technical logic together.
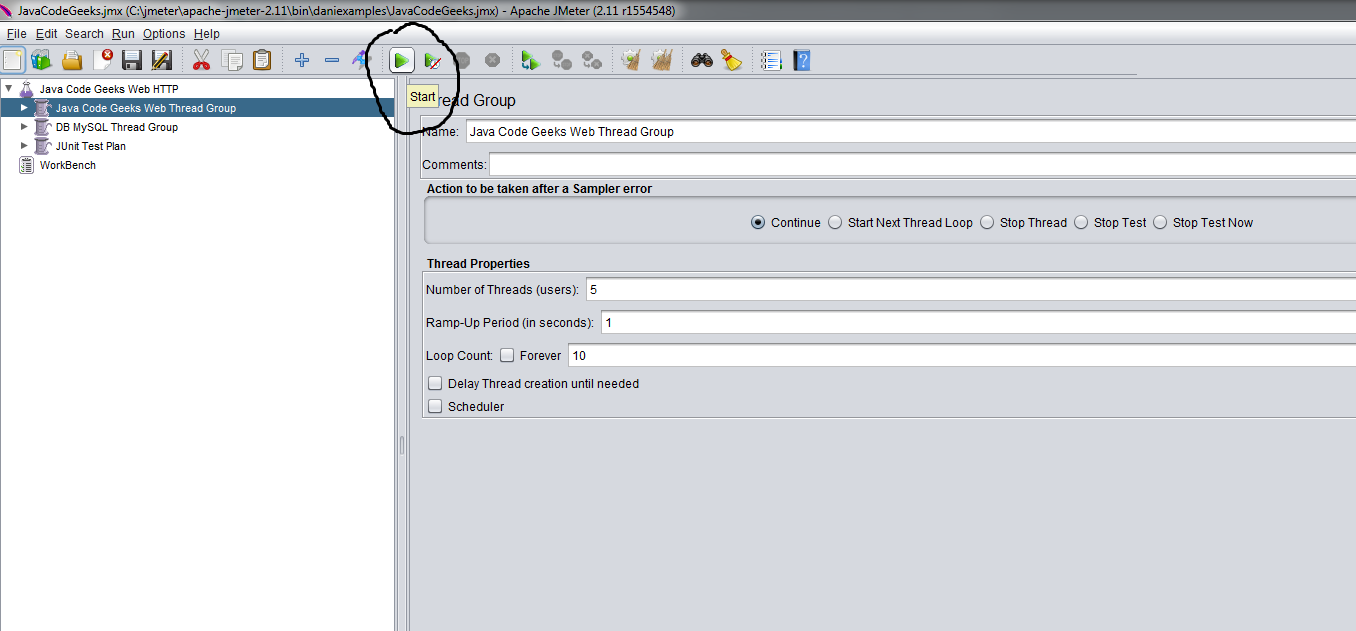
9. Run/Stop test plans
To run a test plan you just need to click in the "Play" button:
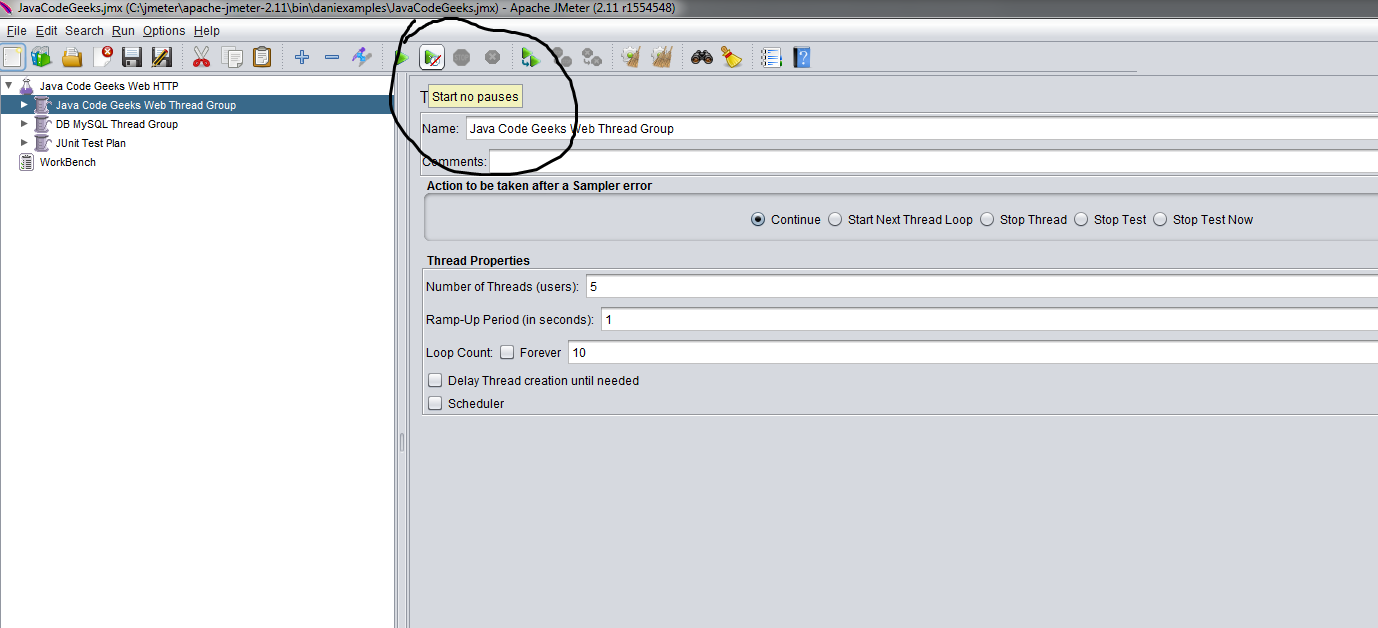
It is possible to start a test and ignore all the pauses by clicking in the button "Play no pauses"
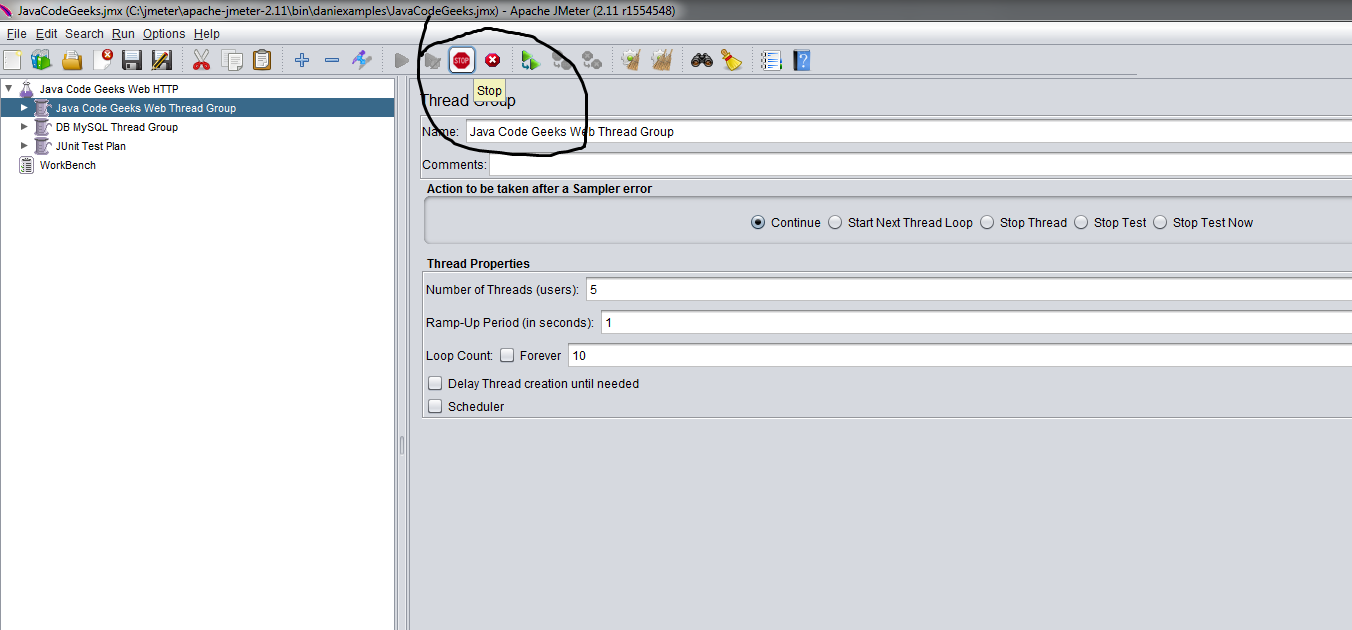
You can stop the test by clicking in the "Stop" button:
It is also possible to disable test plans for execution. To do this you just need to “toogle” the status of the test plan:
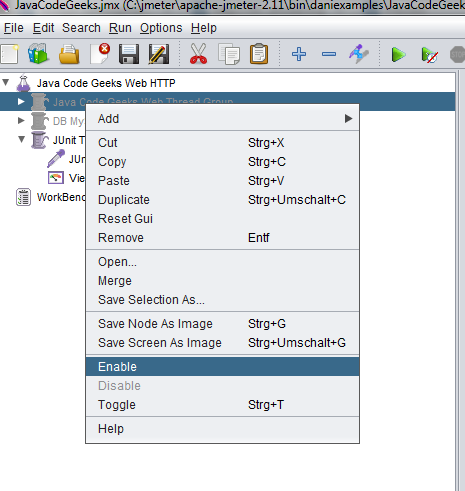
As you can see in the screen capture above, the disabled plans are rendered with grey color and they cannot be executed but they can be modified or reconfigured.
10. Web (HTTP) test plan
In this chapter we are going to see how to create a plan to test an specific web page via HTTP. For that purpose i will use the http://www.wikipedia.org site.
So enough theory, now we are going to see how to configure an HTTP request test plan.
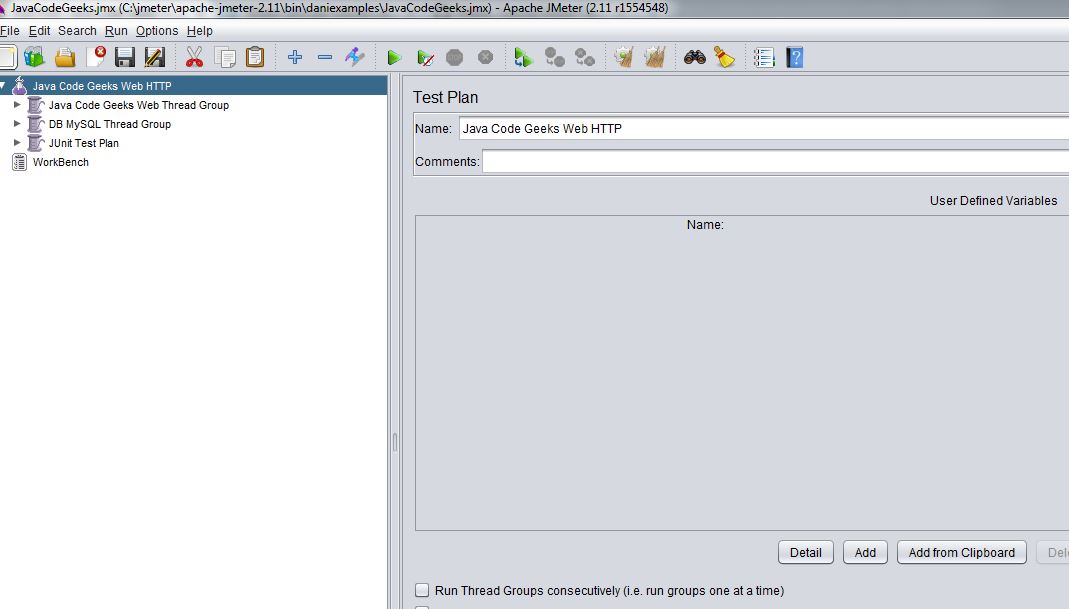
- Rename Test Plan to the name that you like
In this step is possible to configure the test plan in general terms affecting the behavior of Threads and you can add external libraries that should be used. We are not going to do that in this example.
- Add Thread Group
In this step you need to create a Thread group in charge of executing all the components of the test and configure its main properties: number of threads, ramp up period in seconds and number of iterations.
Context Menu over Test Plan -> Add -> Thread ->ThreadGroup
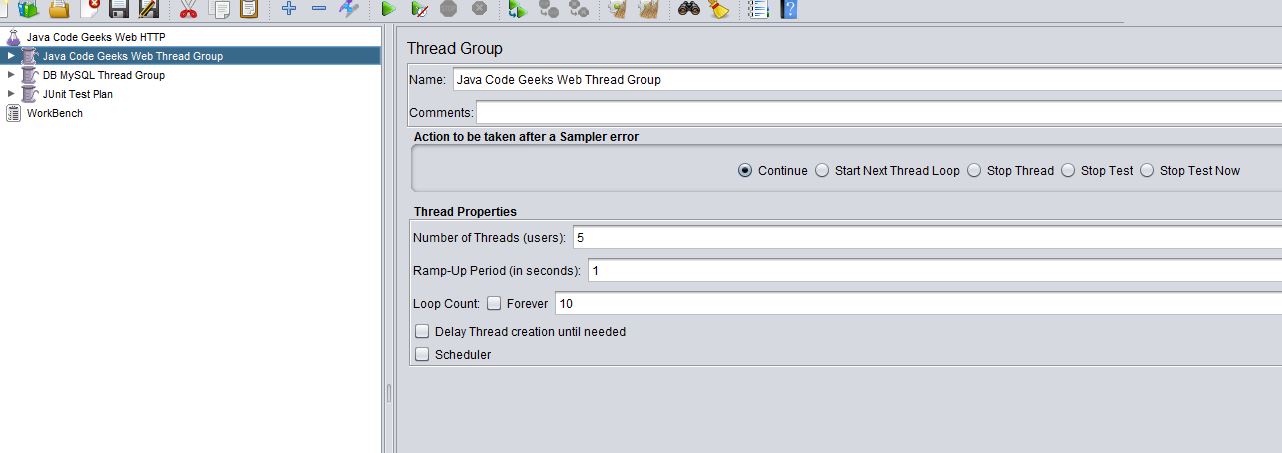
you can also specify the action you want to take in case of error (continue, stop, stop current Thread…)
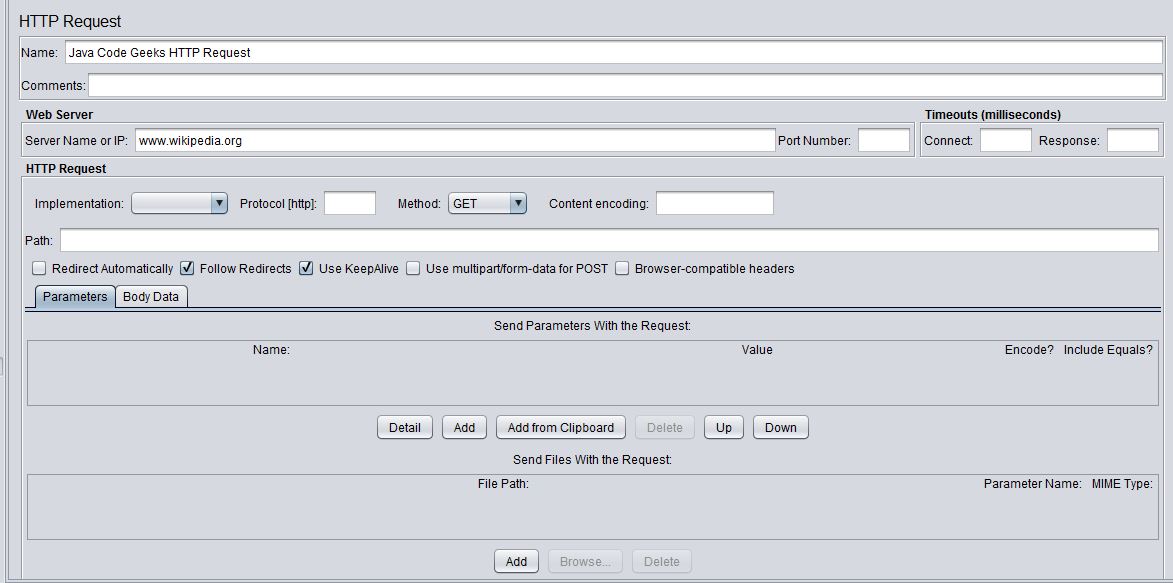
- Add Sampler HTTP Request
In this step we add the sampler with the information of the HTTP Request that we want to test:
Add Sampler->HTTP Request
We need to set different properties for this type of request:
Set the server name to the name of the server we want to test: www.wikipedia.org (without the http or https protocol) in this case. You should modify the connection values for port, protocol, method to execute in the server, etc. if needed, if our case this is not necessary. There are several parameters for configuring proxies, timeouts and different header information as well, but in our case, we leave everything with the default values
- Add Results Listener
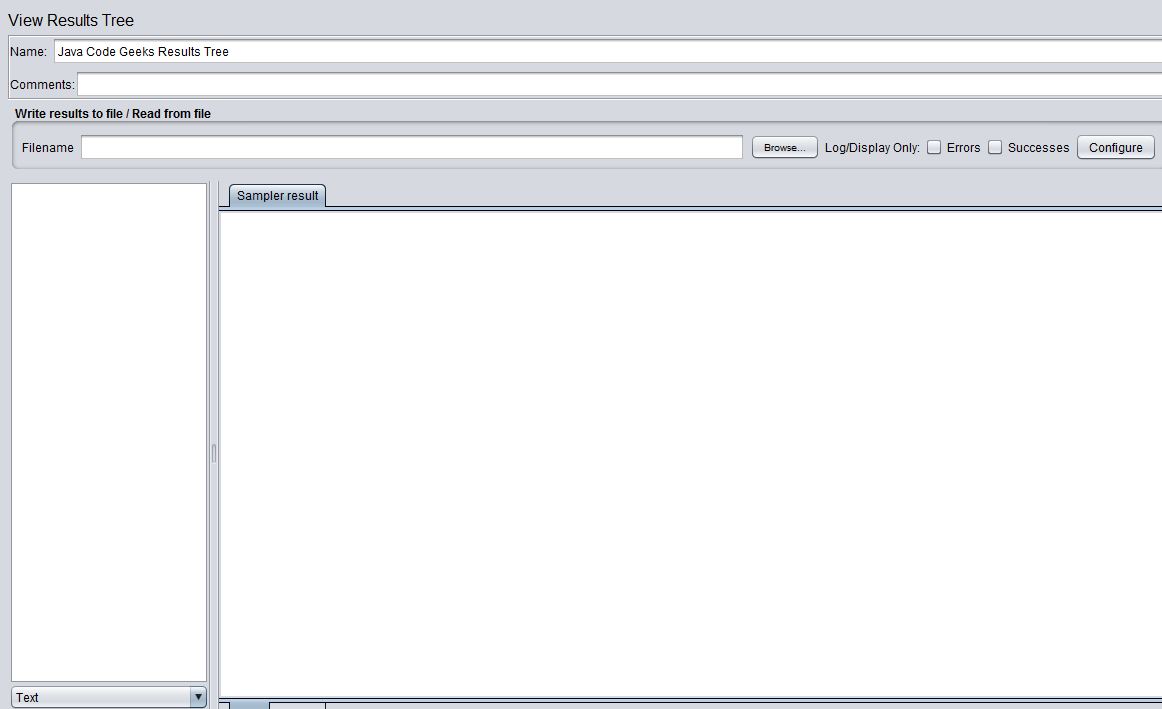
This is needed to be able to see the results afterwards; there are several possibilities as we saw before in this tutorial, for our HTTP Request test plan we are going to use a View Results Tree:
Add Listener -> View Results Tree
For our example, we do not change anything there and leave all the configuration properties with the default values.
- Save the test plan and Run it
File->Save (or click “Control + s”)
Run->Start (or click play as explained before)
- Check results in the listener
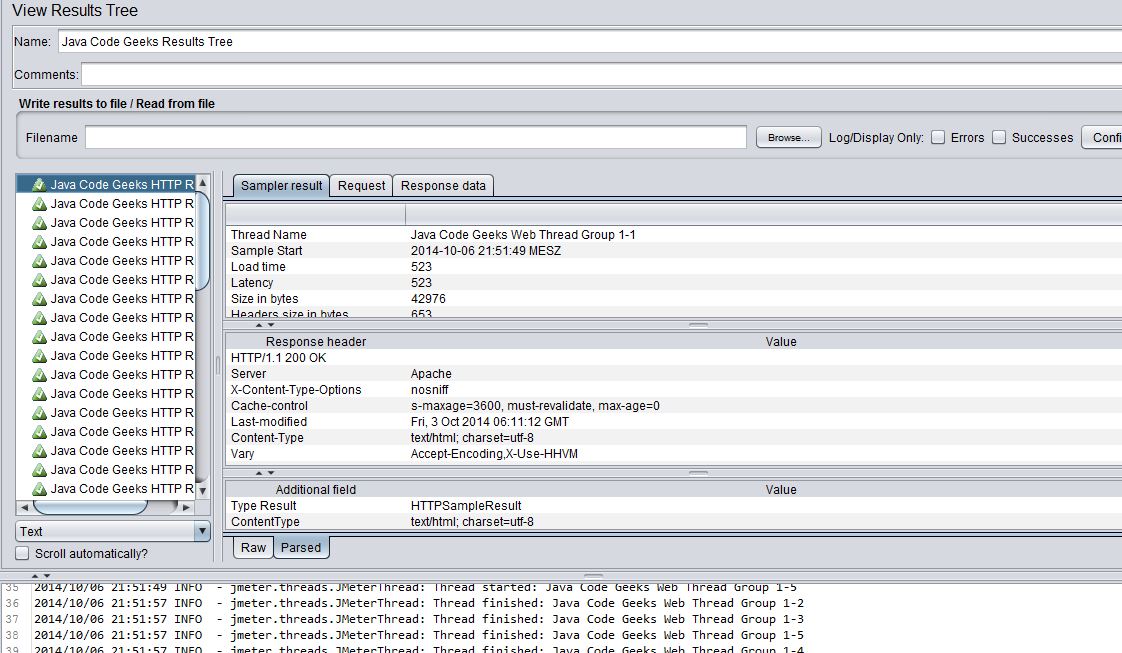
We can see that all the requests have been done as expected and all of them provide meaningful responses, so it seems that the web page that we are testing works fine (if this is the expected behavior). We can play around with the results and check all the returned data.
We have already configured a test plan that sends a bunch or requests to a given server and parses the responses. We are going to see now how to use other type of test components like Timers and Assertions.
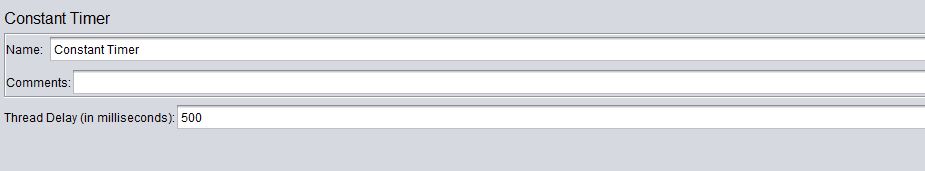
- Add a timer
In order to add a Timer we just right click on the test plan and add a timer:
Add Timer->Constant Timer
and we configure it with 500 miliseconds. Every request will wait 500 ms after the last one is finished.
- Add duration assertion
On the test plan, right click and add a duration assertion, we configure it to assert false if the response takes longer than 100 ms, and we configure it for the main sample only:
Add assertion->Duration assertion
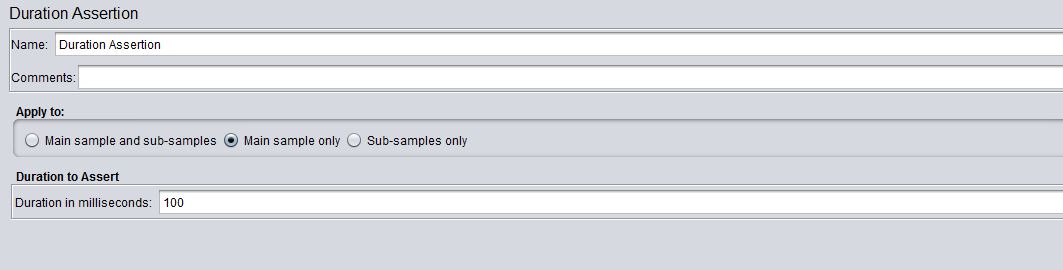
If we re run the test plan (after saving) we will see that we have some issues with this assertion:
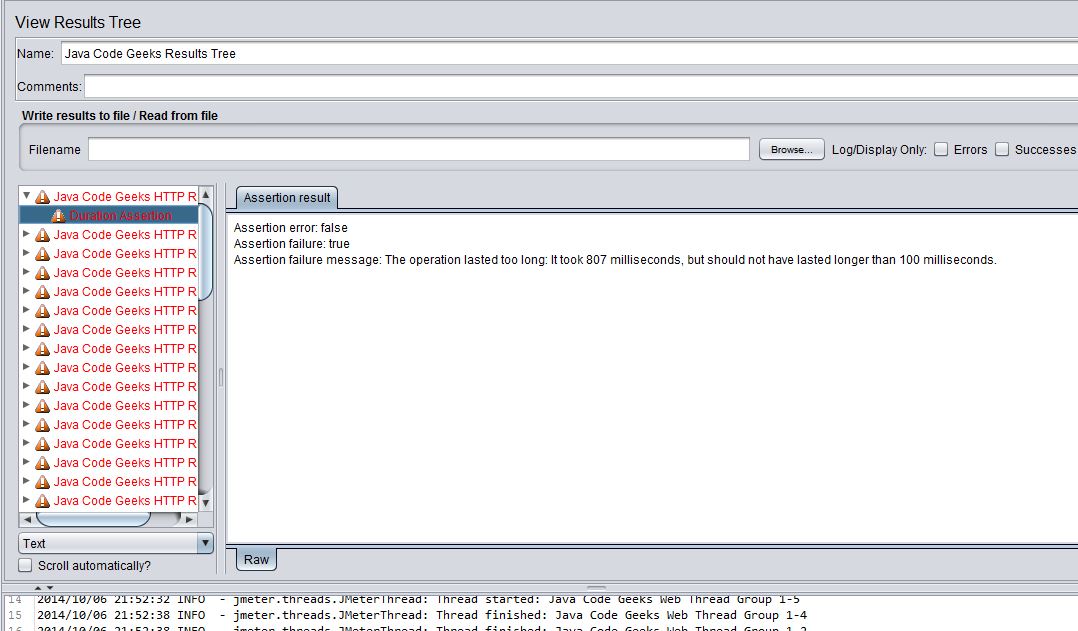
Obvioulsy this happens because we configure the duration assertion only with 100 ms, if we change this figure to 2000 ms almost all requests will be served on time.
- Add size assertion
Add assertion->Size Assertion
and we assure that the response has a size larger than 5000 bytes:
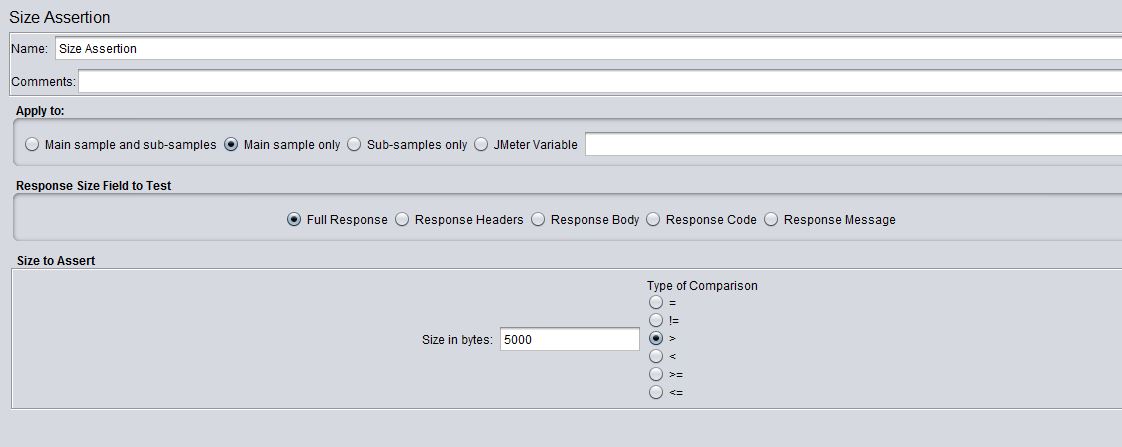
If we run the test we will see that the response is always larger than that, in case of an error response the size would be, probably, smaller and our assertion will fail.

11. Database test plan tutorial
Now we are going to see how to configure, run and analyze the results of a test against a MySQL Database. This example is about MySQL but it can be done using any other kind of DB like Oracle, MongoDB or others.
- Install MySQL
If you do not have MySQL installed in your computer, you can download it from http://dev.mysql.com/downloads/ and install the MySQL server, it is very easy.
- Download the MySQL driver
Download mysql connector (mysql-connector-java-5.1.6) and copy it in the lib directory of jmeter C:\jmeter\apache-jmeter-2.11\lib.
- Start MySQL
Start the DB server so that you can make queries against it.
- Create database
You can create a database as you want, here is just an example of a very simple one:
01 02 03 04 05 06 07 08 09 10 11 | create database jmeter;use jmeter;create table jmeter_stuff(id int, name varchar(50), description varchar(50));insert into jmeter_stuff(id, name, description)VALUES(1, "dani", "the boss");insert into jmeter_stuff(id, name, description)VALUES(2, "topo", "the worker");insert into jmeter_stuff(id, name, description)VALUES(3, "tupac", "the other"); |
- Create a test plan
Do the same actions as in the chapter before to create a test Plan using a new Thread Group, a new configuration element of the type JDBC configuration and a new request (sampler) of the type JDBC, add also a listener to parse and view the results in the same way as we did in the example before.
The only difference is the type of the sampler, in this case JDBC Sampler.
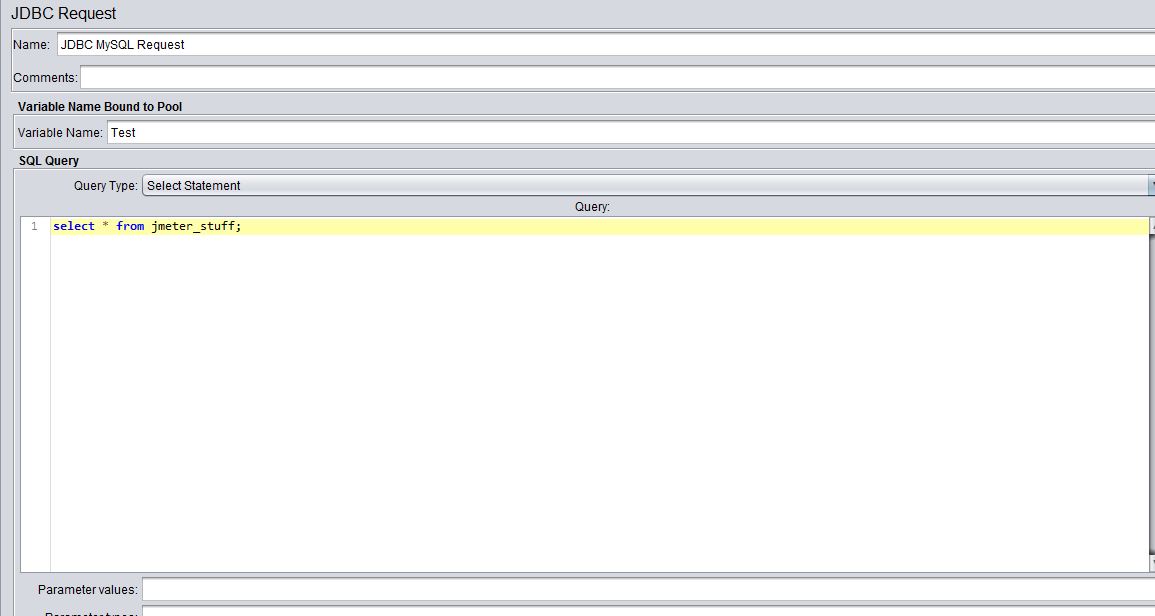
- JDBC Sampler
Give a meaningful name to the Variable Bound to Pool and write some SQL statement:
1 | select * from jmeter_stuff; |
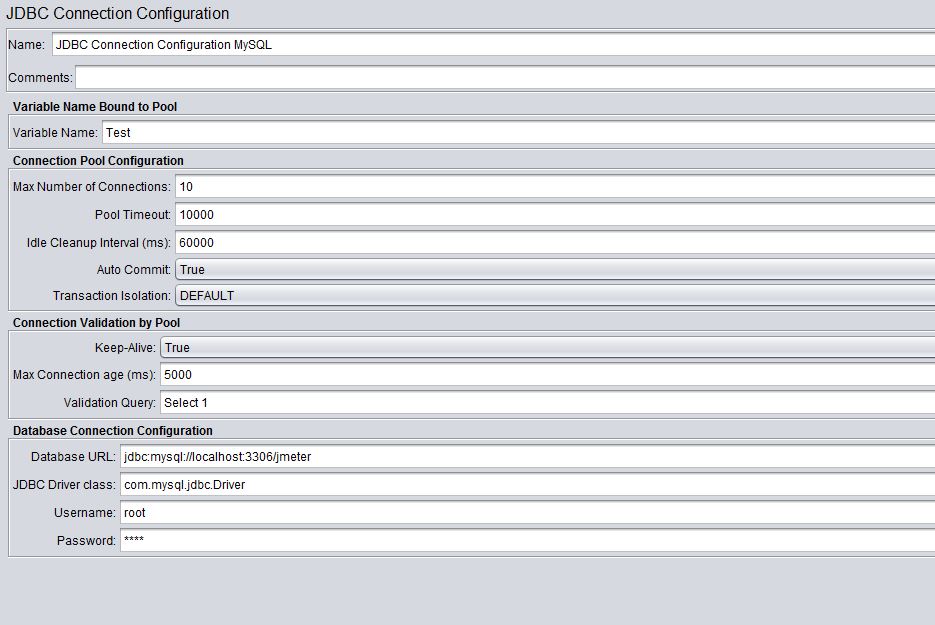
- JDBC Connection configuration
Add a new JDBC Connection Configuration to the sampler.
right click on the JDBC sampler -> add connection configuration
Change the parameters as follows:
1 2 3 4 5 6 7 | Variable Bound to Pool= same name as in the samplerDatabase URl=jdbc:mysql://localhost:3306/jmeterJDBC Driver class=com.mysql.jdbc.Driverusername=password=set username and password to your MySql credentials. |
- Save the plan and execute it.
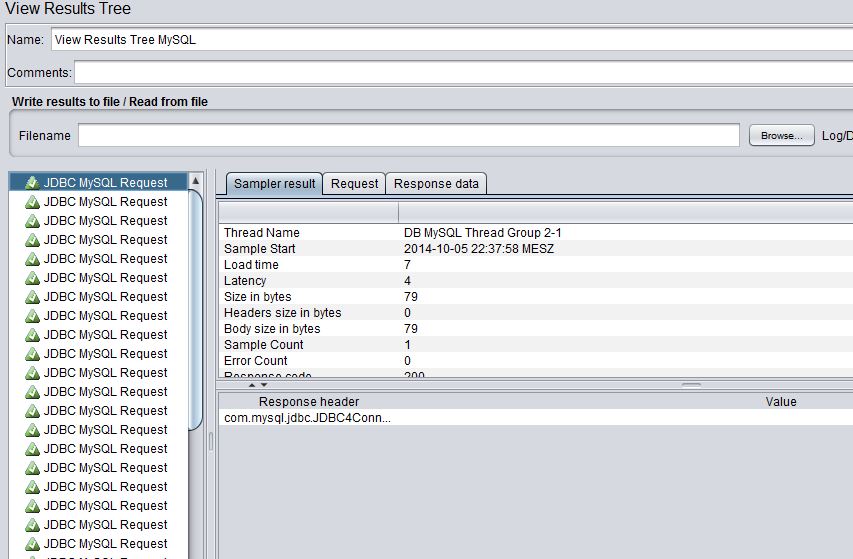
- View the results using the listener configured before.
You can verify and check the output in the same way as in the HTTP request test plan, you can also add preprocessors, post processors, assertions or any other kind of element that you may need.
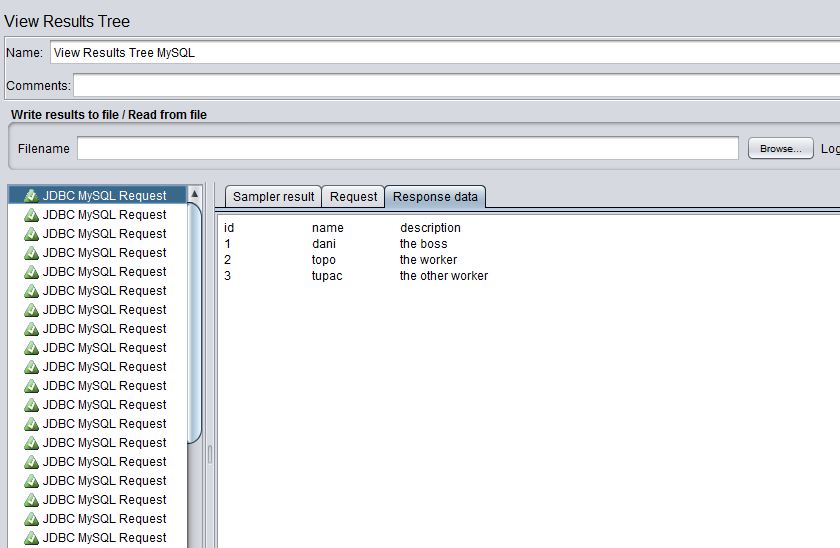
In this case the output is the results of the select statement.
You can use this kind of samplers for updating data as well by changing the SQL statement in the sampler configuration.
In the following screen capture is the basic information about the request response results:
12. Junit test plan
In this chapter we are going to explain how to use JMeter in combination with JUnit. This provides very strong mechanisms for executing functional tests from a load and performance point of view.
- First of all you need to create a Junit test like the following one:
01 02 03 04 05 06 07 08 09 10 11 12 13 14 15 16 17 18 19 20 21 22 23 24 25 26 27 28 29 30 31 32 33 34 35 36 | public class JMeterTest{ public JMeterTest() { // just for testing purposes System.out.println( "calling the constructor" ); } @Before public void setUp() throws Exception { // just for testing purposes System.out.println( "calling setup" ); } @After public void tearDown() throws Exception { // just for testing purposes System.out.println( "calling tearDown" ); } @Test public void testMe() { for( int i = 0; i < 30; i++ ) { // just asserting randomly in order to check what happens in each case int randomNumber = (int)( Math.random() * 100 ); System.out.println( randomNumber ); assertEquals( 0, randomNumber % 2 ); } }} |
This test mainly contains a couple of assertions in order to check how JMeter can use them, it is not the purpose of this tutorial to explain unit testing or JUnit in detail.
- Add test to JUnit directory
Package the unit test in a jar file and copy it into the directory jmeter/lib/junit. Ensure that the jar file contains the .class bytecode with the tests that you want JMeter to execute. At the end of this article you can find a java project with a pom.xml that you can directly use to generate a jar file that can be used by JMeter. You just need to compile the code:
1 | mvn compile |
Or you can export your project as JAR file including the bytecode and generated files directly in Eclipse or your favorite IDE.
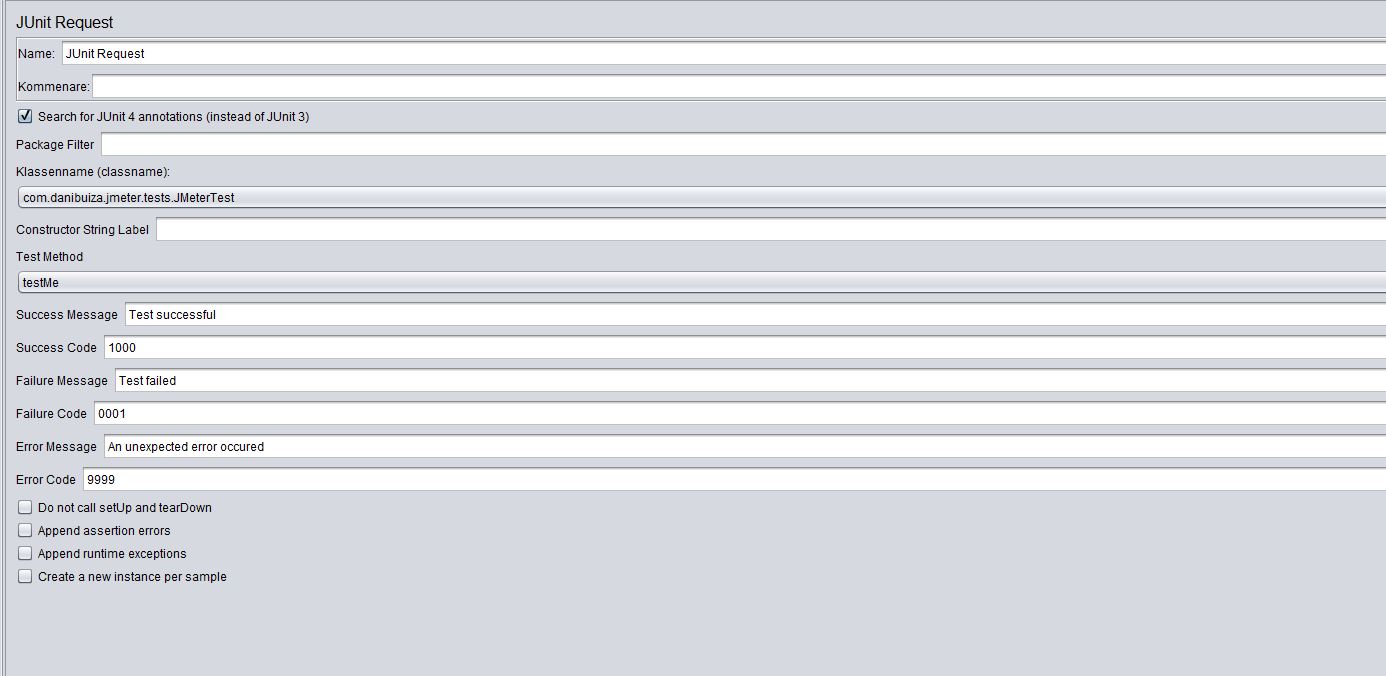
- Add a JUnit sampler request
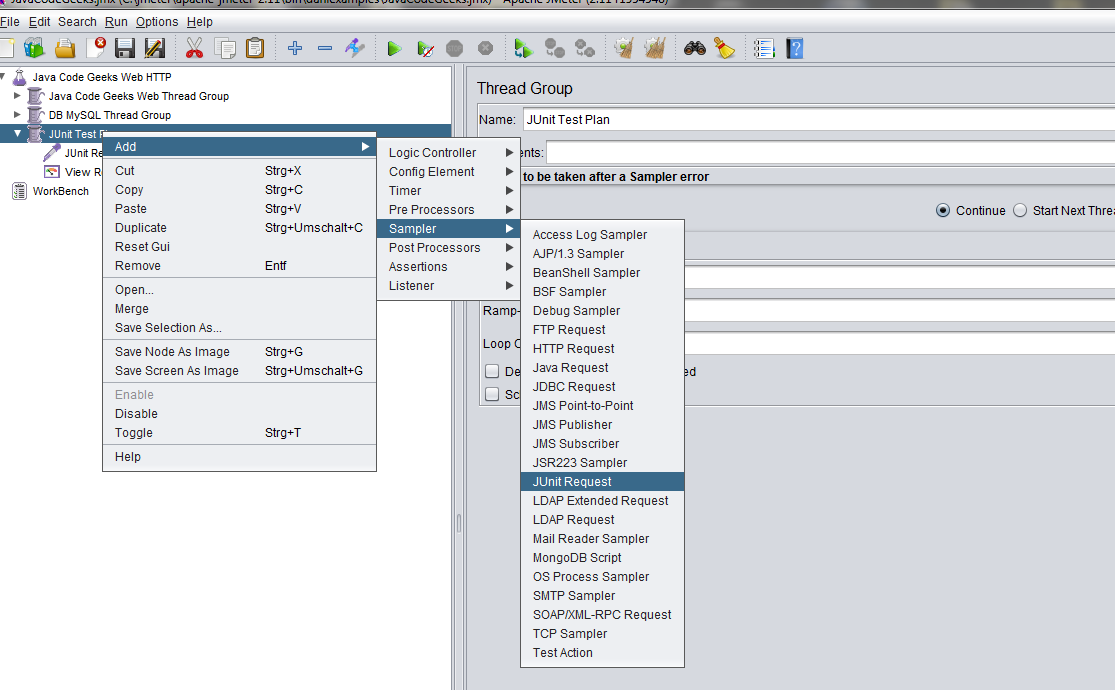
Create a test plan as we saw before and add a sampler of the type JUnit request: Add Sampler->Junit Request and configure it in order to execute the methods that you want from the test that you just created above.
In our case we are going to execute JUnit 4 based methods, but you can also do this using JUnit 3 by selecting the check box for this purpose.
- Add a listener to view results as we did in previous chapters
- Run the test plan
- View the results
Here we can see the results of the JUnit test that we have just created:
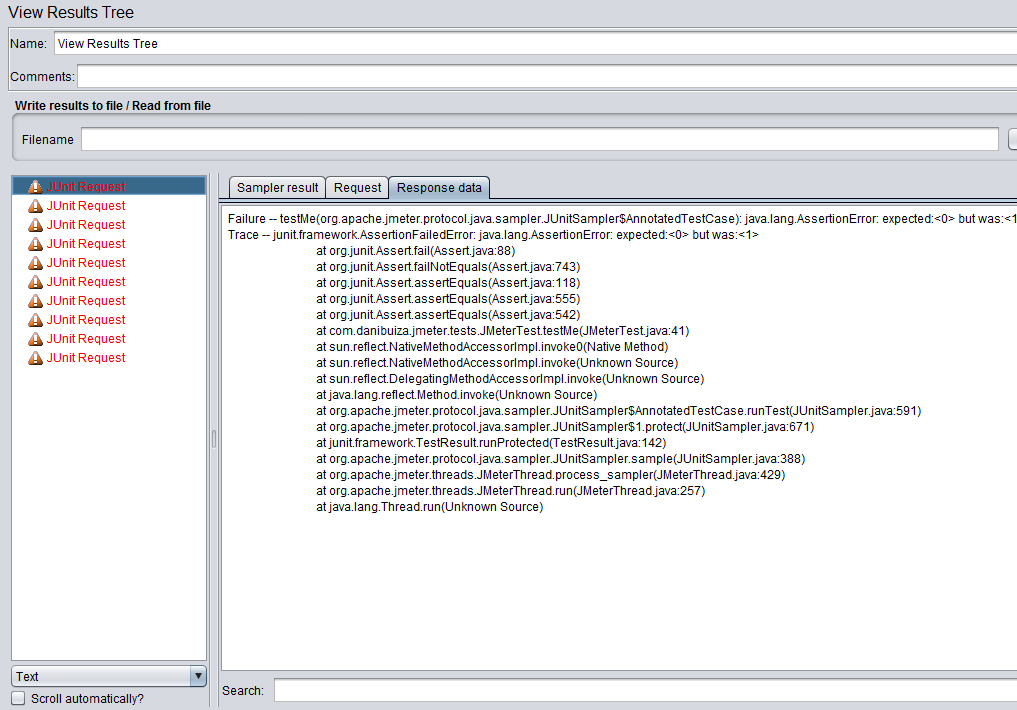
As we can see in the screenshot above, all our tests (1 test, 10 loops) failed. This is the expected behaviour since we wanted our test to fail. Actually the unit test that we just wrote has no functional meaning and it is useless. Its purpose is just to show how to configure JMeter to use these kind of unit tests.
The stuff explained in this chapter may be very helpful to test functional and business logic of application using JMeter with all the benefits that this application provides, it is also very interesting because it makes possible to combine all the Java language advantages with the multithreating capabilites of JMeter.
13. Recording HTTP tests
Now we are going to explain how to configure JMeter to record HTTP requests. In order to do that we need Firefox installed in our machine, I am using the version 32.
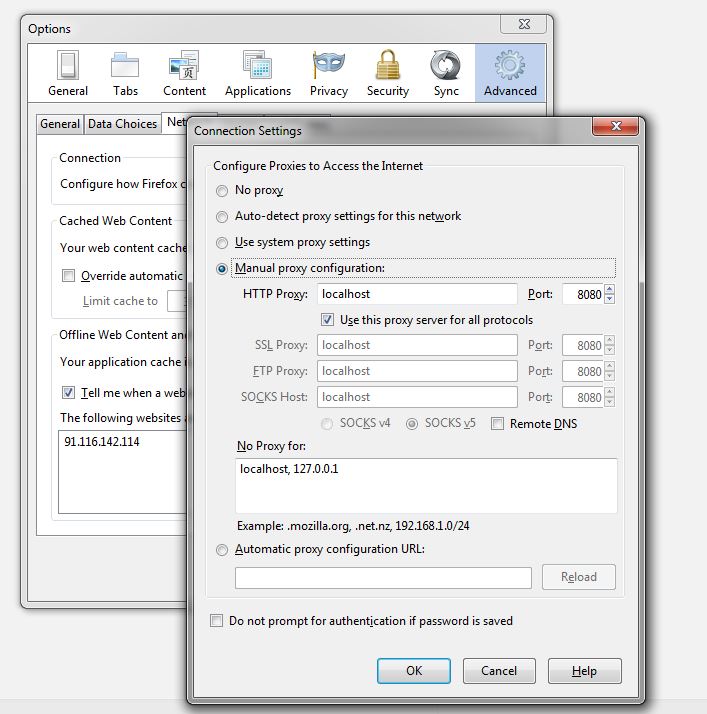
- Get Firefox to use the JMeter proxy
Go to your Firefox network settings and select the manual proxy option and set as server localhost and port 8080 (actually this deepens on your JMeter configuration). After that, check the option “Use this proxy server for all protocols”.
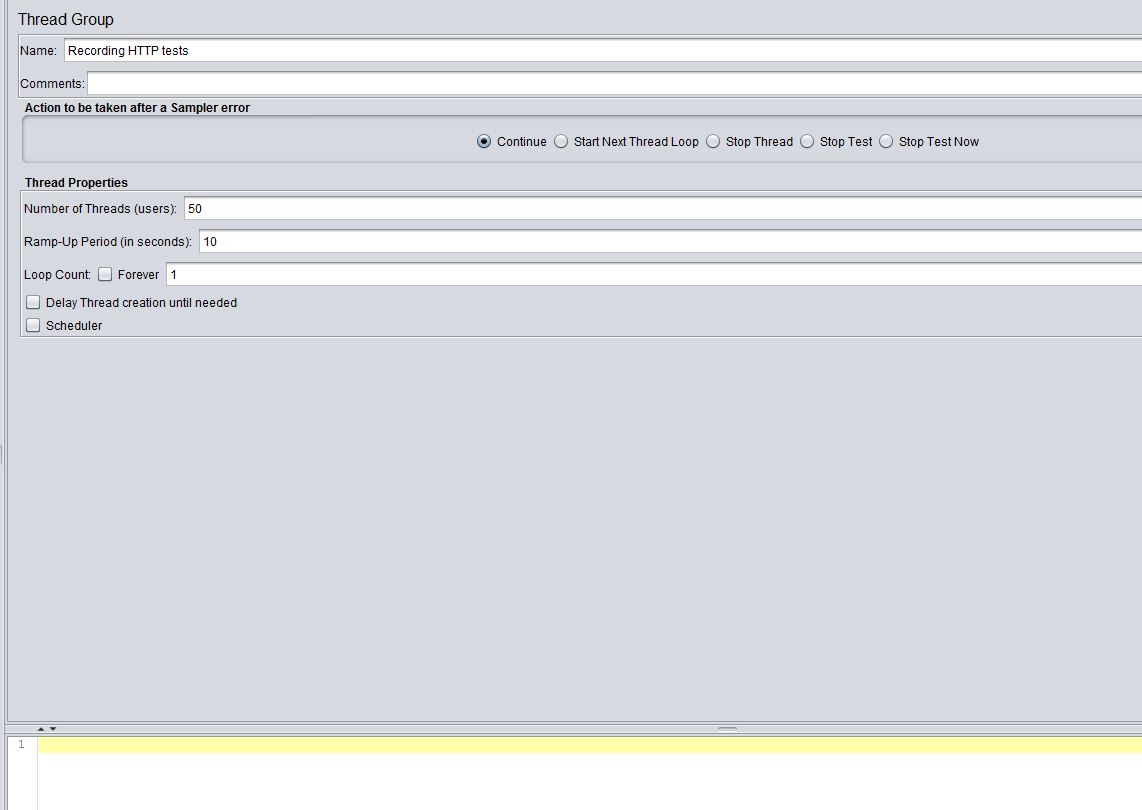
- First of all we create a test plan as we did before.
We add a new Thread Group and we give a name to it. We configure the Thread Group to have 50 threads, 10 seconds as ramp-up period and number of loops equals 1.
- Add HTTP Request Defaults.
On the Thread Group that we just created, we add a new Config Element and we select “HTTP Request Defaults”.
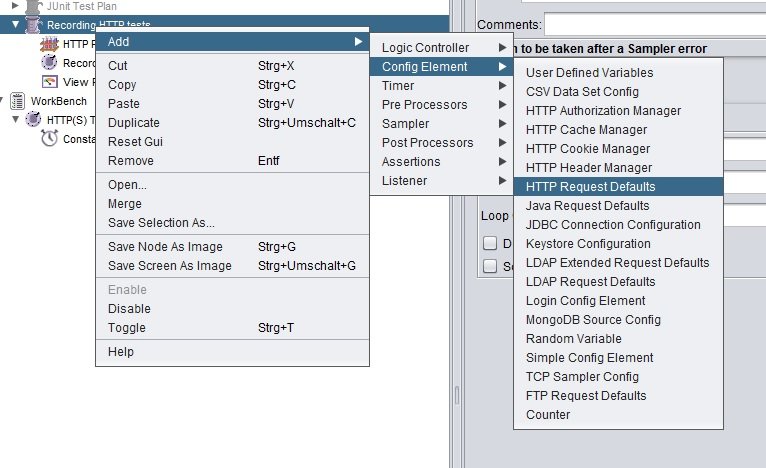
You should write here the server name that you want to test.
- Add Recording Controller
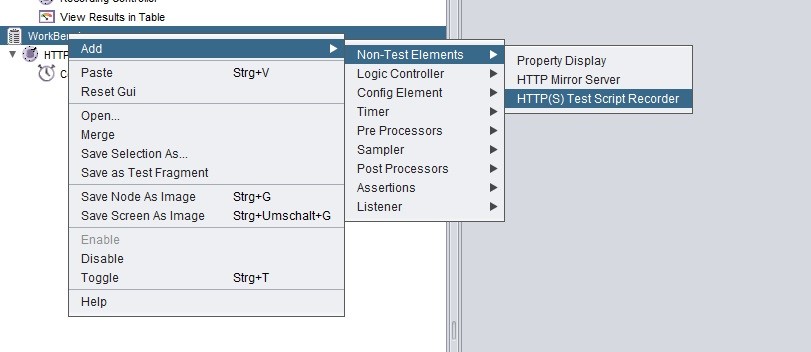
Now we add a recording controller to the workbench.
Select the workbench, not the test plan, and add a Non Test Element of the type “Test Script Recorder”.
You should now that the workbench has to be stored independtly from your test plan. Saving your test plan does not save the workbench.
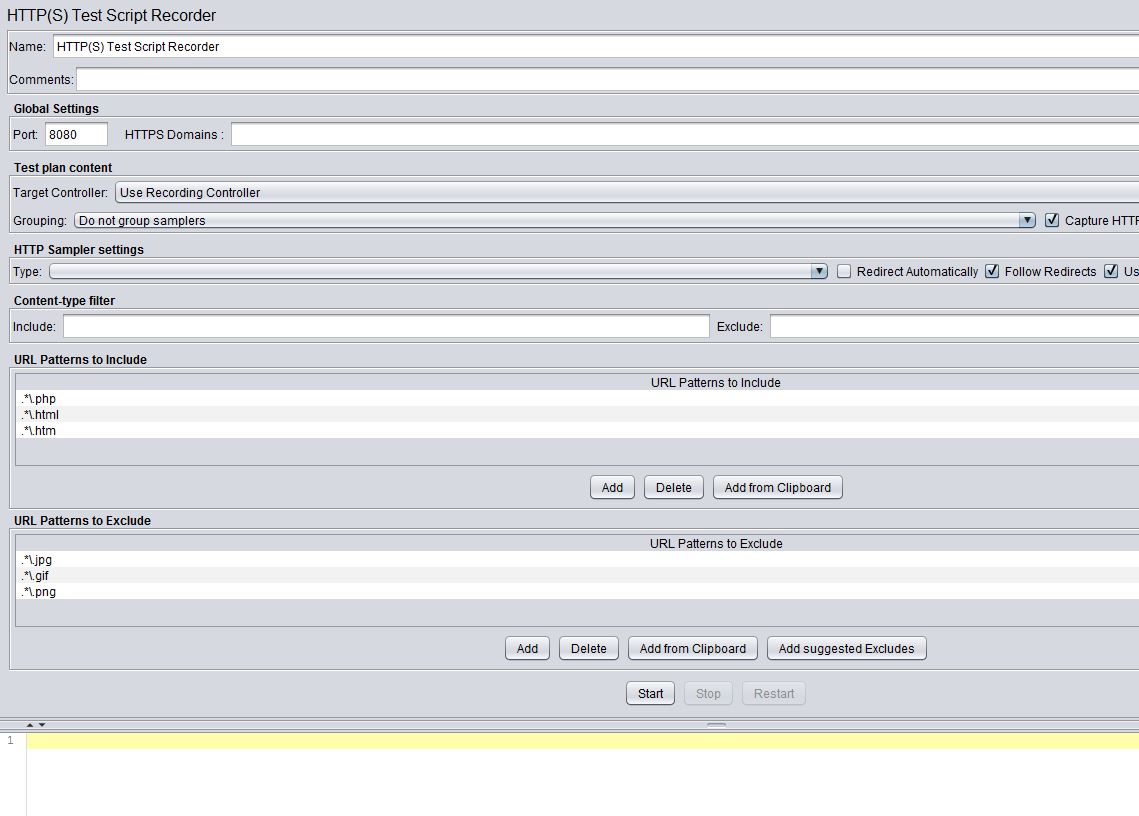
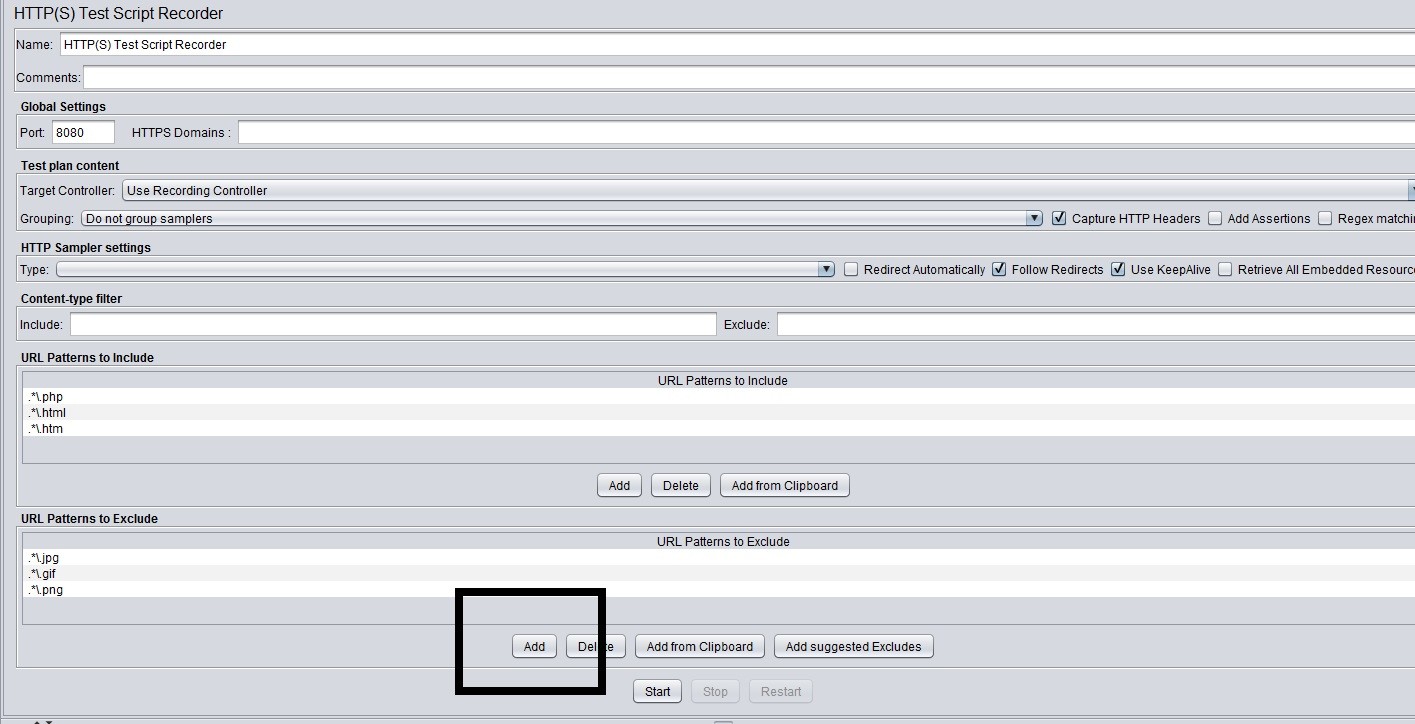
Configure the Recorder as follows:
- Add timer
If you want you can add a timer (constant) to your recorder, this timer will be used by each HTTP request that is recorded.
- Start recording
By clicking on the start button of the recorder, you will start the JMeter proxy server.
- Records should appear
If you go to a web page in order to make an example HTTP request, for example go to http://www.oviedin.com using Firefox (after configuring it as explained in the first step of this chapter) you will see that different entries appear under the Recording Controller in your test plan.
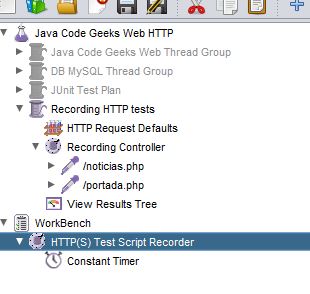
These records are actually HTTP requests that have been done while querying the web page mentioned before. Only records included in the filter configured in the Test Script Recorded will be stored. They can be reconfigured and used afterwards in your test plans.
14. JMeter Plugins
Different plugins are available for advanced users and use cases, some of them need extra installation, some not.
There are very useful plugins that allow to parse results using advanced options and analyze them using graphs and charts like http://jmeter-plugins.org/wiki/GraphsGeneratorListener/.
There are also available plugins in order to connect JMeter with your continuous integration tool and run JMeter test plans directly from the CI software like “https://wiki.jenkins-ci.org/display/JENKINS/Performance+Plugin” for Jenkins.
As i said the number of plugins is elevated and it is not possible to enumerate all of them, it is probably worth it to check if there is some plugins available in the internet before trying to implement yourself one on your own.
You can also create your own plugin for JMeter, but this is out of the scope of this article.
15. JMeter best practices
Before this article finishes we are going to write down a couple of very useful tricks and best practices:
- Although the JMeter UI is a very useful and intuitive tool for configuring and creating different test plans, experience users would like to use the non-GUI mode for executing them and storing their results.
You can do this by typing:
jmeter -n -t test.jmx -l test.jtl.
Assuming test is the test that you want to execute. You have to provide the complete path where your test is stored.
- Listeners are good to parse results, but they are also resource intensive and consume a lot of memory so it is good to use as few Listeners as possible in your configurations. The flag -l delete them all and it is recommended when listeners are not needed.
- Check the flag “View only errors” in the results tree view, probably you are only interested in checking what errors occurred during your tests.
- Use variables and loops in the same sampler instead of configuring several similar samples only differentiated by the variables and parameters that they are using.
- When creating Junit test plans it is recommended to provide meaningful error and assertion messages so that the JMeter output is as understandable as possible, this is a general recommendation when working with unit tests that applies completely in this case.
- Using Stop
(Control + '.'). This stops the threads immediately if possible. - Using Shutdown
(Control + ','). This requests the threads to stop at the end of any current work. Other tool tips are available at https://wiki.apache.org/jmeter/JMeterShortcuts.
16. Summary
So that is all.
We saw how to install JMeter and how to configure it for executing different kind of tests like HTTP requests, tests against databases and functional tests against Junit ones. There are many others kind of tests and possibilities offered with JMeter that are not covered in this tutorial. The objective of this tutorial is to give a whole description of the application and to show how to configure your first test plans.
We also explained the main parts of the JMeter UI and how to use it and also the test plan elements that come with JMeter out of the box.
In the last chapter we mentioned the possibility to expand JMeter with different Plugins; this is a very interesting point for experience users with advanced needs.
17. Download
18. Resources
- http://jmeter.apache.org/
- http://jmeter-plugins.org/
- href=”http://en.wikipedia.org/wiki/Software_performance_testing
- http://www.tutorialspoint.com/jmeter/
- http://jmeter.apache.org/usermanual/get-started.html (section 2.4.3 Non-Guide Mode)
- https://wiki.apache.org/jmeter/FrontPage

Very Useful Tutorial. Thanks for Sharing it.
Hello, I just wanted to thank you for the guide. Sadly, the download is not working anymore. Please reupload :)
Gave me enough information to start R&D, thanks a lot.
You didn’t show how to install the JSON parser for JMeter.
Really useful but need more details on using selenium web driver test and maven with jmeter
hello, first of all thanks for the tutorial, it’s very useful.
unfortunately as stated before the materials are not available for download, can you please re upload them?
thanks
Agree with previous posts. Please revise the page contents to either provision the JMeter PDF eBook download or remove this from the contents of the page. Otherwise it looks like the promise of a non-existent eBook is being used to drive an increase in the number of email subscribers to your newsletter.
Hello,
You have to subscribe to our newsletter in order to download the JMeter Ultimate Guide!
Example samples file is missing
Hi,
Thanks for this tutorial, it is very helpful.
Could you please let me know how to generate pass-fail test result (report) with Jmeter or is there any Maven plugin available to do this type of reporting (how may test cases are passed and how may failed) with Jmeter ?
Download Link PLease
Hello Muralidhar,
You need to join our newsletter here: http://eepurl.com/xRlkj
After you enter a VALID email address, you will need to verify your subscription.
A verification email will be sent to you and after you successfully verify your email,
you will get a final welcome email which will contain the links to download the ebooks!
Subscribed – no email received
Tried re-subscribing and got told already subscribed – no email received
Hello Roger,
I have manually activated your account. You can login now using your credentials by visiting https://www.javacodegeeks.com/login/
Then you can visit this page in order to access the JMeter Tutorial in pdf version https://www.javacodegeeks.com/minibook/jmeter-tutorial
Kind Regards,
Nataly Evagorou
Website Administrator
Please re upload the file.
Hello Revanth,
The link is now fixed.