1. Introduction
UML (Unified Modeling Language) is a visual modeling language used in software engineering to represent complex systems. It is a standardized language for visualizing, specifying, constructing, and documenting the artifacts of software systems. UML can be used to model various types of systems, including software, hardware, and business processes. It provides a rich set of notations for creating diagrams that can help to communicate complex ideas and designs to stakeholders. UML was developed by the Object Management Group (OMG) and has become a widely used standard in the software industry. It is continually evolving, with new versions and updates being released to improve its capabilities and usability.
2. Structural Diagrams
Structural diagrams are useful for modeling the structure of a system and can be used to document and communicate the architecture of a software system. They can be used to describe the organization of classes, objects, components, and nodes in a system, and the relationships between them. By creating structural diagrams, developers can ensure that a system’s components are properly organized and that the relationships between them are clearly defined.
2.1 Class Diagram
A class diagram is a type of structural diagram in UML that describes the structure of a system by showing its classes, attributes, operations, and relationships among objects.
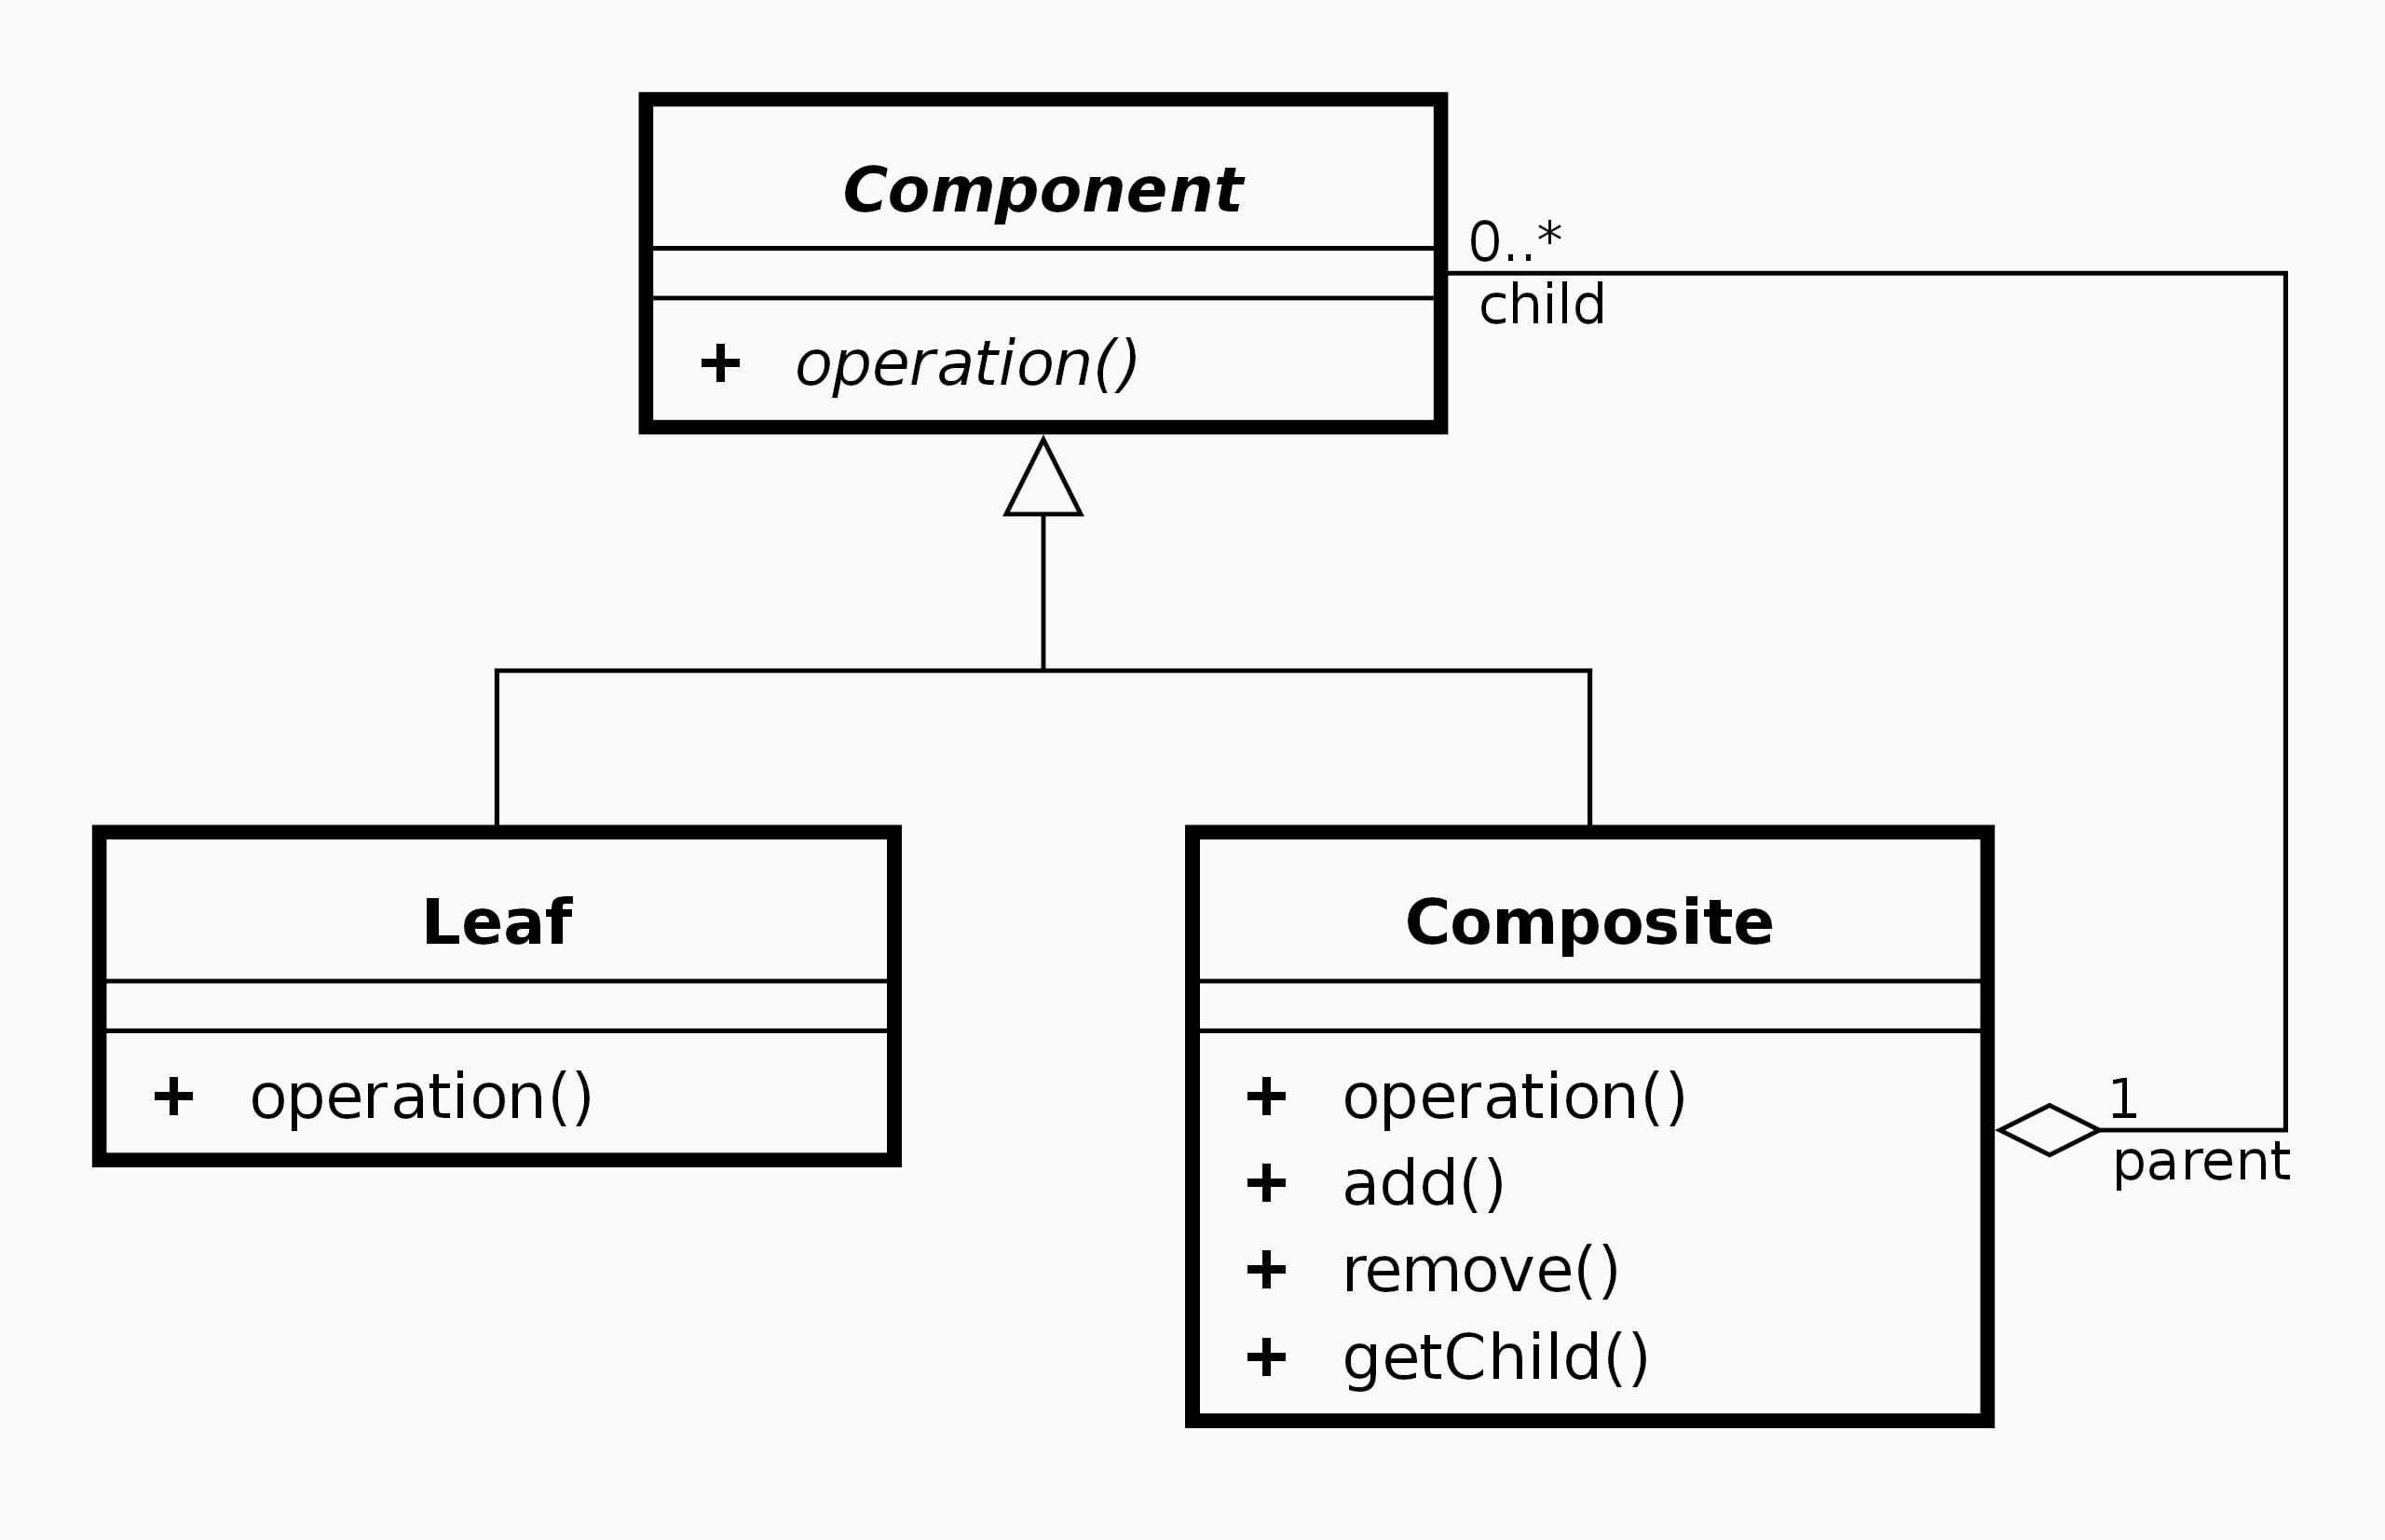
Here are some key elements of a class diagram:
| Element | Description |
| Class | A class represents a blueprint or template for creating objects. |
| Attribute | An attribute is a data element that describes the state of an object. |
| Operation | An operation is a function or behavior that an object can perform. |
| Visibility | The visibility of a class member (attribute or operation) determines whether it can be accessed from outside the class. |
| Relationship | A relationship represents an association between classes, such as inheritance, aggregation, or composition. |
Class diagrams can be used to model a wide range of systems, from simple to complex. They can help to clarify the relationships between different classes and show how they interact with each other. Class diagrams can also be used to generate code automatically, as well as to document the design of a system.
2.2 Object Diagram
An object diagram is a type of structural diagram in UML that displays a set of objects and their relationships at a specific point in time. It represents a snapshot of a system’s state, showing the objects and their attributes and relationships at a specific moment.
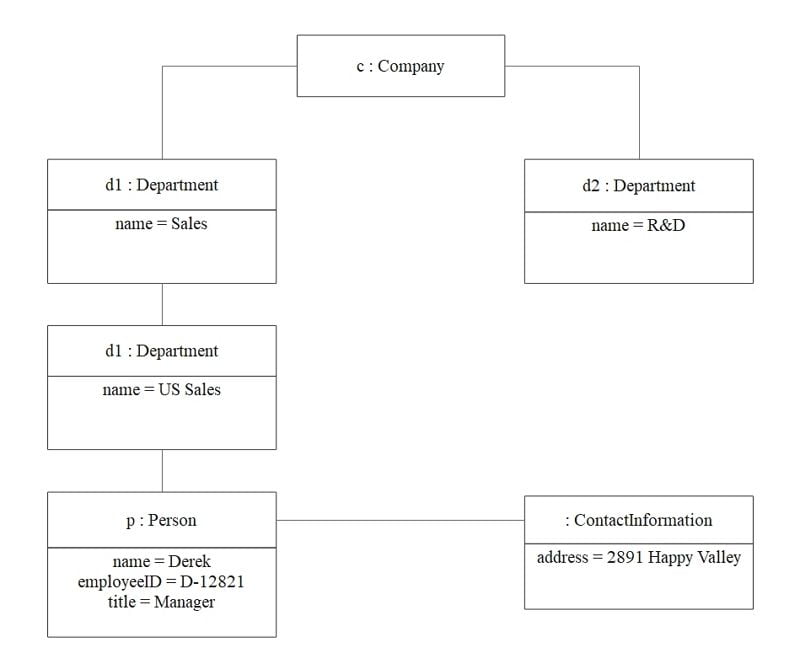
Here are some key elements of an object diagram:
| Element | Description |
| Object | An object represents an instance of a class at a particular point in time. |
| Attribute | An attribute is a data element that describes the state of an object. |
| Relationship | A relationship represents an association between objects, such as a composition or an aggregation. |
Object diagrams can be used to verify that a system’s design is correct by testing it against specific scenarios. They can also be used to identify issues and inconsistencies in the design of a system. Object diagrams can help developers to understand how different objects interact with each other, and how changes to one object can affect other objects in the system.
2.3 Component Diagram
A component diagram is a type of structural diagram in UML that depicts the organization of physical or logical components of a system. It shows the relationships between components and how they are connected to form a system.
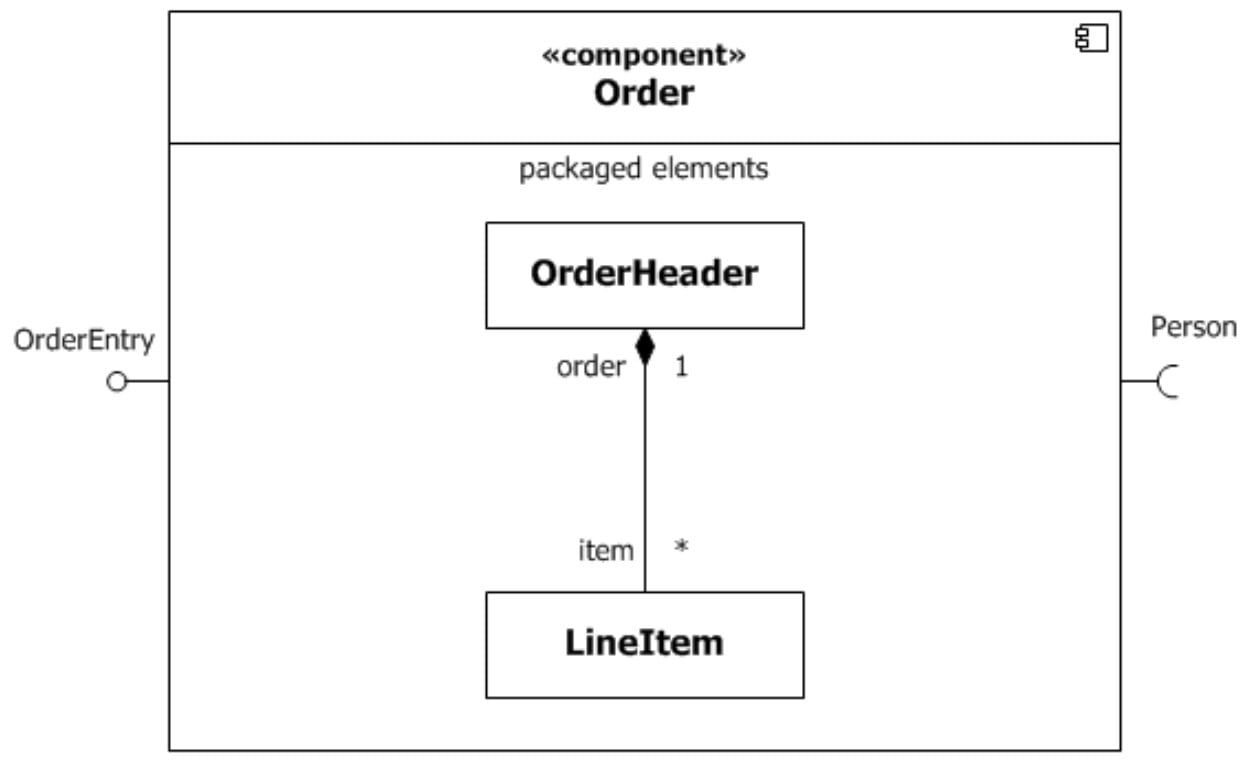
Here are some key elements of a component diagram:
| Element | Description |
| Component | A component represents a modular part of a system that encapsulates its behavior and data. |
| Interface | An interface is a set of operations that a component provides to its environment or to other components. |
| Relationship | A relationship represents an association between components, such as a dependency or a realization. |
| Connector | A connector is a communication mechanism that connects components and specifies how they interact with each other. |
Component diagrams can be used to model the architecture of a software system and to identify its component parts. They can also be used to specify the interfaces between components and to show how they communicate with each other.
2.4 Deployment Diagram
A deployment diagram is a type of structural diagram in UML that represents the configuration of the run-time processing nodes and the software components that reside on them. It shows the physical hardware and software components that make up a system and the relationships between them.
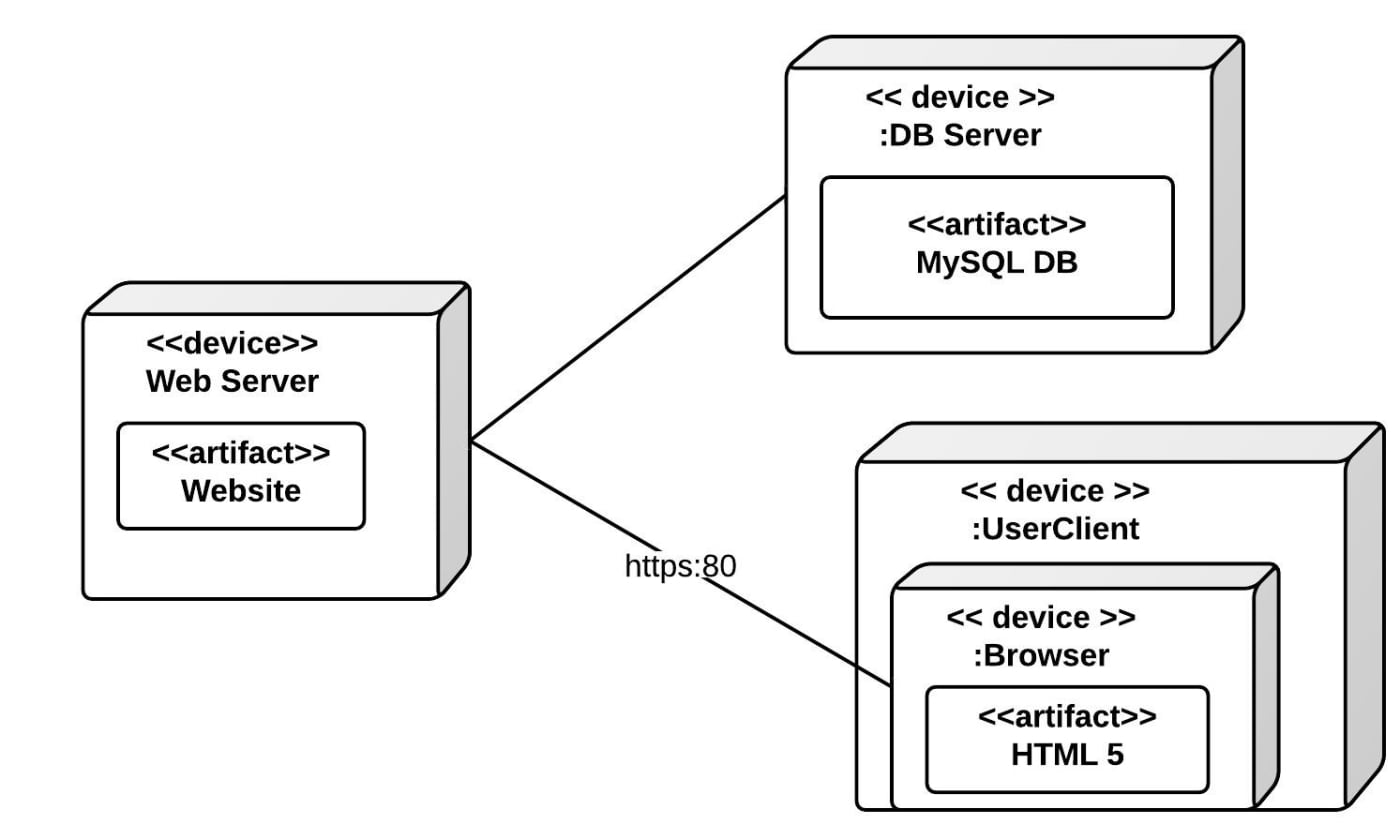
Here are some key elements of a deployment diagram:
| Element | Description |
| Node | A node represents a physical or logical processing element, such as a server, computer, or device. |
| Component | A component represents a modular part of a system that encapsulates its behavior and data. |
| Artifact | An artifact represents a physical file or software component that is stored on a node. |
| Relationship | A relationship represents an association between nodes, such as a communication path or a dependency. |
Deployment diagrams can be used to model the physical infrastructure of a software system and to identify the hardware and software components that make up the system. They can also be used to specify the deployment of software components across different nodes and to show how they communicate with each other.
3. Behavioral Diagrams
Behavioral diagrams are a type of UML diagram that describes the dynamic behavior of a system. They show how objects interact with each other and how the system responds to different events and conditions. Behavioral diagrams can be used to model the behavior of a system over time, such as during a use case scenario or a specific process.
3.1 Use Case Diagram
A use case diagram is a type of behavioral diagram in UML that describes the interaction between the system and its actors, showing how the system responds to different use cases. It shows the relationships between actors and use cases, and how the actors interact with the system to achieve specific goals.

Here are some key elements of a use case diagram:
| Element | Description |
| Actor | An actor is a person, group, or system that interacts with the system to achieve a goal. |
| Use Case | A use case represents a specific functionality or feature of the system that provides value to its actors. |
| Relationship | A relationship represents an association between an actor and a use case, such as an association or an include relationship. |
Use case diagrams can be used to identify the different actors that interact with a system and the different use cases that the system supports. They can also be used to identify the different scenarios that actors may encounter when using the system, and to show how the system responds to these scenarios.
3.2 Activity Diagram
An activity diagram is a type of behavioral diagram in UML that depicts the flow of activities or processes in a system, such as business processes or software algorithms. It shows the sequence of activities and the conditions under which they occur, as well as the decision points and outcomes of each activity.
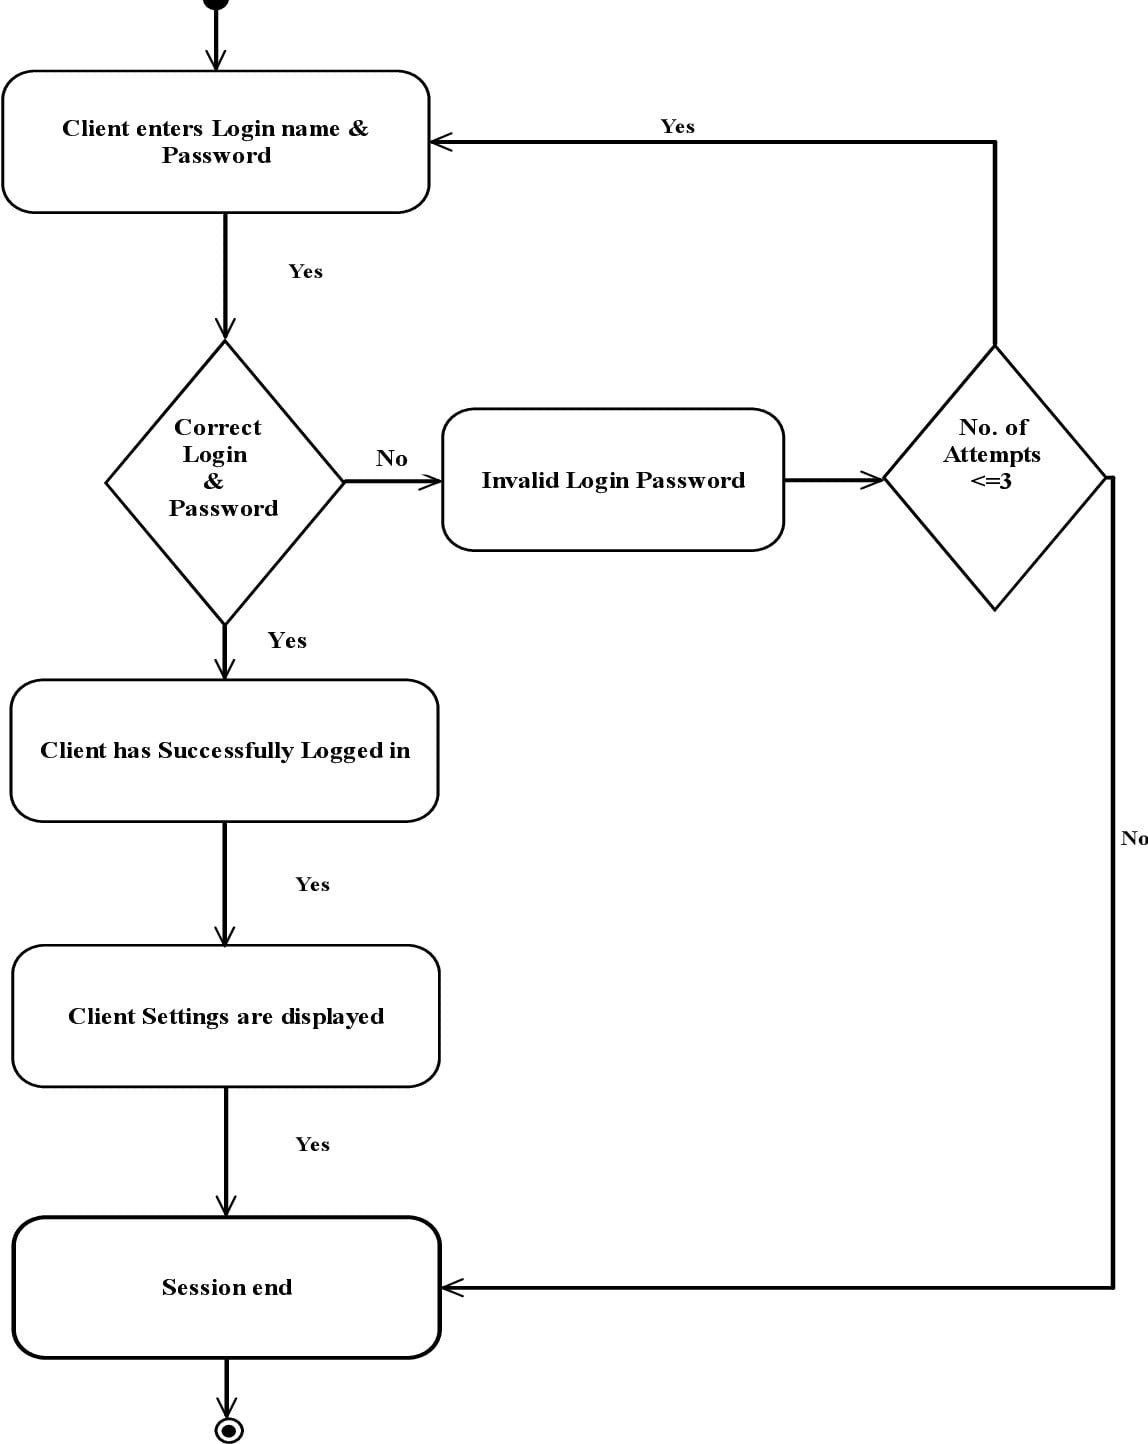
Here are some key elements of an activity diagram:
| Element | Description |
| Activity | An activity represents a specific action or task that is performed in the system. |
| Control flow | Control flow represents the order in which activities are performed and the conditions under which they occur. |
| Decision node | A decision node represents a point in the activity where a decision must be made based on a specific condition. |
| Merge node | A merge node represents a point in the activity where the control flow is combined from multiple paths. |
Activity diagrams can be used to model complex workflows, such as business processes or software algorithms. They can help developers to understand the flow of activities in a system and to identify potential issues and areas for improvement.
3.3 State Machine Diagram
A state machine diagram is a type of behavioral diagram in UML that shows the different states of an object and how it transitions between them in response to events. It models the behavior of an object over time and shows how it responds to different stimuli or conditions.
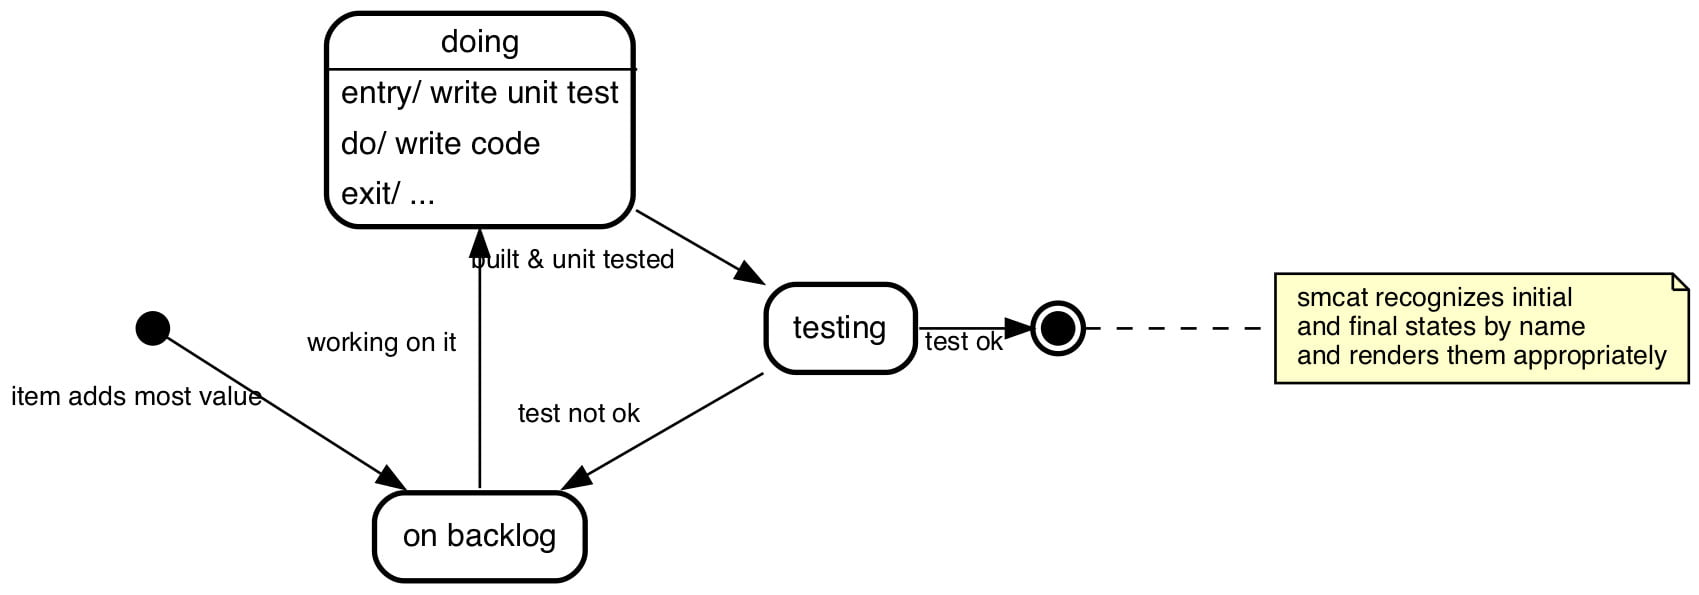
Here are some key elements of a state machine diagram:
| Element | Description |
| State | A state represents a condition or mode of an object, such as “on” or “off”. |
| Transition | A transition represents the change from one state to another in response to a specific event or condition. |
| Trigger | A trigger represents the event or condition that causes a transition to occur. |
| Guard condition | A guard condition represents a constraint or condition that must be met for a transition to occur. |
State machine diagrams can be used to model the behavior of objects in a system and to identify potential issues and areas for improvement. They can help developers to ensure that the behavior of an object is well-defined and consistent.

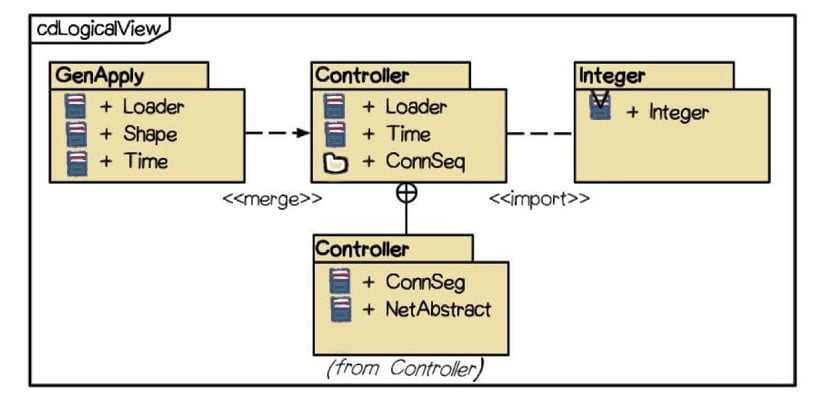
3.4 Package Diagram
A package diagram is a type of structural diagram in UML that shows the organization of elements into packages. It depicts the dependencies between packages and the relationships between the elements within them.
Here are some key elements of a package diagram
| Element | Description |
| Package | A package is a container for a group of related elements, such as classes, interfaces, or other packages. |
| Dependency | A dependency represents a relationship between two packages, where one package depends on the other for its functionality. |
| Association | An association represents a relationship between two elements within a package, such as a class and an interface. |
| Package merge | A package merge represents the merging of two or more packages into a single package. |
Package diagrams can be used to organize the elements of a system into logical groups and to identify the dependencies between these groups. They can help developers to manage the complexity of a system by breaking it down into smaller, more manageable parts.
4. Interaction Diagrams
Interaction diagrams are a type of behavioral diagrams in UML that describe the interactions between objects or components in a system. There are two main types of interaction diagrams: sequence diagrams and communication diagrams.
4.1 Sequence Diagram
A sequence diagram is an interaction diagram in UML that shows the interactions between objects or components in a time-ordered sequence. It depicts the sequence of messages exchanged between the objects and the order in which they occur.

Here are some key elements of a sequence diagram:
| Element | Description |
| Object | An object represents an instance of a class or component that participates in the interaction. |
| Lifeline | A lifeline represents the time period during which an object exists and participates in the interaction. |
| Message | A message represents a communication between two objects, such as a method call or a response. |
| Activation | An activation represents the period of time during which an object is executing a method call. |
Sequence diagrams can be used to model the interactions between objects in a system and to identify potential issues and areas for improvement. They can help developers to understand the sequence of events that occur during a particular interaction and to ensure that the system behaves as expected.
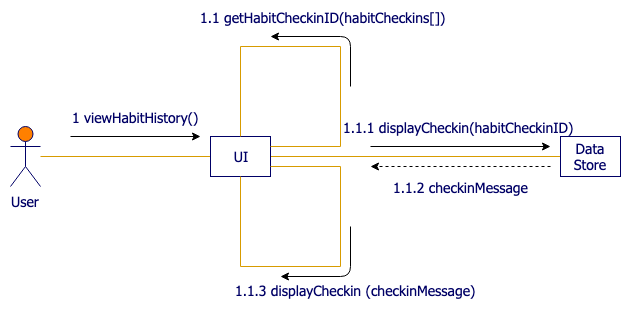
4.2 Communication Diagram
A communication diagram is an interaction diagram in UML that shows the interactions between objects or components in a system. It focuses on the relationships between the objects and the messages they exchange. Communication diagrams are also known as collaboration diagrams.
Here are some key elements of a communication diagram:
| Element | Description |
| Object | An object represents an instance of a class or component that participates in the interaction. |
| Link | A link represents a connection between two objects and the messages they exchange. |
| Message | A message represents a communication between two objects, such as a method call or a response. |
| Self-message | A self-message represents a message sent by an object to itself. |
Communication diagrams can be used to model the interactions between objects in a system and to identify potential issues and areas for improvement. They can help developers to understand the relationships between objects and the messages they exchange, and to ensure that the system behaves as expected.
4.3 Timing Diagram
A timing diagram is a type of interaction diagram in UML that shows how objects in a system interact with each other over time. It is used to depict the timing constraints between messages exchanged between objects or components.
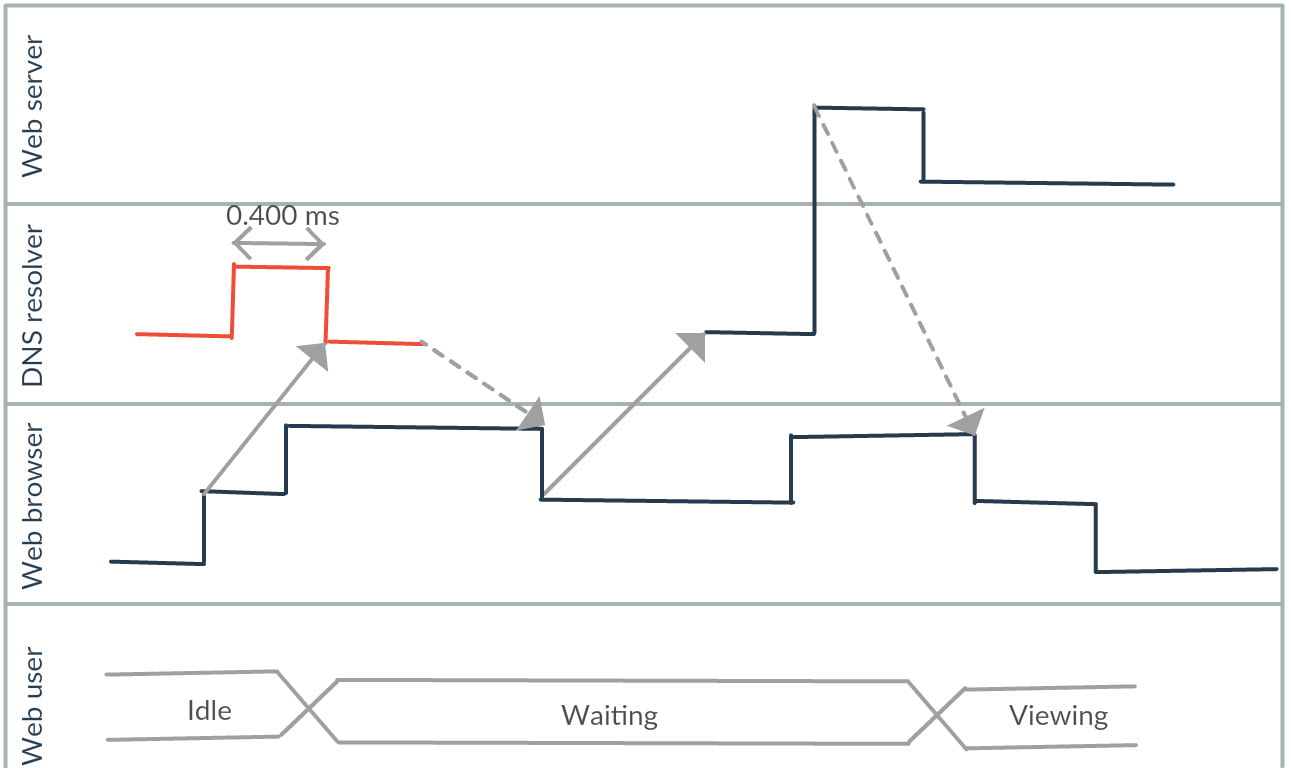
Here are some key elements of a timing diagram:
| Element | Description |
| Object | An object represents an instance of a class or component that participates in the interaction. |
| Lifeline | A lifeline represents the time period during which an object exists and participates in the interaction. |
| Message | A message represents a communication between two objects, such as a method call or a response. |
| Duration constraint | A duration constraint represents a constraint on the amount of time a message can take to execute. |
Timing diagrams can be used to model the interactions between objects in a system and to identify potential issues and areas for improvement related to timing. They can help developers to understand the timing constraints between messages and to ensure that the system meets its timing requirements.
4.4 Interaction Overview Diagram
An interaction overview diagram is a type of interaction diagram in UML that shows a high-level view of the interactions between objects or components in a system. It is used to model complex interactions between multiple objects or components and to simplify their representation.

Here are some key elements of an interaction overview diagram:
| Element | Description |
| Interaction | An interaction represents a sequence of actions or messages that occur between objects or components in the system. |
| Interaction fragment | An interaction fragment represents a part of an interaction that can be reused or repeated. |
| Decision node | A decision node represents a point in the interaction where a decision needs to be made based on some condition. |
| Merge node | A merge node represents a point in the interaction where multiple control flows converge into a single flow. |
Interaction overview diagrams can be used to model complex interactions between objects or components in a system and to simplify their representation. They can help developers to understand the overall structure of an interaction and to identify potential issues and areas for improvement.
5. Popular UML Software
These UML software tools are popular among developers and teams for modeling software systems using UML diagrams. They provide various features and capabilities to support software design, development, and documentation, as well as team collaboration and project management.
| Software | Description |
| Visual Paradigm | A comprehensive UML modeling tool that supports all UML diagram types and provides various features for software development, project management, and team collaboration. |
| Sparx Systems Enterprise Architect | A powerful UML modeling tool that supports all UML diagram types and provides a range of features for software design, development, and documentation. |
| IBM Rational Software Architect | A UML modeling tool that supports all UML diagram types and provides features for software design, development, and testing. It also supports integration with other IBM software products. |
| Lucidchart | A cloud-based UML modeling tool that supports all UML diagram types and provides collaboration features for team members to work together in real-time. |
| StarUML | An open-source UML modeling tool that supports all UML diagram types and provides basic features for software design and development. |
| Gliffy | A cloud-based UML modeling tool that supports all UML diagram types and provides collaboration features for team members to work together in real-time. It also integrates with other software tools like JIRA and Confluence. |
| MagicDraw | A UML modeling tool that supports all UML diagram types and provides a range of features for software design, development, and documentation. It also supports integration with other software tools and frameworks. |
| PlantUML | An open-source UML modeling tool that uses a simple text-based syntax to generate UML diagrams. It supports all UML diagram types and can be integrated into various software tools and frameworks. |
| Creately | A cloud-based UML modeling tool that supports all UML diagram types and provides collaboration features for team members to work together in real-time. It also integrates with other software tools like Trello and Google Drive. |
| Astah | A UML modeling tool that supports all UML diagram types and provides features for software design, development, and documentation. It also supports integration with other software tools and frameworks. |
| UMLet | An open-source UML modeling tool that provides a simple drag-and-drop interface for creating UML diagrams. |

i found it very interesting