1. Introduction
In the third part of this series of articles about real-time stream processing we learned how to import the .json flight data files to ElasticSearch using its bulk API as well as its low-level and high-level REST APIs.
In this article we will introduce yet another way, Logstash.
2. What is Logstash
Logstash is an open-source data collection engine with real-time pipelining capabilities. It receives data from multiple sources, performs data processing, and then sends the transformed information to a stash, i.e. a store. Logstash allows us to import any data of any format to any data store, not only ElasticSearch. It can be used to import data to other NoSQL databases like MongoDB or Hadoop or even to AWS, in parallel. Data may be stored in files, or arrive via a stream, etc.
Logstash parses, transforms, and filters data. It can also derive structure from unstructured data, anonymize personal data, can do geo-location lookups, and many more.
A Logstash pipeline has two required elements, input and output, and one optional element, filter. The input plugin(s) consume data from a source, the filter plugin(s) transform the data, and the output plugin(s) write the data to one or more destinations.
So our example scenario’s Logstash pipeline is basically the following:
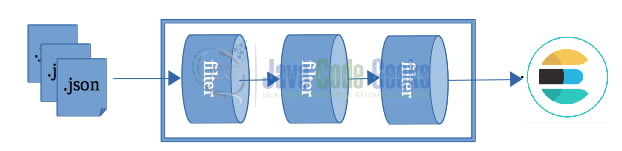
We read our flight data from .json files (in a real system these data should arrive as real-time streams from sensors), we process/transform them applying a number of filters and store them to ElasticSearch.
3. Install Logstash
There are several options to install Logstash. One is to download the archive for your platform from here, and unzip it to a folder. You may also install it using the package manager for your platform, like yum, apt-get or homebrew or as a docker image. Make sure that you have defined an environment variable JAVA_HOME that points to a JDK 8 or 11 or 14 installation (Logstash comes with embedded AdoptJDK). If you download the archive, it contains, apart from logstash, a number of other tools, some of which are not Open Source, and they offer a 30-day trial. You may delete them if you don’t need them. The directory structure is described here.
4. Our first pipeline
Once you installed it, let’s test your Logstash installation by running the most basic Logstash pipeline. cd to the location where you installed logstash and issue the following command:
bin/logstash -e 'input { stdin { } } output { stdout {} }'The above pipeline accepts input from the stdin (i.e. your keyboard) and echoes it to the stdout (usually your screen). There are no filters defined in the above pipeline. Once you see the message that logstash was successfully started, type something (I typed Hello world), press ENTER, and you should see the produced message in a structured format, like the following:
[2021-02-11T21:52:57,120][INFO ][logstash.agent           ] Successfully started Logstash API endpoint {:port=>9600}
Hello world
{
       "message" => "Hello world",
      "@version" => "1",
    "@timestamp" => 2021-02-11T19:57:46.208Z,
          "host" => "MacBook-Pro.local"
}
The -e flag enables you to specify a configuration directly from the command line. What is important to note from the above output is that the actual data are in message key. You may exit logstash by issuing Ctrl+D.
However, usually Logstash works with a configuration file that tells it what to do, i.e. where to find its input, how to transform it and where to store it. The structure of a Logstash configuration file basically includes three parts: input, filter, and output. You specify the source of the data in the input section, and the destination in the output section. In the filter section you can manipulate, measure, and create events by using supported filter plugins. The structure of a configuration file is shown in the following code sample:
input {...}
filter {...}
output{...}
You need to create a configuration file that specifies which plugins you want to use and settings for each plugin. A sample configuration file, logstash-sample.conf, already exists inside config folder. Its contents are shown below:
# Sample Logstash configuration for creating a simple
# Beats -> Logstash -> Elasticsearch pipeline.

input {
  beats {
    port => 5044
  }
}

output {
  elasticsearch {
    hosts => ["http://localhost:9200"]
    index => "%{[@metadata][beat]}-%{[@metadata][version]}-%{+YYYY.MM.dd}"
    #user => "elastic"
    #password => "changeme"
  }
}
The input block defines where Logstash should get its data from. Here is a list of available input plugins. Our input doesn’t come from Beats plugin but from the filesystem, so we use the file input plugin:
input {
  file {
    start_position => "beginning"
    path => "/usr/local/Cellar/logstash-full/7.11.0/data/flightdata/test.json"
    codec => "json"
  }
}
We use the start_position parameter to tell the plugin to read the file from the beginning. The path must be absolute. This option only modifies “first contact” situations where a file is new and not seen before. If a file has already been seen before, this option has no effect. The above absolute path is where homebrew installed logstash and we created a subfolder data/flightdata to store the .json files but you could store them anywhere.
We use the json codec. Codecs are basically stream filters that can operate as part of an input or output and enable you to easily separate the transport of your messages from the serialization process. Popular codecs include json, and plain (text).
- json: encodes/decodes data in the JSON format.
- multiline: merges multiple-line text events into a single event.
The file input plugin keeps track of the current position in each file by recording it in a separate file named sincedb. This makes it possible to stop and restart Logstash and have it pick up where it left off without missing the lines that were added to the file while Logstash was stopped. By default, it is stored inside the data directory (e.g. in libexec/data/plugins/inputs/file/ if you installed Logstash with brew on Mac for example). In our case, this is a problem, since once the file is being processed by Logstash once, Logstash won’t process it the next time(s) and you will be puzzled watching Logstash being stalled while you are waiting for it to process your file. One solution is to set sincedb_path to a non-existing path, e.g. /dev/null (or NUL for Windows) in order to force it to parse the json file each time (sincedb_path => "/dev/null"). However, this may cause the following error (like in my case):
Error: Permission denied – Permission denied
Exception: Errno::EACCES
If you encounter the above error, remove the sincedb_path entry and make sure that you manually remove the .sincedb_ files everytime you re-try with the same input file (you need to shutdown logstash each time).
You can find the test.json in the download section. It consists of only 2 flight documents:
{"Id":4800770,"Rcvr":1,"HasSig":false,"Icao":"494102","Bad":false,"Reg":"CS-PHB","FSeen":"\/Date(1467378028852)\/","TSecs":1,"CMsgs":1,"Alt":10750,"GAlt":10535,"InHg":29.7047253,"AltT":0,"Call":"NJE785L","Lat":52.601028,"Long":-8.849945,"PosTime":1467378028852,"Mlat":false,"Tisb":false,"Spd":294.0,"Trak":103.0,"TrkH":false,"Type":"E55P","Mdl":"Embraer Phenom 300","Man":"Embraer","CNum":"50500209","Op":"NetJets Europe","OpIcao":"NJE","Sqk":"","Vsi":3840,"VsiT":0,"WTC":2,"Species":1,"Engines":"2","EngType":3,"EngMount":1,"Mil":false,"Cou":"Portugal","HasPic":false,"Interested":false,"FlightsCount":0,"Gnd":false,"SpdTyp":0,"CallSus":false,"ResetTrail":true,"TT":"a","Trt":2,"Year":"2014","Cos":[52.601028,-8.849945,1467378028852.0,null]}
{"Id":10519389,"Rcvr":1,"HasSig":true,"Sig":0,"Icao":"A0835D","Bad":false,"Reg":"N132HQ","FSeen":"\/Date(1467378028852)\/","TSecs":1,"CMsgs":1,"Alt":2400,"GAlt":2421,"InHg":29.9409447,"AltT":0,"Lat":39.984322,"Long":-82.925616,"PosTime":1467378028852,"Mlat":true,"Tisb":false,"Spd":135.8,"Trak":223.2,"TrkH":false,"Type":"E170","Mdl":"2008 EMBRAER-EMPRESA BRASILEIRA DE ERJ 170-200 LR","Man":"Embraer","CNum":"17000216","Op":"REPUBLIC AIRLINE INC     - INDIANAPOLIS, IN","OpIcao":"RPA","Sqk":"","Vsi":2176,"VsiT":1,"WTC":2,"Species":1,"Engines":"2","EngType":3,"EngMount":0,"Mil":false,"Cou":"United States","HasPic":false,"Interested":false,"FlightsCount":0,"Gnd":false,"SpdTyp":0,"CallSus":false,"ResetTrail":true,"TT":"a","Trt":2,"Year":"2008","Cos":[39.984322,-82.925616,1467378028852.0,null]}
Explanations of the various data types as well as descriptions of the various fields can be found here.
The output block defines where Logstash should store the data. It is no surprise that we will use ElasticSearch to store our data, however, you may comment it out initially to test that our pipeline will work. We have added a second output to be our console and format the output using rubydebugger and a third output to be the filesystem, the last two for testing our output. We store the output in output.json.
output {
  elasticsearch {
    hosts => ["http://localhost:9200"]
    index => "testflight"
  }

  file {
    path => "/usr/local/Cellar/logstash-full/7.11.0/data/output.json"
  }

  stdout {
    codec => rubydebug
  }
}
In addition, one can define filters to transform the data. Logstash comes with a large number of filters. Some very common filters:
- grok: parses any arbitrary text and adds structure to it. It contains 120 built-in patterns!
- mutate: performs general transformations on event fields, e.g. rename, remove, replace, and modify fields.
- drop: drops an event completely.
- clone: makes a copy of an event, possibly adding or removing fields.
- geoip: adds information about geographical location of IP addresses (also displays amazing charts in Kibana!)
- split: splits multi-line messages, strings, or arrays into distinct events
You can see the full list of plugins installed in your Logstash installation by issuing the command:
$ bin/logstash-plugin list
You will notice that there is a JSON filter plugin. This plugin parses .json files and creates corresponding JSON data structures. Selecting and configuring a filter correctly is very important, otherwise you end up with no data in your output.
So, in our filter block we enable the json plugin and we tell it that our data are in the message field.
filter {
  json {
    source => "message"
  }
}
But where did this message field come from? If you noticed when we ran logstash with -e parameter to test it, it put our message inside a json structure with key "message".
"message" => "Hello world",
Every event will be stored in a field called message by logstash.
The complete config/testflight.conf file so far is:
input {
  file {
    start_position => "beginning"
    path => "/usr/local/Cellar/logstash-full/7.11.0/data/flightdata/test.json"
    codec => "json"
  }
}

filter {
  json {
    source => "message"
  }
}

output {
#   elasticsearch {
#   hosts => ["http://localhost:9200/"]
#   index => "testflight"
# }
  file {
    path => "/usr/local/Cellar/logstash-full/7.11.0/data/output.json"
  }
  stdout {
    codec => rubydebug
  }
}
You can test it first with the following command:
bin/logstash -f config/testflight.conf --config.test_and_exit
...
Configuration OK
[2021-02-11T23:15:38,997][INFO ][logstash.runner          ] Using config.test_and_exit mode. Config Validation Result: OK. Exiting Logstash
If the configuration file passes the configuration test, start Logstash with the following command:
bin/logstash -f config/testflight.conf --config.reload.automatic
...
The --config.reload.automatic option enables automatic config reloading so that you don’t have to stop and restart Logstash every time you modify the configuration file. Unfortunately, if sincedb_path = "/dev/null" (or "NUL" on Windows) doesn’t work for you, it is not that useful since you need to shutdown logstash, clean the .sincedbXXX file that is created and rerun Logstash with the updated conf file, or you will wait for ever for Logstash to process your file.
If everything went OK, you should see output like the following:
{
           "CMsgs" => 1,
        "@version" => "1",
         "PosTime" => 1467378028852,
            "Rcvr" => 1,
        "EngMount" => 0,
            "Tisb" => false,
             "Mil" => false,
             "Trt" => 2,
            "Icao" => "A0835D",
            "Long" => -82.925616,
            "InHg" => 29.9409447,
            "VsiT" => 1,
      "ResetTrail" => true,
         "CallSus" => false,
      "@timestamp" => 2021-02-14T18:32:16.337Z,
            "host" => "MacBook-Pro.local",
          "OpIcao" => "RPA",
             "Man" => "Embraer",
            "GAlt" => 2421,
              "TT" => "a",
             "Bad" => false,
          "HasSig" => true,
           "TSecs" => 1,
             "Vsi" => 2176,
         "EngType" => 3,
             "Reg" => "N132HQ",
             "Alt" => 2400,
         "Species" => 1,
    "FlightsCount" => 0,
             "WTC" => 2,
             "Cos" => [
        [0] 39.984322,
        [1] -82.925616,
        [2] 1467378028852.0,
        [3] nil
    ],"message" => "{\"Id\":10519389,\"Rcvr\":1,\"HasSig\":true,\"Sig\":0,\"Icao\":\"A0835D\",\"Bad\":false,\"Reg\":\"N132HQ\",\"FSeen\":\"\\/Date(1467378028852)\\/\",\"TSecs\":1,\"CMsgs\":1,\"Alt\":2400,\"GAlt\":2421,\"InHg\":29.9409447,\"AltT\":0,\"Lat\":39.984322,\"Long\":-82.925616,\"PosTime\":1467378028852,\"Mlat\":true,\"Tisb\":false,\"Spd\":135.8,\"Trak\":223.2,\"TrkH\":false,\"Type\":\"E170\",\"Mdl\":\"2008 EMBRAER-EMPRESA BRASILEIRA DE ERJ 170-200 LR\",\"Man\":\"Embraer\",\"CNum\":\"17000216\",\"Op\":\"REPUBLIC AIRLINE INC     - INDIANAPOLIS, IN\",\"OpIcao\":\"RPA\",\"Sqk\":\"\",\"Vsi\":2176,\"VsiT\":1,\"WTC\":2,\"Species\":1,\"Engines\":\"2\",\"EngType\":3,\"EngMount\":0,\"Mil\":false,\"Cou\":\"United States\",\"HasPic\":false,\"Interested\":false,\"FlightsCount\":0,\"Gnd\":false,\"SpdTyp\":0,\"CallSus\":false,\"ResetTrail\":true,\"TT\":\"a\",\"Trt\":2,\"Year\":\"2008\",\"Cos\":[39.984322,-82.925616,1467378028852.0,null]}",
             "Lat" => 39.984322,
            "TrkH" => false,
              "Op" => "REPUBLIC AIRLINE INC     - INDIANAPOLIS, IN",
         "Engines" => "2",
             "Sqk" => "",
              "Id" => 10519389,
             "Gnd" => false,
            "CNum" => "17000216",
            "path" => "/usr/local/Cellar/logstash-full/7.11.0/data/flightdata/test.json",
             "Cou" => "United States",
          "HasPic" => false,
           "FSeen" => "/Date(1467378028852)/",
      "Interested" => false,
             "Mdl" => "2008 EMBRAER-EMPRESA BRASILEIRA DE ERJ 170-200 LR",
             "Spd" => 135.8,
             "Sig" => 0,
            "Trak" => 223.2,
            "Year" => "2008",
          "SpdTyp" => 0,
            "AltT" => 0,
            "Type" => "E170",
            "Mlat" => true
}
As you see, Logstash is trying to guess and map the values to fields, which is very convenient. You may also check data/output.json.
You may now uncomment the lines in output where you commented out elasticsearch; logstash will pick-up the change and will re-parse the json file. If you see it stalled, it means that it is using the .sincedb file and you need to stop logstash and delete the .sincedb file first. ElasticSearch must be running of course.
Let’s see what we ‘ve got so far. Back in ElasticSearch let’s get a list of all the indices. You can either use Kibana or curl:
curl -XGET localhost:9200/_cat/indices?v
health status index                          uuid                   pri rep docs.count docs.deleted store.size pri.store.size
yellow open   testflight                     gUTLTkXtRiGb5rkgUMTA7Q   1   1          2            0     42.3kb         42.3kb
green  open   .apm-custom-link               Ii_-y3SXQIGaiWqDERSOMg   1   0          0            0       208b           208b
green  open   .kibana_task_manager_1         HWMApNk6S2mIBAlN6d1rHw   1   0          4            0     21.2kb         21.2kb
green  open   .kibana-event-log-7.9.0-000001 o3aC8ZmRRv-YPW91NhTgug   1   0          1            0      5.6kb          5.6kb
green  open   .apm-agent-configuration       SGoNHyfsRru5dPGklfpxOw   1   0          0            0       208b           208b
green  open   .kibana_1                      8S_r6FI9T5yDnPfcH1v54A   1   0         10            0     40.1kb         40.1kb
You will see the new index testflight. Let’s query this index to retrieve all its documents:
curl -XGET localhost:9200/testflight/_search?pretty
You will see that the index now contains 2 documents. However, you will notice that each document contains some other fields, too, namely: path, @version, @timestamp, and host. These are added by the various plugins. Let’s remove them.
4.1 Transform the JSON sample Flight data file
First, let’s remove path, @version, @timestamp, host and message from the output; these have been added by logstash.
filter {
  json {
    source => "message"
  }
  mutate {
    remove_field => ["path", "@version", "@timestamp", "host", "message"]
  }
}
The mutate filter plugin allows removing unwanted fields. Rerun:
bin/logstash -f config/flightdata-logstash.conf –-config.test_and_exit
bin/logstash -f config/flightdata-logstash.conf --config.reload.automatic
to make sure that everything works as expected.
Next, let’s set the _id to be equal to Id.
output {
  elasticsearch {
    hosts => ["http://localhost:9200"]
    index => "testflight"
    document_id => "%{Id}"
  }
We do this in the output plugin by setting document_id. It worked. However, if you re-run logstash you will notice that Id field is still there. We need to get rid of it.
There is a trick to do that since we do need the field in the output, so we can’t just get rid of it in the filter plugin, and we can’t get rid of it in the output plugin neither. The trick is to rename it to [@metadata][Id] in the filter plugin and then use that in the output. @metadata fields are being remove automatically.
filter {
  json {
     source => "message"
  }
  mutate {
    remove_field => ["path", "@version", "@timestamp", "host", "message"]
    rename => { "[Id]" => "[@metadata][Id]" }
  }
}

output {
  elasticsearch {
    hosts => ["http://localhost:9200"]
    index => "flight-logstash"
    document_id => "%{[@metadata][Id]}"
  }
...
It worked!
Next, we would like to create a field location with the fields Lat and Long. Fortunately, these fields are already of type float, so no need to convert them first. We will use the rename configuration option or mutation, which is part of the mutate filter plugin. Add the following inside the mutate block.
rename => {
      "Lat" => "[location][lat]"
      "Long" => "[location][lon]"
}
Result is:
"location" : {
            "lon" : -82.925616,
            "lat" : 39.984322
          },
Just keep in mind the processing order of the mutations in the mutate filter plugin:
coerce -> rename -> update -> replace -> convert -> gsub -> uppercase -> capitalize -> lowercase -> strip -> remove -> split -> join -> merge -> copy
Let’s now attempt to parse the dates. If you remember, and this is something we didn’t do in the previous article, we need to transform the dates to a format that is more human-friendly. E,g,
"FSeen" => "\/Date(1467378028852)\/"
needs to be transformed to "Fseen":"1467378028852" and then to a date that humans can read. In other words, we need to get rid of \/Date( and )/\ and then convert the timestamp to a human readable date. The mutate filter plugin provides the gsub mutation that matches a regular expression against a field value and replaces all matches with a replacement string. Only fields that are strings or arrays of strings are supported. This configuration takes an array consisting of 3 elements per field/substitution.
gsub => [
          # get rid of /Date(
          "FSeen", "\/Date\(", "",
          # get rid of )/
          "FSeen", "\)\/", ""
        ]
Since what’s inside the double quotes in the 2nd and 3rd field are regular expressions, we escape characters that have special meaning in regexes.
This results in:
"FSeen" : "1467378028852"
To convert the timestamp to a human readable date we use the date filter plugin:
date {
   timezone => "UTC"
   match => ["FSeen", "UNIX_MS"]
   target => "FSeen"
}
UNIX_MS is UNIX timestamp in milliseconds. We match the field FSeen and store the result in the same field.
The result is:
"FSeen" : "2016-07-01T13:00:28.852Z",
The above are summarized in the following code extract:
mutate {
   gsub => [
     # get rid of /Date(
     "FSeen", "\/Date\(", "",
     # get rid of )/
     "FSeen", "\)\/", ""
   ]
}
date {
   timezone => "UTC"
   match => ["FSeen", "UNIX_MS"]
   target => "FSeen"
}
You can do the same for the PosTime field. However, since this field has already the correct UNIX timestamp format, you only need to apply the date filter to it.
The complete testflight.conf is shown below:
input {
  file {
    path => "/usr/local/Cellar/logstash-full/7.11.0/data/flightdata/test.json"
    codec => "json"
    start_position => "beginning"
  }
}

filter {
  json {
     source => "message"
  }
  mutate {
    remove_field => ["path", "@version", "@timestamp", "host", "message"]
    rename => { "[Id]" => "[@metadata][Id]"
                "Lat" => "[location][lat]"
                "Long" => "[location][lon]"
    }
  }
  mutate {
    gsub => [
          # get rid of /Date(
          "FSeen", "\/Date\(", "",
          # get rid of )/
          "FSeen", "\)\/", ""
    ]
  }
  date {
     timezone => "UTC"
     match => ["FSeen", "UNIX_MS"]
     target => "FSeen"
  }
  date {
     timezone => "UTC"
     match => ["PosTime", "UNIX_MS"]
     target => "PosTime"
  }
}

output {
  elasticsearch {
    hosts => ["http://localhost:9200"]
    index => "testflight"
    document_id => "%{[@metadata][Id]}"
  }
  stdout { }
}
Go on and try it for yourself.
5. Transform the JSON sample Flight data file
If you recall, our original flight data files didn’t contain only 2 records, and their content was much more complex than test.json. The actual flight data are stored inside acList array. How do we tell logstash that we actually need the data inside acList? We use the split filter. The split filter clones an event by splitting one of its fields and placing each value resulting from the split into a clone of the original event. The split filter can be used on the above data to create separate events for each value of the acList field. The end result of each split is a complete copy of the event with only the current split section of the given field changed.
filter {
  json {
     source => "message"
  }
  split {
     field => "[acList]"
  }
}
Our new flight.conf file has this initial content:
input {
  file {
    start_position => "beginning"
    path => "/usr/local/Cellar/logstash-full/7.11.0/data/flightdata/2016-07-01-1300Z.json"
    codec => "json"
  }
}

filter {
  json {
     source => "message"
  }
  split {
     field => "[acList]"
  }
  mutate {
    remove_field => ["path", "@version", "@timestamp", "host", "message"]
  }
}

output {
  elasticsearch {
    hosts => ["http://localhost:9200"]
    index => "testflight"
  }
  stdout {
    codec => rubydebug
  }
}
We can access nested fields, e.g. Id like so: [acList][Id]. So, let’s set the document id to be the Id.
...
filter {
  json {
     source => "message"
  }
  split {
     field => "[acList]"
  }
  mutate {
    rename => { "[acList][Id]" => "[@metadata][Id]"
                   "[acList][Lat]" => "[location][lat]"
                   "[acList][Long]" => "[location][lon]"
    }
    remove_field => ["path", "@version", "@timestamp", "host", "message"]
  }
}

output {
  elasticsearch {
    hosts => ["http://localhost:9200"]
    index => "testflight"
    document_id => "%{[@metadata][Id]}"
  }
  stdout {
    codec => rubydebug
  }
}
Next, we need to move all the fields inside acList up one level. We do that with the rename mutation of the mutate filter plugin, as we already saw in the previous example where we renamed (moved) fields Id, Lat and Long. Let’s see how to do that for our FSeen field:
mutate {
  rename => {
     "[acList][FSeen]" => "FSeen"
  }
  gsub => [
     # get rid of /Date(
     "FSeen", "\/Date\(", "",
     # get rid of )/
     "FSeen", "\)\/", ""
  ]
}
date {
   timezone => "UTC"
   match => ["FSeen", "UNIX_MS"]
   target => "FSeen"
}
We need to do the same for all the fields inside acList, e.g.
mutate {
   rename => {
     "[acList][Alt]" => "Alt"
   }
   convert => {"Alt" => "integer"}
}
The convert mutation is not actually required, but it is good to have it there in order to know what data type your field is.
You may also notice that some fields are optional, so they don’t exist in all documents. It is wise to always check for the existence of a field before you apply a filter to it, i.e.
  if [acList][Alt] {
    mutate {
      rename => {
        "[acList][Alt]" => "Alt"
      }
      convert => {"Alt" => "integer"}
    }
  }
The last part is to get rid of acList (together with the other fields at the same level as acList).
...
mutate {
    rename => { "[acList][Id]" => "[@metadata][Id]"
                "[acList][Lat]" => "[location][lat]"
                "[acList][Long]" => "[location][lon]"
    }
    remove_field => ["path", "@version", "@timestamp", "host", "message", "srcFeed", "lastDv", "shtTrlSec", "feeds", "src", "flgH", "flgW", "showFlg", "stm", "showSil", "showPic", "totalAc", "acList"]
  }
You will find the final flight.conf Logstash pipeline in the Download section.
6. Summary
In this article we learned how to use Logstash to import the .json flight data batch files to ElasticSearch. Logstash is a very convenient way with many filters that support many data types and you simply need to learn how to write a pipeline config file and you are done! To parse all 2016-07-01-1300Z.json - 2016-07-01-1309Z.json historical flight data files you can give the input path like so:
input {
    file {
        path => ""/usr/local/Cellar/logstash-full/7.11.0/data/flightdata/*.json"
        type => "MyType"
    }
}
Is Logstash appropriate for real time data processing and does it fit in our scenario of processing real-time flight data, some will ask? The answer is it depends. Logstash is designed mainly for batch data processing, like log data, maybe not to process real-time flight data coming from sensors (it can be used perfectly for our batched json flight data files though). However, you may refer to the references that describe how to create Logstash deployments that can scale and use e.g. Redis as a broker between Logstash agents and Logstash central server in order to handle many events and process them real-time.
In the following figure we can see how to use Logstash as a service.
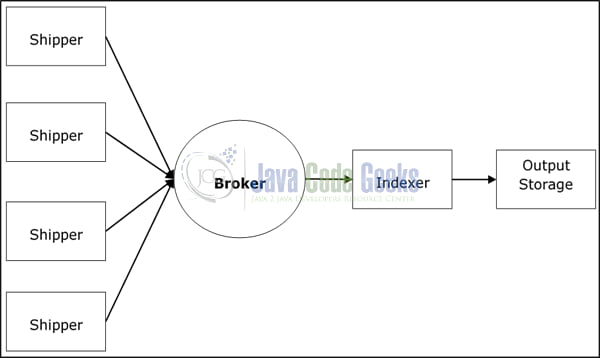
Logstash processes data from different servers and data sources and it behaves as the shipper. Shippers are used to collect the data (e.g. logs) and are installed in every input source. Brokers like Redis, Apache Kafka or RabbitMQ are buffers to hold the data for indexers, and there can be failover instances. Indexers like Lucene are used to index the logs for better search performance and the output is stored in Elasticsearch or other destination. The data can then visualized by Kibana and/or other visualization software. With the above architecture, one could process massive amounts of data.
In the next article we will see how we can process our flight data using another open source real-time processing technology, Apache Storm.
7. References
- Getting started with Logstash
- Logstash Tutorial.
- Berman D. (2020), Using the Mutate Filter in Logstash.
- Kane F. (2020), How to use Logstash to parse and import JSON data into Elasticsearch.
- Turnbull J. (2016), The LogStash Book.
8. Download the source code
You can download the full source code as well as test.json here: Processing real-time data with Storm, Kafka and ElasticSearch – Part 4)
