This tools uses WAS Performance Monitoring statistics to get and chart statistics that indicate the health and well being of your server. * Please note that the tool has been released on an as-is basis with no support.
http://www.ibm.com/developerworks/websphere/downloads/peformtuning.html
Why this tool instead of the other monitoring solutions
1. Its free :-)
2. No agents needed on the server
2. Monitor multiple servers
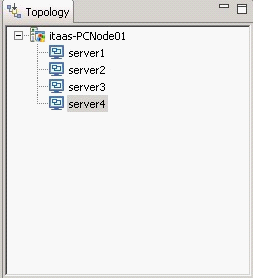

3. This tool provides a standalone viewer for PMI and mbean statistics. It has a RCP GUI which uses the WebSphere application server admin thin client to call a JMX proxy, the JMX proxy will communicate with the WAS via the SOAP/RMI.
4, Predefined alerts and actions.
· If the heapsize reaches the maximum heap size, it will generate a runtime alert.
· If the thread pool reaches the threshold, it will generate a threadpool alert.
· If the CPU usage reaches 90%, it will generate a runtime alert.
· If some servlet error occur, it will generate a servlet alert.
· If some connection timeout occurs, it will generate a connection alert
· If there are some thread waiting for connection, it will generate a connection alert
· If there are more then 1000 prepared statement discarded, it will generate a connection alert
· If application try to use some invalidated session, it will generate a session alert
· If there is no room for new session, it will generate a session alert
· If some hung thread decleared, it will generate a threadpool alert
· If some transactions rolled back, it will generate a transaction alert
· If some transactions timeout, it will generate a transaction alert
· You can define your own rules.
5. Monitoring
The monitor panel presents performance data (Servlet Response Time, Transaction Response Time, Jdbc Response Time, Servlet Throughput, Transaction Throughput, Jdbc Throughput, Concurrency) in a classified views to help you with correlation and provide a comprehensive view of the state of the server.
you analyze the performance problems in your environment.


The response time page presents the response time of a server. It collects data from four components i.e. servlet, transaction, EjbMethod and JDBC.

The throughoutput page presents the throughoutpage of a server.
It displays data from four components. i.e. servlet, transaction, EjbMethod and JDBC.

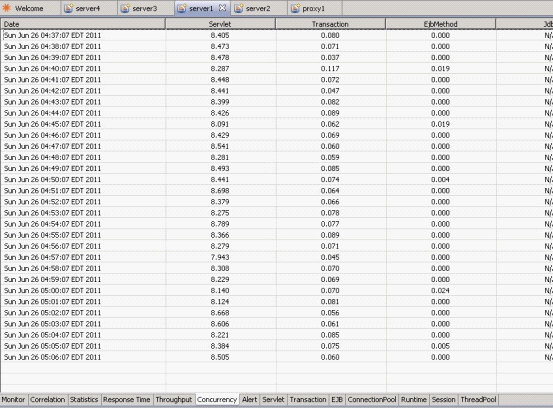
The concurrency page presents the concurrency of a server collecting data rom four components transaction, EjbMethod and JDBC.
Alert page
The alert page presents the alert evens of a server.
You can find the alert detail from the alert type and alert description columns.
Servlet page
The servlet page presents the servlet detail informations of a server.
You can find the response time, throughoutput, concurrency and error count in the columns.
When you expand the row , you will get the servlet page detail of you application.
Transaction page
The transaction page presents the transaction information of a server.
It displays response time, through output, roll back count, global timeout count, local timout count, global response time, local response time.
EJB page
The EJB page presents the EJB information of a server. It collects and displays response time, throughput and concurrent invocation data.
When you expand the row, you can find the detail contribution of your application. The different colors mean the degree of the contributions.
Connection Pool page
The connection pool page presents the connection pool information of a server.
It collects data from connection use time, connection through output, error count, wait time, JDBC through output, JDBC response time, JDBC concurrency, statement discard.
When you expand the row, you can find the detail information of different JDBC connections.
Runtime page
The runtime page presents the runtime information of a server.
It collects data from CPU usage, Max heap size, heap size, used heap size.
Session page
The session page presents the session information of a server.
It collects data from live count, life time, affinity break, time out count, active non-exist count, no room count, cache discard count.
When you expand the row, you can find the detail information of your different applications. The different colors mean the different contribution to the whole time.
ThreadPool page
The Thread pool page presents the thread pool information of a server.
It collects data from max size, pool size, use pool, min size, declared thread hung count, concurrent hung thread count, cleared thread hung count.
When you expand the row, you can find the detail information of different thread pools. The colors mean the different contributions.
For more see http://www.ibm.com/developerworks/websphere/downloads/peformtuning.html
Reference: WebSphere Application Server Performance Tuning Toolkit from our JCG partner Rohit Kelapure at the All Things WebSphere blog.
