Adam Bien’s Porcupine library makes it easy to configure dedicated executor services that act as application bulkheads. I’ve created an extension that exposes the Porcupine statistics via MicroProfile Metrics. We can furthermore make the instrumentation visible via Prometheus and Grafana dashboards.
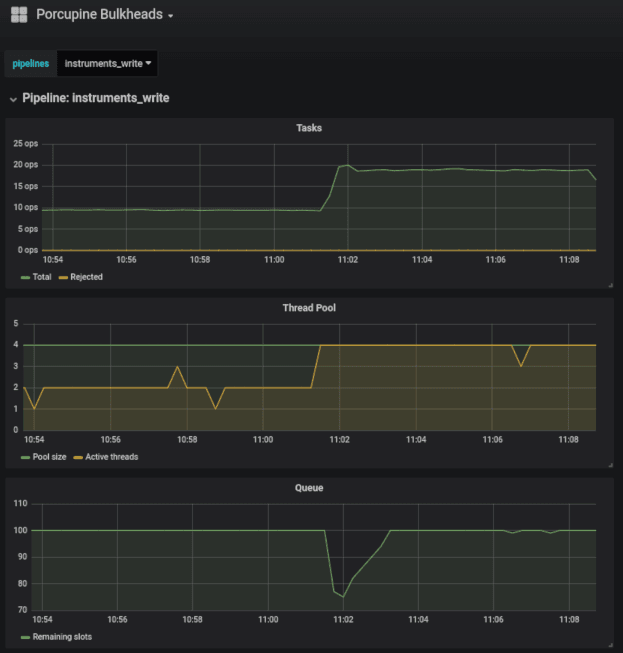
The reason for this extension was that we wanted to have an easy integration (i.e. drop-in) for the instrumentation of Porcupine thread pools. Grafana allows to create and share dashboards that dynamically configure themselves via metric variables. The goal was to create dashboards similar to the following, without a lot of manual configuration:
In order to achieve that you need to do the following:
- Expose the Java EE Porcupine statistics, e.g. in Prometheus format
- Scrape the Prometheus metrics in your Prometheus instance
- Query and display the Prometheus metrics in a Grafana dashboard
To expose Porcupine’s statistics via Prometheus you have multiple ways to emit the metrics in the Prometheus format. I’m using MicroProfile Metrics for which I’ve created a small extension that you can add to your project:
<dependency>
    <groupId>com.sebastian-daschner</groupId>
    <artifactId>porcupine-metrics</artifactId>
    <version>1.0</version>
</dependency>
The extension exposes the PorcupineMetrics bean that needs to be invoked via it’s updateMetrics() method every time the metrics should be updated. We can use a timer similar to the following:
@Singleton
@Startup
@ConcurrencyManagement(ConcurrencyManagementType.BEAN)
public class ExecutorStatisticsUpdater {

    @Inject
    PorcupineMetrics porcupineMetrics;

    @Resource
    ManagedScheduledExecutorService scheduler;

    @PostConstruct
    public void init() {
        scheduler.scheduleAtFixedRate(porcupineMetrics::updateMetrics,
            0, 5, TimeUnit.SECONDS);
    }

}
This will update the metrics every 5 seconds. Due to Porcupine’s statistics internals, the update mechanism currently requires to be triggered explicitly, e.g. via timer. This will include the following pipeline metrics in your Metrics endpoint:
vendor:porcupine_pipelines_<pipeline-name>_active_thread_count 2
vendor:porcupine_pipelines_<pipeline-name>_core_pool_size 4
vendor:porcupine_pipelines_<pipeline-name>_current_thread_pool_size 4
vendor:porcupine_pipelines_<pipeline-name>_largest_thread_pool_size 4
vendor:porcupine_pipelines_<pipeline-name>_maximum_pool_size 8
vendor:porcupine_pipelines_<pipeline-name>_min_queue_capacity 60
vendor:porcupine_pipelines_<pipeline-name>_remaining_queue_capacity 100
vendor:porcupine_pipelines_<pipeline-name>_tasks_completed 3034
vendor:porcupine_pipelines_<pipeline-name>_tasks_rejected 30
vendor:porcupine_pipelines_<pipeline-name>_tasks_total 3036
Instead of using MicroProfile Metrics or this extension you can equally well expose the metrics via other mechanisms, for example by using the Prometheus Java API as explained here.
Afterwards, we scrape the exposed metrics via Prometheus and create Grafana dashboards that query and display the statistics, dynamically for each pipeline via variables.
To get started, I’ve shared the Porcupine dashboard similar to what you see on the screenshot on Grafana.com that connects to a Prometheus datasource.
You can have a look at the instrument-craft-shop project that uses Porcupine Metrics.
In case you’re wondering why I’m using Porcupine instead of the MicroProfile Fault Tolerance bulkheads, have a look at the following video on bulkheads and backpressure with Java EE.
Found the post useful? Subscribe to my newsletter for more free content, tips and tricks on IT & Java:
Success! Now check your email to confirm your subscription.
| Published on Java Code Geeks with permission by Sebastian Daschner, partner at our JCG program. See the original article here: Instrumenting Porcupine With Prometheus & Grafana Opinions expressed by Java Code Geeks contributors are their own. |
