
Spring’s ApplicationContext Startup Is Slower Than You Think:Fix It With AOT and Lazy Init

A forensic diagnostic of where startup time actually goes — BeanFactory, condition evaluation, component scan, proxy generation — which knobs actually move the needle, and when AOT compilation helps vs. when it’s snake oil for a given application shape.
Started Application in 2.341 seconds is the line every Spring Boot developer has stared at, and it’s almost useless as a diagnostic. It’s a single number standing in for four structurally different phases of work, each with its own cost driver, each responding to a completely different fix. Treating that number as one thing is exactly why so much startup tuning advice amounts to superstition — try lazy init, try excluding some auto-configurations, try AOT, see if the number goes down. This piece breaks the number apart first, then looks at which levers actually address which phase.
What “Startup” Actually Contains: Four Distinct Phases
Refreshing a Spring ApplicationContext is not one operation — it’s a sequence, and each stage has a different relationship to the size and shape of your application.
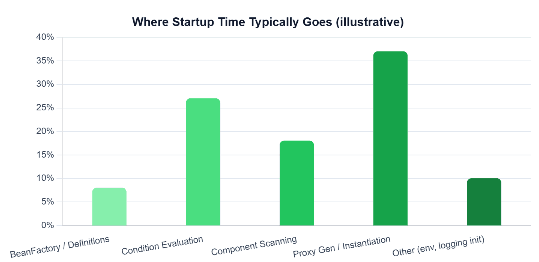
1. BeanFactory Creation and Bean Definition Loading
Before any bean is instantiated, Spring has to build up the registry of bean definitions — metadata describing what beans exist and how to create them, without creating them yet. This includes parsing configuration classes and resolving the initial set of definitions the context will work from. It’s rarely the dominant cost, but it’s the foundation every later phase depends on.
2. Condition Evaluation
Spring Boot’s auto-configuration model works by proposing a large number of candidate configurations — for datasources, web servers, messaging, caching, security — and evaluating a chain of @Conditional checks for each one to decide whether it actually applies to your classpath and properties. The more auto-configuration starters on your classpath, the more conditions get evaluated, whether or not most of them end up contributing a single bean. This is why two applications with wildly different amounts of actual business logic can have startup times that scale more with “how many starters are on the classpath” than with “how much code we wrote.”
3. Component Scanning
Classpath scanning walks your configured base packages looking for classes annotated with stereotypes like @Component, @Service, and @Repository. The cost here scales with the number of classes and jars actually scanned, not with the number of beans that scan ultimately produces — a broad base package that happens to include a lot of unrelated classes pays a scanning cost even for classes that were never going to be registered as beans.
4. Proxy Generation and Bean Instantiation
Once definitions are resolved, Spring has to actually construct the beans, run their initialization callbacks, and — for beans that need it — generate CGLIB or JDK dynamic proxies to support features like @Transactional, @Cacheable, or full-mode @Configuration classes. Proxy generation is real bytecode generation happening at runtime, and it stacks on top of whatever the bean’s own constructor or initialization logic does, which is often the single most variable cost of all four phases, since it includes any I/O-bound work a bean performs on startup.
| Phase | Scales with | Typical fix target |
|---|---|---|
| BeanFactory / definition loading | Total number of configuration classes | Rarely worth targeting directly |
| Condition evaluation | Number of auto-configuration candidates on the classpath | Excluding unused starters, AOT |
| Component scanning | Number of classes/jars scanned | Narrower base packages, indexed scanning |
| Proxy generation / instantiation | Number of proxied beans and their own init cost | proxyBeanMethods=false, lazy init, AOT |
Measuring It for Real, Not Guessing
Before changing anything, it’s worth actually measuring which phase is dominant for your specific application, since the right fix depends entirely on that answer.
Running with --debug prints Spring Boot’s condition evaluation report, listing every auto-configuration considered and why it was included or excluded — this alone often reveals starters contributing far more condition checks than value. For a structured, code-level breakdown, Spring Framework’s ApplicationStartup API (via BufferingApplicationStartup) records timed steps during context refresh, and Spring Boot exposes them through the /actuator/startup endpoint once enabled — this is the closest thing to a proper flame graph of your own startup sequence without needing an external profiler.
A minimal setup to see real step-by-step startup timing:
- Enable the
startupendpoint via Spring Boot Actuator’s management configuration. - Register a
BufferingApplicationStartupon theSpringApplicationbefore running it. - Call
/actuator/startupafter the context is up to retrieve the full timed step breakdown as JSON.
For a lower-level view that includes JVM class loading and JIT activity alongside Spring’s own steps, a short Java Flight Recorder profile of the startup window will show whether the bottleneck is actually inside Spring at all, or simply class loading and JIT warm-up that no amount of Spring-level tuning will touch.
The Knobs That Actually Move the Needle
| Knob | What it actually does | Caveat |
|---|---|---|
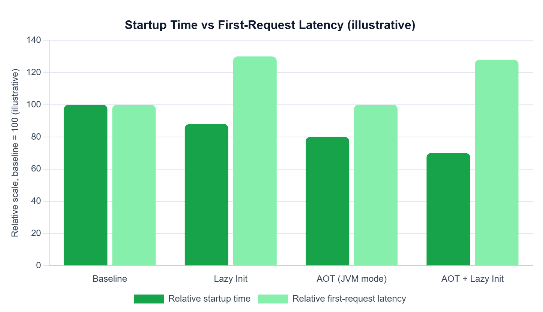
spring.main.lazy-initialization=true | Defers bean creation until first use instead of eagerly at startup | Shifts cost to first request rather than eliminating it; can hide real latency problems from monitoring that only checks startup time |
proxyBeanMethods=false on @Configuration | Skips CGLIB subclassing for configuration classes that don’t need inter-bean method call semantics | Only safe if your configuration doesn’t rely on calling one @Bean method from another to get the same singleton instance |
| Narrower component scan base packages | Reduces the number of classes actually inspected during scanning | Helps most in monorepo-style codebases with broad, shared base packages |
| Excluding unused auto-configurations | Removes condition checks for starters you don’t actually need active | Requires knowing your classpath well enough to prune safely |
Spring AOT (spring.aot.enabled=true) | Moves condition evaluation, scanning, and proxy class generation to build time | Fixes the active bean set at build time; profile flexibility is limited |
Notice that lazy initialization is the odd one out: it doesn’t reduce total work, it relocates it. That’s a legitimate trade when your goal is a fast health check or a fast deployment rollout, and a misleading one if you quote it as having “fixed” startup performance without checking what happened to the latency of the first real request afterward.
AOT — When It Genuinely Helps and When It’s Snake Oil
Spring’s own engineering data puts JVM-mode AOT acceleration in the range of roughly 3% to 24% faster startup, alongside a modest reduction in memory footprint — a real but bounded gain, not a silver bullet. The mechanism is exactly what the phase breakdown above predicts: AOT precomputes bean definitions, resolves conditions, and generates the proxy classes ahead of time, so the runtime skips straight to instantiation instead of doing that analysis fresh on every boot. Spring Boot’s own documentation is candid that this comes with real restrictions: the classpath and active bean set are fixed at build time, and Spring profile flexibility is constrained as a direct consequence.
That mechanism explains both sides of the “when it helps” question cleanly. AOT genuinely helps applications with a large auto-configuration surface — many starters, many candidate conditions — and applications that restart frequently enough for the saved seconds to compound, such as autoscaling services or scale-to-zero deployments where cold start directly affects user-facing latency. It becomes closer to snake oil in two common cases: applications whose startup time is actually dominated by bean initialization logic doing real I/O — warming a cache, opening a connection pool, running a startup migration — since AOT cannot precompute work that depends on runtime data; and small applications with a narrow classpath, where there simply aren’t enough condition checks or proxies to eliminate for the percentage gain to be worth the reduced runtime flexibility and added build complexity.
Before reaching for AOT, check whether your bottleneck is actually addressable by it:
- Have you profiled which of the four phases is actually dominant, rather than assuming?
- Does your application rely on runtime-added beans, dynamic profiles, or conditional wiring that AOT’s build-time model can’t represent?
- Is a meaningful fraction of your startup time spent in actual I/O — cache warming, connection pools, migrations — that no amount of precomputed metadata will speed up?
- Does your deployment model actually restart often enough for the saved seconds to add up to something that matters?
- Have you tried the cheaper, reversible knobs — excluding unused starters,
proxyBeanMethods=false, narrower scanning — before committing to a build-time model that reduces runtime flexibility?
What We Learned
Spring Boot’s single reported startup number hides four phases with genuinely different cost drivers: bean definition loading, condition evaluation across your auto-configuration surface, component scanning proportional to classes inspected, and proxy generation stacked on top of whatever real work your beans do during initialization. Lazy initialization relocates cost rather than removing it, cheap knobs like proxyBeanMethods=false and narrower scanning address specific phases directly, and AOT compilation delivers a real but bounded gain by moving condition evaluation and proxy generation to build time — a gain that matters most for classpath-heavy, frequently-restarted applications, and matters least for applications whose real bottleneck is I/O-bound bean initialization that no amount of precomputation can shortcut. The right fix was never a single knob; it was measuring which phase was actually slow before touching anything.