Observability vs. Monitoring: Why Logs, Metrics, and Traces Are Not Interchangeable

The conceptual difference between the three pillars of observability, what each one is uniquely suited to reveal, and why treating them as equivalent leads to blind spots.
“We have observability” often means, in practice, “we have a dashboard.” Monitoring and observability get used as synonyms so often that the distinction has quietly eroded, and with it, a genuinely useful way of reasoning about incidents. Monitoring tells you a system is unhealthy. Observability is supposed to tell you why — and logs, metrics, and traces each answer a different slice of that “why” question. Treating them as three interchangeable ways to look at the same data is exactly what creates the blind spot that shows up during the next 3 a.m. incident.
Monitoring Answers “Is Something Wrong,” Observability Answers “Why”
Monitoring, in its classic form, is built around known failure modes: you decide in advance what to watch — CPU usage, error rate, request latency — and you alert when those known signals cross a threshold. It works well for problems you’ve anticipated. Observability, as the OpenTelemetry project describes it, is about being able to ask arbitrary new questions of a system’s behavior without having to ship new code to answer them — which matters most for the failure modes nobody predicted, which is to say, most real incidents.
Metrics: What They’re Built For
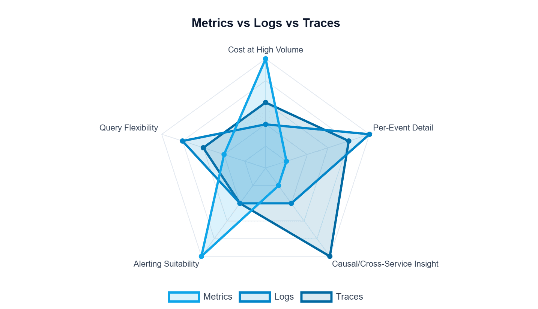
A metric is a numeric measurement aggregated over time — a request count, a latency percentile, a queue depth. Metrics are cheap to store and query even at enormous volume, because the aggregation happens up front; you’re storing a number per time bucket, not every individual event that contributed to it. This makes metrics the right tool for alerting and for spotting trends: “error rate crossed 2% five minutes ago” is exactly the kind of question metrics answer well.
What metrics can’t tell you is which specific request failed, or why. The aggregation that makes them cheap is the same aggregation that discards the individual event detail you’d need to diagnose a single failing case.
Logs: What They’re Built For
A log is a discrete, timestamped record of something that happened, usually with rich contextual detail attached — a user ID, an error message, a stack trace. Logs are what you reach for once a metric has told you something is wrong and you need to know exactly what, on exactly which request. Their weakness is cost and structure: searching unstructured logs at scale is expensive, and logs without consistent structure (the kind enforced by structured logging conventions) become nearly impossible to query systematically once volume grows past a certain point.
Traces: What They’re Built For
A trace follows a single request as it moves across service boundaries, recording how long each part of that journey took and how the parts relate to each other causally. This is the one thing neither metrics nor logs can reconstruct on their own: metrics show that overall latency went up, and logs show that a specific service logged an error, but only a trace shows that the error in service C was actually caused by a slow call to service D that service B was waiting on. Distributed tracing exists specifically to answer “where in this request’s journey did the time actually go.”
| Pillar | Best question it answers | Primary weakness |
|---|---|---|
| Metrics | Is something wrong right now, in aggregate? | No detail on any single event |
| Logs | What exactly happened on this specific request? | Expensive to search at scale; needs structure to be queryable |
| Traces | Where did the time go across service boundaries? | Often sampled, so not every request is captured |
Why Treating Them as Interchangeable Creates Blind Spots
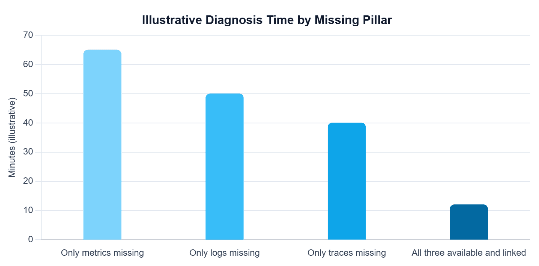
The blind spot shows up predictably: a team with only metrics sees that latency spiked but has no way to find the specific request or root cause behind it. A team with only logs can find an individual error but has no sense of scope — is this affecting one user or ten thousand? A team with only traces can see exactly where one slow request lost its time but can’t tell whether that pattern is a rare anomaly or the new normal across the whole fleet. Each pillar, alone, answers its own question well and almost every other question poorly.
Correlating the Three Pillars in Practice
The real power shows up not from picking one pillar but from linking them together. Injecting a trace ID into every log line lets an engineer jump from “this trace looks slow” directly to the specific log lines from that exact request, instead of guessing which logs might be relevant. Exemplars — a feature supported by modern metrics backends — let a metric spike link directly to a handful of representative traces that contributed to it, closing the loop from “something is wrong in aggregate” to “here’s one concrete example of it happening.” This is precisely the correlation model that OpenTelemetry’s signal model is designed to support natively, rather than bolting it on after the fact.
Before assuming your observability setup is complete, check:
- Can you go from a metric alert to a specific trace and specific logs without manual guesswork?
- Are your logs structured consistently enough to be queried, not just grepped?
- Is your trace sampling rate high enough to catch the rare, expensive requests that matter most?
- Do you actually need all three pillars for this particular service, or is the cost of maintaining all three unjustified for something simple and low-traffic?
- When the next unexpected failure mode shows up, could you actually ask a brand-new question of your data, or only re-check dashboards you already built?
What We Learned
Monitoring and observability aren’t the same discipline wearing different names, and logs, metrics, and traces aren’t three interchangeable views of identical data. Each pillar is shaped by a specific trade-off — metrics sacrifice per-event detail for cheap aggregation, logs sacrifice queryability at scale for rich context, and traces sacrifice complete coverage for causal clarity across services — and each blind spot in an incident usually traces back to relying on a pillar that was never designed to answer the question being asked of it. The teams that diagnose incidents fastest aren’t the ones with the most dashboards; they’re the ones who can move fluidly between all three signals, because the tools were built from the start to connect to each other.