We Have Been Measuring Developer Productivity Wrong for Forty Years — And the Metrics We Replaced the Bad Ones With Are Also Wrong

DORA metrics are now the dominant language for measuring engineering team performance. But what happens when even our best measurement frameworks corrupt the behaviour they’re trying to capture?
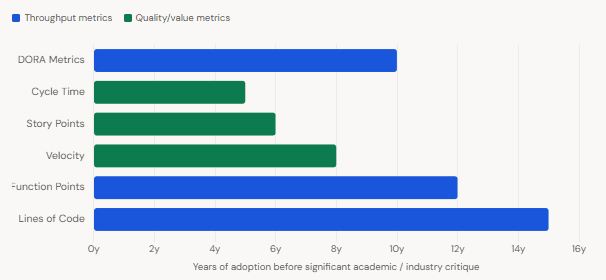
There is a version of this story that gets told a lot. We used to count lines of code, which was bad. Then we switched to function points, which was better. Then agile velocity. Then story points. And now, finally, we have DORA metrics — four carefully chosen signals that correlate with both organisational performance and commercial outcomes, backed by a decade of research across tens of thousands of engineers. Progress, right?
Not quite. What this narrative misses is that each generation of metrics failed for the same reason. Not because the numbers were chosen poorly, but because of something far more fundamental: the moment you attach a measure to a target, you change the system you’re measuring. Consequently, the measure stops describing reality and starts describing the optimisation behaviour of the people being measured.
This is not a new observation. However, it is one that the engineering community keeps having to rediscover — with expensive consequences each time. Furthermore, the costs are highest in precisely the environments where Java and JVM engineers tend to work: large, long-lived systems where invisible technical debt accumulates quietly for years before anyone notices.
Goodhart’s Law, coined by economist Charles Goodhart and later sharpened by anthropologist Marilyn Strathern: “When a measure becomes a target, it ceases to be a good measure.” This applies universally — from monetary policy to sprint velocity to deployment frequency.
Part 1 — Forty Years of Proxy Metrics
The story of developer productivity measurement begins in the 1970s, when lines of code (LOC) became the dominant proxy for output. The intuition was not entirely unreasonable: more code means more features, more features means more value. Therefore, counting code means counting value.
The problems with this logic became apparent quickly. A developer who solves a complex concurrency problem in 40 lines of idiomatic Java produces far more value than one who writes 400 lines of redundant boilerplate. Moreover, the elegant refactor that removes 2,000 lines of dead code and cuts deployment time by 30% shows up as negative productivity under a LOC metric. As Goodhart’s Law predicts, once LOC became a target, developers wrote more code than necessary — functions became sprawling, deletion became dangerous, and refactoring looked like regression.
From LOC to Function Points to Velocity
By the 1980s, function points attempted to correct this by measuring functional units of software rather than raw volume. Better — but still measuring output rather than value. The relationship between function points and customer value remained nonlinear and deeply context-dependent.
Agile’s arrival in the 2000s introduced story points and velocity. The theory was elegant: if teams estimate effort relative to each other using abstract units, you get a measure of throughput that’s resistant to the distortions of hours or LOC. In practice, however, once velocity became a management target, teams began inflating estimates. A task that was genuinely a “3” became a “5” to make the team look more productive. Cross-team velocity comparisons became meaningless, and the metric stopped tracking actual capacity.
The Pattern
Every productivity metric in software history has shared the same structural flaw: it measures a proxy for value, not value itself. And every proxy, once it becomes a target, is subject to Goodhart’s Law — not through dishonesty, but through the rational optimisation of the people being measured.
The Evolution of Developer Productivity Metrics (1970–2024)
Part 2 — The DORA Metrics: Better Proxies, Same Blind Spots
DORA’s four key metrics, introduced in 2013 and backed by research spanning over 32,000 professionals, represent a genuine step forward. They correlate with organisational performance, they’re harder to game than LOC, and they measure system behaviour rather than individual output. Nevertheless, they share the same structural problem as every metric before them: they’re proxies, and they each have systematic blind spots that become failure modes under optimisation pressure.
Deployment Frequency
The logic is sound: teams that deploy more frequently work in smaller batches, get faster feedback, and accumulate less risk. Elite performers deploy 182 times more frequently than low performers. That gap is real, meaningful, and worth chasing.
However, a team optimising specifically for this metric can achieve high deployment frequency by shrinking deployments to the point of meaninglessness — deploying trivial configuration changes, splitting coherent features into artificially fragmented releases, or maintaining a separate “fast path” pipeline for metrics-friendly micro-changes while the real work moves through a different, slower track. The metric goes up; the underlying engineering capability does not.
Change Failure Rate
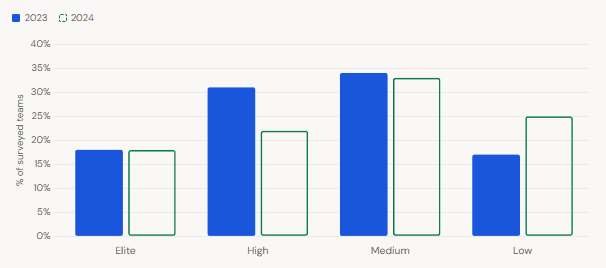
This measures the percentage of deployments that cause failures requiring hotfixes or rollbacks. The 2024 DORA Report actually introduced a fifth metric — deployment rework rate — precisely because the research team found that change failure rate, as historically defined, had long been an outlier in the data. DORA’s own analysis noted it “has long had an outlier” behaviour compared to the other three metrics. More troublingly, the 2024 report found that for the first time, the medium-performance cluster had a lower change failure rate than the high-performance cluster. This is not a minor anomaly — it reveals that change failure rate rewards risk aversion, not quality. Teams that deploy rarely can trivially achieve low failure rates, because they’re not deploying enough to fail.
Lead Time for Changes
The time from code commit to production deployment is a genuinely useful signal. But it measures the speed of the pipeline, not the quality of what flows through it. A team can reduce lead time by shortening code review cycles, skipping manual QA gates, or parallelising steps that previously provided safety checks. The metric improves; the risk profile worsens. In a mature Java system with complex transactional boundaries and deep integration dependencies, this tradeoff is particularly dangerous and particularly invisible.
Mean Time to Recovery (MTTR)
Now rebranded as Failed Deployment Recovery Time — and the rename is itself revealing. DORA changed the definition in 2023 specifically because the old definition did not distinguish between failures caused by software changes and failures caused by external factors like data centre outages. MTTR measures how quickly you respond to failure, not how reliable your system is. A team with excellent incident response but a fragile architecture looks identical to a team with genuine reliability under this metric.
For the first time in DORA’s research history, throughput and quality metrics moved independently in 2024 — high-frequency teams had higher failure rates than medium-frequency teams. This decoupling suggests that the correlation between DORA metrics, which has been the foundation of the framework’s validity, is not a law of nature. It’s a pattern that holds until it doesn’t.
2024 DORA Performance Cluster Distribution vs. 2023
Summary: What Each DORA Metric Actually Measures vs. What It Misses
| Metric | What it measures | Primary blind spot | Gaming risk |
|---|---|---|---|
| Deployment Frequency | Pipeline throughput, batch size proxy | Deployment meaningfulness | Medium |
| Lead Time for Changes | Pipeline speed | Quality of what flows through | Medium |
| Change Failure Rate | Deployment-triggered failures | Rewards risk aversion, not quality | High |
| MTTR / Recovery Time | Incident response speed | System reliability; architectural fragility | Medium |
| Rework Rate (new 2024) | Unplanned fix deployments | Still self-reported; definition varies | High |
The hardest part
Part 3 — The Measurement Act Itself Changes the System
So far, the argument has been relatively conventional: proxies are imperfect, Goodhart’s Law applies, DORA metrics have blind spots. All true, and all already acknowledged — at least in principle — by the DORA research team itself. In October 2023, DORA explicitly cautioned against using these metrics to compare teams, warning that league tables lead to unhealthy competition and counterproductive behaviour.
But the more provocative argument runs deeper than gaming. The issue is not merely that people optimise for metrics when they know they’re being measured. The issue is that the act of measuring productivity at the team level changes the cognitive and social dynamics of engineering work in ways that are invisible to the metric being used.
The Observer Effect in Engineering Teams
Consider what happens when a team knows their deployment frequency is being tracked. Discussions about release strategy stop being engineering conversations and start being metrics conversations. The question shifts from “what’s the right batch size for this change?” to “how does this deployment affect our numbers this quarter?” That shift is subtle, mostly invisible, and deeply damaging — because the former question requires genuine engineering judgment, while the latter requires metric optimisation.
Furthermore, measurement frameworks have a tendency to make the unmeasured invisible. A senior Java engineer spending three weeks refactoring a critical payment service to reduce coupling, improve testability, and eliminate a class of race conditions produces no DORA signal whatsoever. That work does not appear in deployment frequency, does not affect lead time, and generates no change failure rate data. It is, under the DORA framework, indistinguishable from three weeks of absence. Yet this is precisely the work that prevents the next six months of incidents — and the next two years of velocity-killing technical debt.
The Java & JVM Context
Long-lived enterprise Java systems — the kind maintained by senior engineers across years of accumulated complexity — are precisely where measurement distortion is most costly and most invisible. The architectural decisions that prevent failures five years hence, the mentoring that builds team capability, the careful design work that avoids the need for future hotfixes: none of this generates a DORA signal. Meanwhile, the tactical optimisations that improve metrics in the short term — smaller deployments, faster pipelines, quicker incident resolution — can actively obscure the accumulation of systemic risk.
Campbell’s Law: The Sociological Companion to Goodhart
Goodhart’s Law has a sociological complement in Campbell’s Law: “The more any quantitative social indicator is used for social decision-making, the more subject it will be to corruption pressures.” Note the word “corruption” — Campbell did not mean fraud. He meant the subtle, often unconscious distortion that occurs when human beings adapt their behaviour to the social context of being evaluated. In an engineering team, this manifests as scope creep in estimates, risk-averse deployment strategies, architectural conservatism that protects the team’s numbers rather than the system’s health, and the gradual erosion of deep technical work that is not visible to the measurement framework.
So What Should We Do Instead?
This is where many critiques of measurement frameworks arrive at unhelpfully vague conclusions — “use judgment”, “focus on outcomes”, “build trust”. These suggestions are correct and also practically useless in organisations that need some form of accountability structure. So let us be more specific.
Treat Metrics as Diagnostics, Not Targets
The DORA team itself makes this point: metrics should inform the continuous improvement process, not serve as performance targets. In practice, this means using DORA data to identify bottlenecks — a suddenly high lead time suggests a process problem; a spike in change failure rate suggests a testing gap — rather than to rank, compare, or evaluate teams. The moment a metric enters a performance review, it has become a target, and Goodhart applies.
Use Multiple Metrics to Make Gaming Harder
As Campbell suggested, using multiple metrics simultaneously — and rotating which ones receive emphasis — increases the cost of optimisation. A team that needs to simultaneously improve deployment frequency and reduce change failure rate and maintain developer satisfaction scores cannot easily game all three at once. The SPACE framework (Satisfaction, Performance, Activity, Communication, Efficiency) attempts exactly this — providing a multi-dimensional view that resists single-axis optimisation.
Measure the Unmeasured
The most important engineering work in complex Java systems — architectural improvement, technical debt reduction, mentoring, documentation — generates no DORA signal. Therefore, making this work visible requires a deliberate effort outside the metrics framework: regular technical debt reviews, explicit investment in refactoring cycles, and leadership cultures where “this sprint we didn’t ship features but we eliminated a class of future incidents” is treated as a legitimate outcome worth celebrating.
Be Honest About What Metrics Are
Finally, the most important thing is to maintain epistemic honesty about what metrics actually represent. DORA metrics are better proxies than lines of code. They are backed by real research. They correlate with outcomes that matter. And they are still proxies — incomplete, gameable under optimisation pressure, and blind to significant categories of engineering value. The engineering manager who understands this distinction is far more likely to make good decisions than one who treats a metrics dashboard as a ground-truth representation of team performance.
What We Have Learned
- The fundamental problem is structural, not methodological. Every productivity metric — from lines of code to DORA — measures a proxy for value, and every proxy is subject to Goodhart’s Law once it becomes a target. Replacing one metric with a better one does not escape this problem; it only delays it.
- DORA metrics represent genuine progress. They are better proxies than anything that came before, backed by a decade of serious research. However, the 2024 DORA Report itself surfaced evidence that the core correlation between throughput and stability — the foundation of DORA’s validity — is beginning to show cracks as teams optimise for the metrics themselves.
- The measurement act changes the system. Beyond gaming, the social and cognitive dynamics of being measured shift engineering conversations from judgment to optimisation. This is most damaging — and most invisible — in the long-lived, complex systems that Java and JVM engineers typically maintain.
- The most valuable engineering work generates no DORA signal. Architectural improvement, technical debt reduction, and mentoring are the activities most responsible for long-term system health and team capability, and all are invisible to the DORA framework.
- Use metrics as diagnostics, not targets. The difference between these two uses is the difference between a healthy and a pathological relationship with measurement — and that difference determines whether your metrics improve your engineering or corrupt it.