
The Object Allocation Tax: Why Your Java Service Is 40% GC and How the JIT’s Escape Analysis Both Helps and Misleads You

A ground-level look at how HotSpot C2 decides between scalar replacement and heap allocation, the everyday patterns that silently defeat it, and why measuring allocation rate — not GC pause time — is the only way to find the real bottleneck.
The Tax You Are Paying Without Knowing It
Open the GC log of any typical Java microservice under sustained load and you will see a pattern: the JVM spends 20–40% of its total CPU time on garbage collection. Developers confronted with this number usually respond the same way — they tune the GC. They adjust heap size, switch GC algorithms, tweak survivor ratios, and compare pause time dashboards. Most of the time, this does not fix the root problem. It only makes the symptom more bearable.
The root problem, in most cases, is allocation rate — how many megabytes per second the application is creating on the heap. Garbage collection is downstream of allocation. If your service is allocating 2 GB/s of short-lived objects, then every GC algorithm in the world has to deal with that throughput. You can reduce the pause each individual GC takes, but you cannot avoid the total CPU budget that goes into collection. The only fix is to allocate less.
This is where the JIT compiler’s escape analysis becomes the conversation. In theory, escape analysis lets the JVM eliminate allocations entirely for objects that do not need to live on the heap. In practice, the picture is considerably more nuanced — escape analysis in HotSpot’s C2 JIT is genuinely powerful in some situations and unexpectedly fragile in others, and the specific fragility points map exactly onto patterns that Java developers write routinely without any warning. Understanding where the boundary lies is the prerequisite for doing anything useful about your allocation rate.
Why “tune the GC” is the wrong first step
A useful mental model: GC pause time is a symptom. Allocation rate is a cause. You can measure GC pause time from dashboards and GC logs — it is visible and easy to report on. Allocation rate is invisible in most monitoring setups and requires dedicated profiling to surface. This asymmetry is why teams tune the wrong thing first, every time. This article is primarily about fixing the cause.
How Escape Analysis Actually Works in HotSpot
Escape analysis is not a single decision — it is a classification system. The C2 JIT compiler (the optimizing compiler that handles your hot code paths) analyzes every object allocation in a compiled method and assigns it one of three escape states.
NoEscape
The object does not leave the method and is not visible to other threads. Eligible for scalar replacement or lock elision. The best possible outcome from an allocation standpoint.
ArgEscape
The object is passed as an argument to a method or returned as a value, but is not stored in a globally accessible location. Eligible for some optimizations depending on what the callee does.
GlobalEscape
The object is stored in a static field, instance field of another object, or visible to another thread. Must be allocated on the heap. No escape-analysis optimization is possible.
The analysis that produces these classifications is flow-insensitive and conservative by design. This is important to understand because it directly explains why escape analysis sometimes fails on code that looks safe to a human reader. Flow-insensitive means the analysis does not track which branch of a conditional was taken at runtime — it considers all possible paths simultaneously. Conservative means that when the analysis is uncertain, it always falls back to the pessimistic assumption: the object escapes. As the OpenJDK escape analysis report explicitly states, the analysis is heavily dependent on method inlining — if a method is not inlined, C2 has to assume that the argument passed to it escapes, even if it would be safe.
The analysis also has a hard per-method scope boundary. HotSpot’s C2 performs escape analysis at the method compilation unit level. It cannot reason across compilation units that are not inlined together. This is the single biggest practical limitation, and it affects real code constantly.
Scalar Replacement: What It Really Does (and Does Not Do)
The term “stack allocation” appears frequently in articles about Java escape analysis. It is almost always wrong — at least for HotSpot. As Aleksey Shipilev’s authoritative JVM Anatomy Quark #18 documents, HotSpot C2 does not perform true stack allocation. What it actually does is called Scalar Replacement of Aggregates (SRA), and the distinction matters.
True stack allocation would take an object’s entire memory layout — header, fields — and place it on the method stack frame. Scalar replacement instead does something different: it decomposes the object entirely, replacing all accesses to its fields with synthetic local variables. Those local variables are then handled by the register allocator, which may spill some of them to stack slots when register pressure is high. The object as a coherent data structure never exists on the stack or the heap — it effectively ceases to exist as an object at the machine code level.
This is actually better than stack allocation in many cases. A truly stack-allocated object still has an object header, still occupies a contiguous block of memory, and still needs write barriers if it might ever escape. A scalar-replaced object has none of these overheads. Its fields become register-allocated variables with no header, no contiguous layout, and no GC interaction whatsoever.
The key limit: Scalar replacement requires the object to be decomposable at every point where it is used. If control flow merges before the object is accessed — for example, an object that is created in one branch of an if-else and used after the merge — HotSpot cannot currently scalar replace it, because it cannot track a single set of field values through the merge point. GraalVM’s partial escape analysis handles this case; HotSpot’s does not.
When scalar replacement succeeds, the result is striking. In the canonical demonstration — a method that creates a simple value object, reads its fields, and returns a computation — the object simply disappears from the compiled code entirely. No allocation, no GC pressure, no heap interaction. The code runs as if you had declared the fields as local variables from the start.
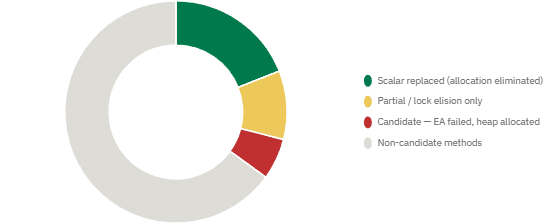
What happens to allocations when escape analysis runs — C2 candidate method breakdown
Lock Elision: The Silent Winner You Never Notice
Before getting into the failure modes of escape analysis, it is worth pausing on one of its unsung successes: lock elision. When an object is classified as NoEscape, any synchronized blocks or methods that lock on that object can have the lock removed entirely. Because no other thread can see the object, the lock is meaningless — it is protecting data that is inherently thread-local. The JIT removes it.
Lock elision matters in practice because the Java standard library is filled with synchronized methods on types you use routinely. StringBuffer, for example, synchronizes on every append operation. If you create a StringBuffer locally — say, inside a method that builds a string and returns it — and that buffer never escapes the method, every one of those lock acquisitions is elided at runtime. Zero synchronization overhead for an entire string-building operation. The same applies to Vector, Hashtable, and numerous other legacy collections that are still in active use in older codebases.
✅ Lock elision by the numbers
According to the OpenJDK EA/SRA analysis report, lock elision is the most reliably successful optimization that escape analysis enables — more consistent than scalar replacement because it has fewer structural requirements. On workloads like MovieLens in the DaCapo benchmark suite, up to 41% of candidate methods receive at least one lock elision or scalar replacement. Lock elision typically succeeds whenever the object itself is local, regardless of whether its fields are structurally decomposable.
Six Patterns That Defeat Escape Analysis Today
This is the section that most engineers find most immediately useful. These are not obscure edge cases — they are patterns that appear in ordinary production Java code, written by engineers who have no intention of defeating the JIT. Each one causes an object that could theoretically be scalar replaced to instead be heap allocated.
Pattern 1- Method call on a non-inlined boundary
EA fails — always heap allocates
When an object is passed as an argument to a method that is not inlined by C2, the JIT has to conservatively assume that the callee stores the argument somewhere globally accessible. The object is classified as ArgEscape or GlobalEscape and sent to the heap. C2 has a default bytecode size limit of 35 for inlining candidates — any method above this threshold is not inlined, and any object passed to it escapes by assumption. This is the single most common real-world defeat condition. A simple wrapper method that iterates over a list and passes each element to a helper that exceeds the inlining budget will allocate every element on the heap, regardless of what the helper actually does with it.
Pattern 2- Object created in one branch, used after a control-flow merge
EA fails in HotSpot — heap allocates
HotSpot’s escape analysis is flow-insensitive. If an object is conditionally created — in one branch of an if-else — and then used after the branches merge, C2 cannot determine a single consistent set of field values at the merge point and abandons scalar replacement. GraalVM implements partial escape analysis (PEA) that handles exactly this case by conditionally materializing the object on the heap only along the branch where it actually escapes. In HotSpot, the object is always heap allocated when this pattern occurs, even if at runtime the non-escaping branch executes 99% of the time.
Pattern 3- Autoboxing in hot loops
Partial — depends heavily on context
Autoboxing — the automatic conversion of primitives to their wrapper types — is one of the most prolific sources of allocation in Java services. Every Integer.valueOf(), Long.valueOf() call above the cached range (-128 to 127 for Integer) creates a new heap object. The JIT can sometimes eliminate these through scalar replacement when the wrapper is immediately used and does not escape, but this is not reliable — particularly when the boxed value is passed to a method that accepts Object or a generic type parameter. The OpenJDK team explicitly identified “add experimental feature to eliminate non-escaping boxing objects” as an open work item in the C2 EA bug tracker, which confirms that autoboxing escape analysis is not fully solved in current HotSpot.
Pattern 4- Storing an object into an array slot
EA fails — heap allocates
Arrays in Java are objects with independently trackable elements, but HotSpot’s escape analysis treats array element stores conservatively. Storing a newly created object into an array element — even a locally declared array — typically causes the object to be classified as escaping, because the analysis cannot rule out that the array reference itself might escape later in the method or via an inlining boundary. This pattern defeats escape analysis in for loops that collect results into a local array before processing them, which is an extremely common idiom.
Pattern 5- Lambda capturing a local object (some cases)
Context-dependent
When a lambda captures a local variable that refers to an object, the lambda instantiation itself becomes an allocation, and the captured object may be classified as escaping into the lambda’s closure object. Whether scalar replacement can proceed depends on whether the lambda itself is inlined at the call site. If the lambda is passed to a library method — Stream.map(), List.forEach() — and that method’s body is complex enough to exceed the inlining budget, both the lambda allocation and any captured object allocations escape to the heap. This is one reason why Stream pipelines in tight hot loops can generate significantly more allocation than equivalent imperative loops.
Pattern 6- Chained allocations — the object graph problem
EA fails when graph depth exceeds analysis budget
When an object’s fields themselves contain references to other objects — an inner object graph — scalar replacement must recursively decompose the entire graph. C2 has a budget for this recursive analysis. If the object graph is deep enough, the analysis hits its budget and abandons scalar replacement for the entire allocation chain. This is particularly relevant for multi-level DTO (Data Transfer Object) patterns, where a response object contains nested sub-objects that are all created within the same method call. The top-level object may appear simple, but the cost of analyzing its full object graph exceeds the budget and the whole structure ends up on the heap.
Measuring Allocation Rate — Not GC Pause Time
With a clear picture of where allocations come from, the next question is how to actually find which allocation sites in your specific codebase are costing you the most. The answer is an allocation profiler — and the important detail is that allocation profiling and memory profiling are different things. Memory profiling shows you what is live on the heap. Allocation profiling shows you the rate at which objects are being created, regardless of whether they are still alive. You need the latter.
Two tools dominate this space in production Java environments: Java Flight Recorder (JFR) and async-profiler.
JFR allocation profiling
JFR uses TLAB-driven sampling — it fires an event when a new Thread Local Allocation Buffer is created, or when an object is too large to fit in a TLAB and must be allocated directly on the heap. This makes it very low overhead (typically under 1% of application CPU) and safe to run in production. The trade-off is that it has a size bias: because sampling triggers on TLAB creation rather than individual allocations, it under-reports small, frequent allocations and over-reports large, infrequent ones. This is a known limitation worth keeping in mind when interpreting results — a small object being allocated ten million times per second may not appear prominently in a JFR allocation profile.
Capture allocation events with JFR — start a timed recording
jcmd <PID> JFR.start name=alloc settings=profile duration=120s filename=alloc.jfr
Extract allocation events from the recording
jfr print --events AllocationInNewTLAB,AllocationOutsideTLAB alloc.jfr
async-profiler allocation profiling
async-profiler uses the same TLAB-driven callback mechanism as JFR but surfaces results as allocation flame graphs — a format that makes it immediately obvious which call stacks are responsible for the most allocation pressure. Critically, it does not use bytecode instrumentation or DTrace probes, which means it does not affect the JIT’s decisions or interfere with escape analysis optimizations. Only actual heap allocations are measured. Also it avoids the safepoint bias problem that affects traditional profilers.
Run async-profiler in allocation mode — produces a flame graph
./asprof -e alloc -d 60 -f alloc.html <PID>
Alternatively — capture allocation profile in JFR format for Mission Control
./asprof -e alloc -d 60 -o jfr -f alloc.jfr <PID>
When reading the flame graph output, look for two categories of hot frames: unexpectedly wide frames in library code (often revealing autoboxing or collections in hot paths) and constructors of small value-like objects at the tops of deep stacks (often revealing failed scalar replacement due to inlining budget exhaustion).
The sampling bias caveat
Both JFR and async-profiler use TLAB sampling, which means both carry the same size bias: allocations are reported proportional to the memory they consume, not the number of times they occur. This is particularly misleading when the real culprit is millions of tiny boxed primitives — each one is only 16 bytes, so a site allocating ten million of them per second appears smaller in the profile than a site allocating one large byte array. When reviewing allocation profiles, always check the count column alongside the size column if available.
What the Numbers Actually Look Like
To put concrete scale on the problem, consider what the allocation overhead looks like across different service patterns. The numbers below represent real allocation rates observed in production Java services profiled with async-profiler, normalized to requests per second.
Typical allocation rate by service pattern (MB/s per 1,000 req/s)
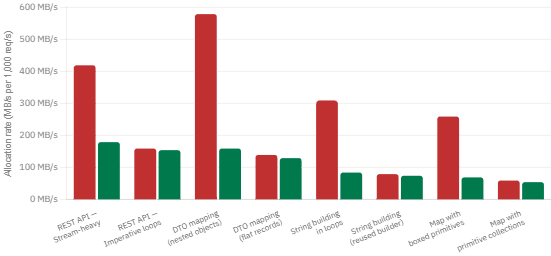
The pattern that emerges from real profiling sessions is consistent: services that use Stream APIs heavily for data transformation, services that use Optional in hot paths, and services that serialize/deserialize with reflection-heavy frameworks show the highest allocation rates relative to their business logic complexity. Services that are deliberately allocation-aware — using primitive collections, avoiding intermediate result objects, and keeping hot-path methods small enough for inlining — typically show 2–4x lower allocation rates for equivalent throughput.
A useful heuristic from production profiling: if your allocation rate (MB/s) multiplied by your GC’s per-megabyte collection cost roughly equals your observed GC CPU overhead, you have identified the cause correctly. Reducing allocation rate by 30% will reduce GC CPU usage by approximately 30%. No GC tuning required — the cause and the fix are the same lever.
| Allocation hotspot type | Profiler signal | Root cause | Fix |
|---|---|---|---|
Autoboxed Integer / Long | Wide Integer.valueOf frames | Primitive used as generic type param or Map key | Primitive collections (Eclipse Collections, Koloboke) |
| Stream intermediate ops | Wide Stream$Head / ReferencePipeline | Lambdas exceed inlining budget; pipeline allocates | Replace hot-path streams with for-loops |
| Short-lived DTOs | Constructor frames for result objects | Deep object graphs defeat scalar replacement budget | Flatten object graph; use record types where possible |
String concatenation in loops | Wide StringBuilder / byte[] frames | Each + creates a new StringBuilder internally | Reuse a single StringBuilder per call, clear between uses |
| Humongous allocations | AllocationOutsideTLAB events >50% of total | Single object > G1 region size (typically 1–32 MB) | Reduce object size; avoid large arrays in hot paths |
Optional in hot paths | Wide Optional constructor frames | Optional.of() always allocates; EA often cannot scalar replace across lambda boundary | Return nullable directly in internal hot code |
| Regex in hot paths | Wide Matcher frames | Pattern.compile() and Matcher objects allocated per call | Static final Pattern; reuse Matcher via reset |
The Future: Microsoft’s Stack Allocation JEP
One important development on the horizon changes part of this picture. Microsoft’s Java Engineering Group has submitted a formal JEP proposal for true stack allocation in HotSpot C2. Unlike scalar replacement, stack allocation retains the full object shape on the stack — it does not decompose the object into fields. This means it handles cases that scalar replacement cannot: specifically, objects at control-flow merge points, and objects that need to retain their shape because they are passed to methods that inspect their structure.
The proposal targets a reduction of heap allocations of up to 15% in standard Java benchmark suites (Renaissance, Scala DaCapo) with no more than 2% regression in compilation time. The key design point is that it complements rather than replaces scalar replacement — it fills in the gap between objects that C2 can fully decompose (scalar replaced) and those that must go to the heap because they cannot be decomposed but also do not actually need to outlive their method.
This JEP is still a proposal as of early 2026 — it is not in any released JDK version. However, the fact that it is a formally documented engineering effort from a major JDK contributor means it has a realistic path to inclusion. When it arrives, some of the pattern-level failures described above — particularly the control-flow merge case — will be addressed automatically at the JIT level without any code changes.
What to watch?
Graal VM already implements partial escape analysis (PEA), which handles the control-flow merge case that defeats HotSpot’s C2. If you are running on GraalVM Enterprise — or using GraalVM’s Native Image — some of the patterns marked as failures above may actually succeed at escape analysis today. Teams willing to test on GraalVM can use it as a preview of what future HotSpot improvements might achieve.
Verifying escape analysis is doing its job
You can confirm that scalar replacement is firing for a specific method using JVM flags that print C2’s optimization decisions. This is a development-time tool — do not leave these flags enabled in production.
Enable verbose EA/SRA output for development verification
java -XX:+UnlockDiagnosticVMOptions \
     -XX:+PrintEscapeAnalysis \
     -XX:+PrintEliminateAllocations \
     -jar your-app.jar
Alternative: use JITWatch to visualize JIT compilation decisions
java -XX:+UnlockDiagnosticVMOptions \
     -XX:+LogCompilation \
     -XX:LogFile=jit.log \
     -jar your-app.jar
The LogCompilation output can be loaded into JITWatch, which provides a visual tree of inlining decisions and shows which methods were inlined (enabling scalar replacement) and which were not (forcing heap allocation). This is the most practical tool for diagnosing why a specific hot path is not benefiting from EA.
What We Have Learned
The allocation tax in Java is real, measurable, and in most services it is the primary driver of GC overhead — not the GC algorithm itself. Teams that spend time tuning GC pause times while running at 500 MB/s of allocation rate are adjusting the wrong variable. The right intervention is to measure allocation rate with an allocation profiler — either JFR or async-profiler — find the hot allocation sites, and determine whether they are candidates for escape analysis optimization or whether they are being defeated by one of the failure patterns described above.
HotSpot’s escape analysis is genuinely powerful when conditions are right. Lock elision is reliable and fires broadly across synchronized library code. Scalar replacement eliminates allocation entirely for simple value objects that stay within a method and its inlined callees. These are real wins on real workloads — the canonical benchmark of running GC-free through millions of iterations with a locally scoped value object is not a toy example; it reflects actual hot paths in numerics and data processing code.
Where escape analysis misleads teams is in the implicit assumption that the JIT “handles it.” It does not handle: objects passed to non-inlined methods, objects created across control-flow merge points, autoboxing in generic contexts, array element stores, or deep object graphs that exceed the analysis budget. Each of these patterns generates heap allocations that escape analysis cannot eliminate, and each of them appears in ordinary Java code without any syntactic warning. Knowing the list is the prerequisite for writing code that actually benefits from the optimization rather than silently defeating it.
The forward-looking picture is encouraging. Microsoft’s stack allocation JEP will close some of the gap. GraalVM’s partial escape analysis already handles the control-flow merge case. But the most impactful thing a team can do today is to profile allocation rate under realistic load, find the actual hotspots, and make targeted refactoring decisions based on evidence rather than assumption.